 30-Plex
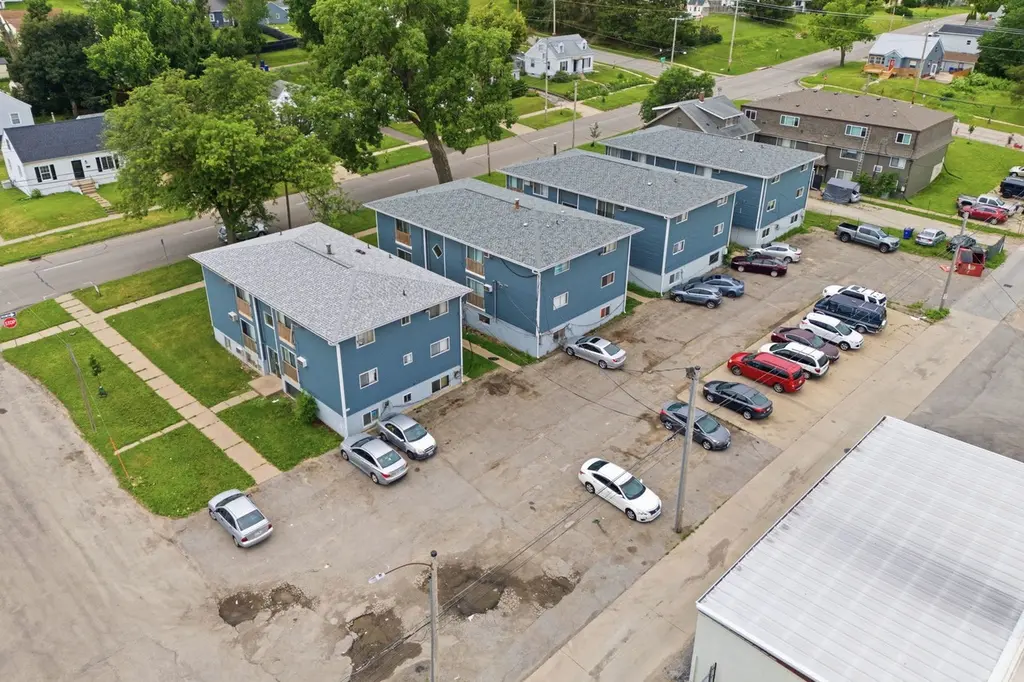
806 15th Ave SW · Cedar Rapids, IA
Flood risk 1/10 · Minimal
- FEMA flood zone
- X (unshaded)
- Chance of flooding over 30 yrs
- 0.0%
- Est. flood insurance / yr
- $507 – $1,088
Fire risk 1/10 · Minimal
- Est. fire insurance / yr
- $902 – $1,676
Heat risk 3/10 · Minor
- Hot days now (above 103°F)
- 7 days/yr
- Hot days in 30 yrs
- 15 days/yr
Wind risk 2/10 · Minimal
- Chance of severe wind over 30 yrs
- —
Air-quality risk 2/10 · Minimal
- Unhealthy air days now
- 0 days/yr
- Unhealthy air days in 30 yrs
- 1 days/yr
Risk factors via First Street. Map © Google.
Why this score? — see what drove the B grade
The composite is a weighted blend of 9 inputs, each scored 0–100. Each bar is that input's sub-score; the figure is the points it added to the 100-point composite (weight × sub-score).
- Cash flow +30.0/30.0
- 1% rule +10.0/10.0
- DSCR +10.0/10.0
- ARV discount +7.5/15.0
- Rent growth +4.7/5.0
- Schools +4.7/10.0
- Livability +3.9/5.0
- Condition / age +2.5/5.0
- Appreciation +0.0/10.0
$1,900,000
🖨 Deal sheet 📄 Offer letter ✓ Due diligence
Multi-family units
County records classify this as Multi-Family (5+ Unit). Listing-text estimate: 30 units. confirmed
5+ unit building — per-unit beds/baths from public records are typically unavailable; the breakdown below (if shown) is an estimate from the listing text.
Listing remarks
Blue Jay Apartments offers the opportunity to acquire a 30-unit multifamily investment property in southwest Cedar Rapids, IA. The four-building complex features a desirable mix of 14 one-bedroom and 16 two-bedroom apartments, ample off-street parking, and common area laundry facilities. Conveniently located near the 1st Avenue retail corridor, the Property provides easy access to shopping, healthcare, restaurants, major employers, and transportation routes throughout the Cedar Rapids metro area. Current ownership has completed significant capital improvements, including new roofs, gutters, soffits, and vinyl siding since 2021, along with replacement of all four boilers in 2024. Approximate
Key facts
- New roofs
- New gutters
- 0.66 acre lot
Tags
Property features AI
Finance
- Other: Parcel number 143210200200000
- Financial info: Total monthly income reported around $20,476; Gross annual income reported around $249,630; Gross rent multiplier reported as 7.61; Unit-level monthly income ranges: two-bedroom units roughly $640–$925; one-bedroom units roughly $470–$650
Exterior
- Home design: Multi-family property (5+ units); Total of 30 units
- Construction: Built before 1978
- Exterior features: Lot dimensions approximately 140 x 205; Zoned for multi-family
Interior
- Bedrooms: Two-bedroom units (18 units); One-bedroom units (12 units)
- Bathrooms: One full bathroom per unit for both unit types
- Heating & cooling: Separate heating and ventilation for each unit
- Interior features: Separate heating/ventilation per unit
Neighborhood map
What this means for you Summary
Snapshot
- This is a 30 × 48-bed/30.0-bath units multifamily listed at $1.90M.
Deal economics
- At list price, monthly cash flow is $23k ($281k/yr) — positive. Per door: $781/mo.
- The deal already cash-flows at list — no discount required.
- Meets the 1% rule at list price ($46k rent vs $1.90M).
- Cap rate 21.1% vs local median 3.5% in Cedar Rapids — top-decile yield for the area; either an underpriced asset or a hidden risk that comps aren't pricing in. Stress-test before assuming the spread holds.
Location & tenants
- Location reads 78/100 on livability (#134 in IA, #2,474 nationally) — a middle-class / working-renter tenant base. Strengths: cost of living A+, housing A+, health & safety A+; Watch: crime C-, commute F.
- Cedar Rapids Community School District (urban): math 50% / reading 59% proficiency, ranked #265 of 289 in IA (top 92%) — acceptable for families but not a draw, mixed tenant base, ~2y average lease.
- Market conditions: Rents rising fast (+8.8%/yr); 415 active listings in the ZIP; 1,023 units permitted in Linn County in 2024 (456 in 5+ unit buildings).
- At $45,775/mo this rent would consume 888% of the median local household income ($62k/yr) (locally 1041% of renters already pay >50% of income on rent) — very limited rent-growth headroom before tenants either downsize or default.
Forward outlook
- Local home prices are declining (-3.0%/yr); year-one equity from $13k of loan paydown is wiped out by about $57k of value loss. Plan a longer hold.
- Linn County population projected at +16% by 2050 — long-run rental-demand tailwind backs the buy-and-hold thesis.
- At projected returns (-3.0% appreciation + 8.0% rent growth), your $532k cash investment doubles in ~3 years — after that, you're playing with house money.
Negotiation context
- Only 1 days on market — expect competitive offers; lowballing is unlikely to land.
- 3 sale attempts since 3y ago with the ask held roughly flat each time — persistent listings suggest the price (not the market) is what's stuck; bring a comps-based counter.
- Current owner paid $1.30M; 46% above their basis — modest negotiation headroom, anchor on the comps not their cost.
Questions for the listing agent
- Can we see the unit-by-unit rent roll, current vacancy, and any below-market leases? What's the average tenancy length?
- What capital expenditures (roof, boiler, parking lot, exteriors) have been made in the last 5 years, and what's planned in the next 2?
- Built in 1968 — when were the roof, HVAC, electrical panel, plumbing, and water heater last replaced?
- Is there a deadline driving the sale (1031 exchange, divorce, estate, relocation)? That informs how much negotiation room exists.
- Schools are B-rated — typically a magnet for longer-tenancy family renters. What's the average tenant stay here, and is there a school-zone premium baked into asking?
- What's the average days-on-market for RENTAL listings here right now (not sales)? A rising rental-DOM trend means longer vacancies and softer asking-rent achievability than the comps imply.
- What's the recent tenant-quality profile in this submarket — average credit score on applications, eviction rate, late-payment / NSF rate, and stable-employment percentage? A property-management company in the area should have these aggregated.
- How much new apartment / multifamily construction is in the pipeline within 1–3 miles? Heavy new supply (>2% of stock underway) typically softens rents 12–24 months out; light construction supports rent growth.
Investment metrics
- 1% rule
- 2.41% ✓
- Cap rate
- 21.08%
- Cash-on-cash
- 52.82%
- DSCR
- 3.35
- GRM
- 3.5
CMA / ARV
No comps found within radius.
Projected returns pro-forma
-3.0% appreciation · 8.0% rent growth · sell at horizon
- IRR
- 56.4%
- Equity multiple
- 3.68×
- Total profit
- $1,425,983
- Equity at exit
- $283,296
- IRR
- 63.2%
- Equity multiple
- 9.02×
- Total profit
- $4,265,142
- Equity at exit
- $164,277
Cash invested: $532,000 (down + closing). Projections, not guarantees.
Landlord ↔ Tenant lean methodology
- Overall (STATE)
- 83 Strongly Landlord-Friendly
- State Iowa
- 83 Strongly Landlord-Friendly · R+6
- County
- — inherits STATE
- City
- — inherits STATE
ZIP-level market 52404
- Rents YoY
- 8.8%
- Active inventory
- 415
- Price-to-rent
- 103.8×
Monthly cashflow live
- Estimated rent
- $45,775 medium interval (Pro) →
- Mortgage (P&I)
- −$9,964
- Tax from tax record
- −$1,989 /mo · $23,866/yr
- Insurance
- −$792
- HOA
- −$0
- Vacancy / Maint / Mgmt
- −$9,613
- Net cashflow
- $23,418
Break-even live
30-unit breakdown (identical units grouped — click to expand)
| Units | Beds | Baths | Est. rent |
|---|---|---|---|
| 30× units | 48 | 30 | $45,780 |
| #1 | 48 | 30 | $1,526 |
| #2 | 48 | 30 | $1,526 |
| #3 | 48 | 30 | $1,526 |
| #4 | 48 | 30 | $1,526 |
| #5 | 48 | 30 | $1,526 |
| #6 | 48 | 30 | $1,526 |
| #7 | 48 | 30 | $1,526 |
| #8 | 48 | 30 | $1,526 |
| #9 | 48 | 30 | $1,526 |
| #10 | 48 | 30 | $1,526 |
| #11 | 48 | 30 | $1,526 |
| #12 | 48 | 30 | $1,526 |
| #13 | 48 | 30 | $1,526 |
| #14 | 48 | 30 | $1,526 |
| #15 | 48 | 30 | $1,526 |
| #16 | 48 | 30 | $1,526 |
| #17 | 48 | 30 | $1,526 |
| #18 | 48 | 30 | $1,526 |
| #19 | 48 | 30 | $1,526 |
| #20 | 48 | 30 | $1,526 |
| #21 | 48 | 30 | $1,526 |
| #22 | 48 | 30 | $1,526 |
| #23 | 48 | 30 | $1,526 |
| #24 | 48 | 30 | $1,526 |
| #25 | 48 | 30 | $1,526 |
| #26 | 48 | 30 | $1,526 |
| #27 | 48 | 30 | $1,526 |
| #28 | 48 | 30 | $1,526 |
| #29 | 48 | 30 | $1,526 |
| #30 | 48 | 30 | $1,526 |
| Total (30 units) | $45,775 | ||
UW: 25.0% down · 7.5% · 30yr · 1.5% tax · 5.0% vac · 8.0% maint · 8.0% mgmt
Financing live
Cash to close
- Down payment
- $475,000
- Closing costs
- $57,000
- Reserves months
- —
- Total cash needed
- —
Loan-product check · same deal, 3 products live
Conventional
25% down · 7.5% · 30yr
- Down + closing
- —
- Monthly P&I
- —
- Monthly cashflow
- —
- DSCR
- —
- Eligible?
- —
Personal DTI + credit; lowest rate.
DSCR
20% down · 8.5% · 30yr
- Down + closing
- —
- Monthly P&I
- —
- Monthly cashflow
- —
- DSCR
- —
- Eligible?
- —
No personal income docs; deal must DSCR.
Hard money
10% down · 12.0% · 12mo
- Down + closing
- —
- Monthly P&I
- —
- Monthly cashflow
- —
- DSCR
- —
- Eligible?
- —
Short-term bridge; refi at stabilization.
Listing history 2 events
-
2026-06-18remarks 699-char remark
-
2026-06-18$1,900,000 Active 1 DOM
ⓘ Source: listings_history table (triggers on properties + properties_extension) + one-shot
backfill from property_details.listing_events for pre-trigger history.
Tax reassessment forecast IA · Partial reset (capped growth)
- Current annual tax
- $23,866 · $1,989/mo
- Projected year-2 tax
- $26,848 · $2,237/mo
- Expected delta
- +$2,982/yr (+$248/mo · 12.5%)
ⓘ Screening estimate from a state-policy table — verify with the county assessor before closing.
Climate risk First Street
- Flood 1/10 Low FEMA zone X (unshaded) · 0% chance over 30 yrs
- Wildfire 1/10 Low
- Heat 3/10 Moderate 7 d/yr ≥103°F today · 15 d/yr by 30 yrs out
- Wind 2/10 Low
- Air quality 2/10 Low 0 unhealthy d/yr today · 1 by 30 yrs out
Nearby sold comps map
Loading sold comps map…
Walkable amenities ~0.75 mi
Loading nearby amenities…
Taxation est. · year 1
- Rental income
- $549,300
- − Mortgage interest
- −$106,430
- − Property taxes
- −$23,866
- − Insurance
- −$9,500
- − Repairs & maintenance
- −$43,944
- − Management
- −$43,944
- − Depreciation
- −$55,273
- Taxable income
- $266,344
- Est. tax owed @ 24.0%
- −$63,922
- After-tax cash flow
- $217,093/yr
For passive investors: Depreciation is non-cash, so a rental often shows a tax loss while cash-flowing — sheltering income. Rental losses are passive: they offset passive income freely, and up to $25,000/yr can offset ordinary (W-2) income if you actively participate and your MAGI is under $100k (phasing out to $0 by $150k); unused losses carry forward. On sale, claimed depreciation is recaptured at up to 25%, and gains may owe capital-gains tax (a 1031 exchange can defer both). Figures are a year-1 estimate at your 24.0% rate — not tax advice; consult a CPA.
Schools (NCES district)
- District
- Cedar Rapids Community School District
- NCES district ID
- 1906540
- Math proficiency
- 50% ▼ -12.00%
- Reading proficiency
- 59% ▼ -6.00%
- Median HH income
- $53,568
- Composite
- 46.82/100
- National rank
- #2378
- State rank
- #265 of 289 in IA
Livability — Cedar Rapids
- Score
- 78/100
- State rank
- #134
- US rank
- #2474
Category grades
Schools grade is shown separately in the Schools card above.
Census & demographics
- Census place
- Cedar Rapids, IA
- County
- Linn County · 179,860 people
- City population
- 137,154
- Metro
- Cedar Rapids, IA
- Population (ZIP)
- 42,958
- Household income
- $61,870
- Rent vs Own
- Severe rent burden
- 1041.0
Population outlook (Linn County) Hauer SSP2
- Today (2025)
- 239,589 people
- By 2030
- 248,587 · +3.8%
- By 2040
- 264,817 · +10.5%
- By 2050
- 278,685 · +16.3%
- By 2075
- 311,754 · +30.1%
- By 2100
- 336,773 · +40.6%
Race, ethnicity, and origin ACS 2023
- Neighborhood character
- Predominantly White (74%)
- Race & ethnicity
- White 74% Black 10% Two or more races 10% Hispanic / Latino 7%
- Hispanic origin (detail)
- Mexican 5%
- Common ancestry
- Portuguese 3% Lithuanian 2% Romanian 2%
- Foreign-born
- 8% · Canada
- Languages at home
- 90% English-only · Spanish 3% French/Haitian/Cajun 2% Other Asian/Pacific 1%
Political lean MEDSL · Linn
- 2024 margin
- Lean D (+9.9) · D 54.2% · R 44.3% · Other 1.4%
- 2008→2024 swing
- -11.6pp toward R · 2008: 21.5pp · 2024: 9.9pp
- All cycles
- 2024: D+9.9 2020: D+13.7 2016: D+9.0 2012: D+17.6 2008: D+21.5
Not yet ingested
- Civics
- —
Market trends
- HPI YoY
- ▼ -154.96%
- Current HPI
- 241.81
- Rent YoY
- ▲ 8.79%
- Metro
- Cedar Rapids, IA
- State GDP YoY
- ▲ 2.48%
- F500 in state
- 4
Industry mix (Fortune 500 HQ in IA)
| Industry | F500 HQs | Revenue |
|---|---|---|
| Financial Services | 1 | $16B |
|
||
| Retail / Convenience | 1 | $15B |
|
||
Price history
+91.9% since first listed7 events — show timeline
- 2026-06-18 Listed $1,900,000 MRED as Distributed by MLS Grid
- 2024-08-15 Sold (Public Records) $1,300,000 Public Records
- 2023-11-17 Rental Removed $775 APPFOLIO
- 2023-11-10 Listed for Rent $775 APPFOLIO
- 2023-10-01 Rental Removed $775 APPFOLIO
- 2023-09-16 Listed for Rent $775 APPFOLIO
- 2021-05-06 Sold (Public Records) $990,000 Public Records
Property tax history
+4.2%/yrLatest (2025): $23,866 · +36.2% YoY. Source: county tax records.
Cash-flow waterfall
monthlySold comps — $/sqft
last 12 mo · ≤1 miLoading sold comps…