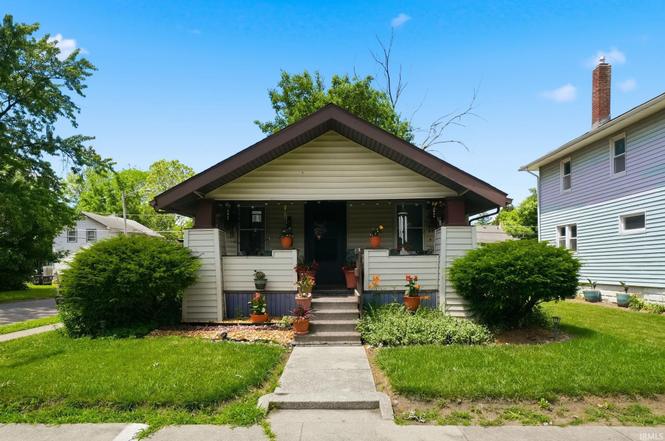
2822 Central Dr · Fort Wayne, IN
Flood risk 1/10 · Minimal
- FEMA flood zone
- X (unshaded)
- Chance of flooding over 30 yrs
- 0.0%
- Est. flood insurance / yr
- $473 – $860
Fire risk 1/10 · Minimal
- Est. fire insurance / yr
- $717 – $1,331
Heat risk 3/10 · Minor
- Hot days now (above 100°F)
- 7 days/yr
- Hot days in 30 yrs
- 17 days/yr
Wind risk 2/10 · Minimal
- Chance of severe wind over 30 yrs
- —
Air-quality risk 3/10 · Minor
- Unhealthy air days now
- 2 days/yr
- Unhealthy air days in 30 yrs
- 3 days/yr
Risk factors via First Street. Map © Google.
Why this score? — see what drove the C grade
The composite is a weighted blend of 9 inputs, each scored 0–100. Each bar is that input's sub-score; the figure is the points it added to the 100-point composite (weight × sub-score).
- Cash flow +19.9/30.0
- ARV discount +15.0/15.0
- DSCR +6.3/10.0
- 1% rule +5.1/10.0
- Livability +4.2/5.0
- Rent growth +3.7/5.0
- Condition / age +2.5/5.0
- Schools +2.2/10.0
- Appreciation +0.0/10.0
$99,900
🖨 Deal sheet (PDF) 📄 Offer letter ✓ Due diligence
Listing remarks
This 2-bedroom, 1-bath rental property is currently OCCUPIED and generating $710 per month in rental income, with ALL UTILITIES PAID BY THE TENANT for simplified ownership and management. The property includes a refrigerator and oven/range, along with a full basement that provides additional storage space. Recent foundation updates and repairs add long-term stability and peace of mind for investors. Conveniently located near McMillen Park and Weisser Park, and within 5 minutes of shopping and dining, this property offers a strong combination of location and steady rental income. For investors looking to expand, this property can also be included as part of a 5-unit single-family investment
Key facts
- Foundation updates
- Near mcmillen park
- Near weisser park
Tags
Property features AI
Finance
- Other: Pets allowed with breed restrictions
Exterior
- Parking: On-street parking
- Utilities: Public water; Public sewer
- Home design: Residential income property; Single-story; Vinyl siding
- Construction: Vinyl siding construction; Asphalt shingle roof; Full unfinished basement
- Exterior features: Covered patio; Wood fencing; Corner, level lot (approx. 81 x 40)
Interior
- Kitchen: Range; Refrigerator
- Bathrooms: 1 full bathroom; 2 main-level bathrooms
- Heating & cooling: Forced air heating; Natural gas
- Interior features: Range; Refrigerator; Full unfinished basement; Covered patio
- Laundry & utility: Washer hookup
Neighborhood map
What this means for you Summary
Snapshot
- This is a 2-bed/1.0-bath single-family listed at $100k.
Deal economics
- At list price, monthly cash flow is $121 ($1k/yr) — positive.
- The deal already cash-flows at list — no discount required.
- Meets the 1% rule at list price ($1k rent vs $100k).
- Cap rate 7.7% vs local median 4.8% in Fort Wayne — top-decile yield for the area; either an underpriced asset or a hidden risk that comps aren't pricing in. Stress-test before assuming the spread holds.
Location & tenants
- Location reads 84/100 on livability (#6 in IN, #676 nationally) — a professional / high-income tenant draw. Strengths: amenities A+, commute A+, cost of living A+; Watch: crime C-, employment D+.
- Fort Wayne Community Schools (urban): math 22% / reading 29% proficiency, ranked #263 of 301 in IN (top 87%) — low school quality limits family demand, transient renter base, plan for 1-2y turnover; 60% free/reduced lunch — lower-income household profile, screen leases tightly.
- Zoned schools: J Wilbur Haley Elementary School (math 19% / reading 20%, grade F, #814 of 994 statewide, top 83%, 568 students, 65% FRL); Lane Middle School (math 9% / reading 20%, grade F, #300 of 330 statewide, top 91%, 710 students, 74% FRL); R Nelson Snider High School (math 27% / reading 53%, grade F, #217 of 369 statewide, top 59%, 1,899 students, 50% FRL) — zoned schools at 63% FRL track the district average.
- Market conditions: Rents rising fast (+4.9%/yr); 129 active listings in the ZIP; 18 comparable units currently listed for rent nearby; rentals at typical pace (median 22d on market — plan ~3-4 weeks tenant-placement turnaround); 1,861 units permitted in Allen County in 2024 (576 in 5+ unit buildings).
Forward outlook
- Local home prices are declining (-3.0%/yr); year-one equity from $691 of loan paydown is wiped out by about $3k of value loss. Plan a longer hold.
- Allen County population projected at +10% by 2050 — modest demand growth; plan on rents tracking national, not racing it.
Negotiation context
- Only 2 days on market — expect competitive offers; lowballing is unlikely to land.
Risks & watch-outs
- Watch-outs: built in 1930 — expect roof / HVAC / electrical / plumbing capex.
Questions for the listing agent
- Built in 1930 — when were the roof, HVAC, electrical panel, plumbing, and water heater last replaced?
- Is there a deadline driving the sale (1031 exchange, divorce, estate, relocation)? That informs how much negotiation room exists.
- Schools are D-rated, which usually means shorter tenancies and higher turnover. Who's the typical renter profile here, and what's been the actual vacancy rate?
- What's the average days-on-market for RENTAL listings here right now (not sales)? A rising rental-DOM trend means longer vacancies and softer asking-rent achievability than the comps imply.
- What's the recent tenant-quality profile in this submarket — average credit score on applications, eviction rate, late-payment / NSF rate, and stable-employment percentage? A property-management company in the area should have these aggregated.
- How much new for-sale + rental construction is in the pipeline within 1–3 miles? Heavy new supply typically softens prices + rents 12–24 months out; constrained supply supports both.
Investment metrics
- 1% rule
- 1.01% ✓
- Cap rate
- 7.75%
- Cash-on-cash
- 5.20%
- DSCR
- 1.23
- GRM
- 8.2
CMA / ARV
- ARV (on-the-fly)
- $121,968
- Comps found
- 12
Show comp detail 12 sales within ~0.75 mi
| Address | Dist | Beds/Ba | Sqft | Sold | Price | $/sf | Match |
|---|---|---|---|---|---|---|---|
| 3202 S Anthony Blvd | 0.28mi | 2/1.0 | 900 (-3%) | 4mo | $67,500 | $75 | 80 |
| 1426 Eckart St | 0.37mi | 2/2.0 | 960 (+4%) | 1mo | $139,000 | $145 | 72 |
| 3105 Plaza Dr | 0.21mi | 3/1.0 (+1) | 993 (+8%) | 4mo | $60,000 | $60 | 69 |
| 3127 Holton Ave | 0.42mi | 2/1.0 | 984 (+6%) | 1mo | $53,000 | $54 | 69 |
| 3627 Plaza Dr | 0.52mi | 3/1.0 (+1) | 936 (+1%) | 4mo | $126,500 | $135 | 65 |
| 3629 Robinwood Dr | 0.63mi | 2/1.0 | 880 (-5%) | 1mo | $130,000 | $148 | 62 |
| 3419 Robinwood Dr | 0.53mi | 3/1.0 (+1) | 960 (+4%) | 4mo | $73,000 | $76 | 60 |
| 1514 E Creighton Ave | 0.48mi | 2/1.0 | 1,013 (+10%) | 2mo | $110,000 | $109 | 60 |
| 3202 Queen St | 0.33mi | 3/1.5 (+1) | 1,008 (+9%) | 4mo | $150,000 | $149 | 59 |
| 2533 Evans St | 0.43mi | 3/1.0 (+1) | 1,000 (+8%) | 5mo | $137,000 | $137 | 57 |
| 3618 Robinwood Dr | 0.63mi | 2/1.0 | 982 (+6%) | 6mo | $120,000 | $122 | 55 |
| 2623 Trentman Ave | 0.55mi | 3/1.0 (+1) | 1,025 (+11%) | 2mo | $135,000 | $132 | 49 |
Match score weights: distance 35% · size 25% · config 20% · recency 20%. Top-matched comps best support the ARV.
Projected returns pro-forma
-3.0% appreciation · 4.93% rent growth · sell at horizon
- IRR
- -6.1%
- Equity multiple
- 0.77×
- Total profit
- $-6,458
- Equity at exit
- $14,895
- IRR
- 5.7%
- Equity multiple
- 1.46×
- Total profit
- $12,906
- Equity at exit
- $8,638
Cash invested: $27,972 (down + closing). Projections, not guarantees.
Landlord ↔ Tenant lean methodology
- Overall (STATE)
- 90 Strongly Landlord-Friendly
- State Indiana
- 90 Strongly Landlord-Friendly · R+11
- County
- — inherits STATE
- City
- — inherits STATE
ZIP-level market 46806
- Home prices YoY
- -33.6%
- Rents YoY
- 4.9%
- Active inventory
- 129
- Price-to-rent
- 8.2×
Monthly cashflow live
- Estimated rent
- $1,013 high interval (Pro) →
- Mortgage (P&I)
- −$524
- Tax from tax record
- −$114 /mo · $1,363/yr
- Insurance
- −$42
- HOA
- −$0
- Vacancy / Maint / Mgmt
- −$213
- Net cashflow
- $121
Break-even live
Sensitivity live
| Price | -10% $178 | -5% $149 | +0% $121 | +5% $93 | +10% $65 |
|---|---|---|---|---|---|
| Rent | -10% $41 | -5% $81 | +0% $121 | +5% $161 | +10% $201 |
| Rate | -1.0pp $171 | -0.5pp $147 | base $121 | +0.5pp $95 | +1.0pp $69 |
UW: 25.0% down · 7.5% · 30yr · 1.5% tax · 5.0% vac · 8.0% maint · 8.0% mgmt
Financing live
Cash to close
- Down payment
- $24,975
- Closing costs
- $2,997
- Reserves months
- —
- Total cash needed
- —
Loan-product check · same deal, 3 products live
Conventional
25% down · 7.5% · 30yr
- Down + closing
- —
- Monthly P&I
- —
- Monthly cashflow
- —
- DSCR
- —
- Eligible?
- —
Personal DTI + credit; lowest rate.
DSCR
20% down · 8.5% · 30yr
- Down + closing
- —
- Monthly P&I
- —
- Monthly cashflow
- —
- DSCR
- —
- Eligible?
- —
No personal income docs; deal must DSCR.
Hard money
10% down · 12.0% · 12mo
- Down + closing
- —
- Monthly P&I
- —
- Monthly cashflow
- —
- DSCR
- —
- Eligible?
- —
Short-term bridge; refi at stabilization.
Rent comps 18 comps
| Address | Beds | Baths | Sqft | Rent | $/sqft | DOM | Units | Dist |
|---|---|---|---|---|---|---|---|---|
| 3410 S Anthony Blvd Fort Wayne, IN | 3.0 | 1.0 | 900 | $1,200 | $1.33 | 44d | 1 | 0.35mi |
| 3932 Winter St Fort Wayne, IN | 2.0 | 1.0 | 750 | $875 | $1.17 | 44d | 1 | 0.71mi |
| 4014 Oliver St Fort Wayne, IN | 3.0 | 1.0 | 936 | $1,050 | $1.12 | 14d | 1 | 0.86mi |
| 4129 Bowser Ave Fort Wayne, IN | 3.0 | 1.5 | 850 | $1,250 | $1.47 | 21d | 1 | 0.90mi |
| 4330 S Anthony Blvd Unit 4402 Fort Wayne, IN | 1.0 | 1.0 | 575 | $900 | $1.57 | 14d | 1 | 0.95mi |
| 4325 Werling Dr Fort Wayne, IN | 1.0–3.0 | 1.0–2.0 | 923 | $1,008 | $1.09 | 44d | 1 | 0.95mi |
| 859 Buchanan St Fort Wayne, IN | 1.0–4.0 | 1.0 | 887 | $900 | $1.01 | 21d | 1 | 0.96mi |
| 442 E Wildwood Ave Fort Wayne, IN | 2.0 | 1.0 | 864 | $875 | $1.01 | 21d | 1 | 1.02mi |
| 4705 S Anthony Blvd Fort Wayne, IN | 3.0 | 1.0 | 1110 | $1,050 | $0.95 | 14d | 1 | 1.18mi |
| 4121 Monroe St Fort Wayne, IN | 2.0 | 1.0 | 725 | $1,100 | $1.52 | 14d | 1 | 1.18mi |
| 3801 Lafayette St Fort Wayne, IN | 2.0 | 1.0 | 1116 | $995 | $0.89 | 14d | 1 | 1.20mi |
| 3127 Pennsylvania St Fort Wayne, IN | 2.0 | 1.0 | 696 | $1,000 | $1.44 | 14d | 1 | 1.25mi |
| 4522 Spatz Ave Fort Wayne, IN | 2.0 | 1.0 | 840 | $950 | $1.13 | 44d | 1 | 1.26mi |
| 4126 Lafayette St Fort Wayne, IN | 2.0 | 1.0 | 775 | $1,275 | $1.65 | 44d | 1 | 1.34mi |
| 4018 S Clinton St Fort Wayne, IN | 3.0 | 1.0 | 860 | $1,000 | $1.16 | 21d | 1 | 1.37mi |
| 2919 S Harrison St Unit 2921 Fort Wayne, IN | 2.0 | 1.0 | 538 | $825 | $1.53 | 21d | 1 | 1.40mi |
| 3113 S Harrison St Unit 2 Fort Wayne, IN | 2.0 | 1.0 | 600 | $850 | $1.42 | 14d | 1 | 1.40mi |
| 4331 Lafayette St Fort Wayne, IN | 2.0 | 1.0 | 810 | $925 | $1.14 | 14d | 1 | 1.41mi |
Listing history 3 events
-
2026-06-18days on market $99,900 Active 2 DOM
-
2026-06-16remarks 699-char remark
-
2026-06-16$99,900 Active 1 DOM
ⓘ Source: listings_history table (triggers on properties + properties_extension) + one-shot
backfill from property_details.listing_events for pre-trigger history.
Tax reassessment forecast IN · Partial reset (capped growth)
- Current annual tax
- $1,363 · $114/mo
- Projected year-2 tax
- $1,363 · $114/mo
- Expected delta
- $0/yr ($0/mo · 0.0%)
ⓘ Screening estimate from a state-policy table — verify with the county assessor before closing.
Climate risk First Street
- Flood 1/10 Low FEMA zone X (unshaded) · 0% chance over 30 yrs
- Wildfire 1/10 Low
- Heat 3/10 Moderate 7 d/yr ≥100°F today · 17 d/yr by 30 yrs out
- Wind 2/10 Low
- Air quality 3/10 Moderate 2 unhealthy d/yr today · 3 by 30 yrs out
Nearby sold comps map
Loading sold comps map…
Walkable amenities ~0.75 mi
Loading nearby amenities…
Taxation est. · year 1
- Rental income
- $12,155
- − Mortgage interest
- −$5,596
- − Property taxes
- −$1,363
- − Insurance
- −$500
- − Repairs & maintenance
- −$972
- − Management
- −$972
- − Depreciation
- −$2,906
- Taxable loss
- −$154
- Est. tax savings @ 24.0%
- +$37
- After-tax cash flow
- $1,491/yr
For passive investors: Depreciation is non-cash, so a rental often shows a tax loss while cash-flowing — sheltering income. Rental losses are passive: they offset passive income freely, and up to $25,000/yr can offset ordinary (W-2) income if you actively participate and your MAGI is under $100k (phasing out to $0 by $150k); unused losses carry forward. On sale, claimed depreciation is recaptured at up to 25%, and gains may owe capital-gains tax (a 1031 exchange can defer both). Figures are a year-1 estimate at your 24.0% rate — not tax advice; consult a CPA.
Schools (NCES district)
- District
- Fort Wayne Community Schools
- NCES district ID
- 1803630
- Math proficiency
- 22% ▼ -11.00%
- Reading proficiency
- 29% ▼ -7.00%
- Median HH income
- $41,951
- Composite
- 21.68/100
- National rank
- #8275
- State rank
- #263 of 301 in IN
Livability — Fort Wayne
- Score
- 84/100
- State rank
- #6
- US rank
- #676
Category grades
Schools grade is shown separately in the Schools card above.
Census & demographics
- Census place
- Fort Wayne, IN
- County
- Allen County · 326,813 people
- City population
- 326,813
- Metro
- Fort Wayne, IN
- Population (ZIP)
- 26,425
- Household income
- $47,895
- Rent vs Own
- Severe rent burden
- 1184.0
Population outlook (Allen County) Hauer SSP2
- Today (2025)
- 394,020 people
- By 2030
- 405,128 · +2.8%
- By 2040
- 423,476 · +7.5%
- By 2050
- 435,137 · +10.4%
- By 2075
- 450,293 · +14.3%
- By 2100
- 424,101 · +7.6%
Race, ethnicity, and origin ACS 2023
- Neighborhood character
- Highly diverse neighborhood (Simpson 0.74)
- Race & ethnicity
- Black 37% Hispanic / Latino 26% White 21% Asian 12% Two or more races 11% Native American 2%
- Hispanic origin (detail)
- Mexican 18% Puerto Rican 1%
- Common ancestry
- Italian 1% Romanian 1% Lithuanian 1%
- Foreign-born
- 19% · Canada, Philippines, South Korea
- Languages at home
- 71% English-only · Spanish 19% Other Asian/Pacific 9%
Political lean MEDSL · Allen
- 2024 margin
- R (+12.5) · D 42.9% · R 55.4% · Other 1.7%
- 2008→2024 swing
- -8.1pp toward R · 2008: -4.3pp · 2024: -12.5pp
- All cycles
- 2024: R+12.5 2020: R+11.2 2016: R+19.6 2012: R+16.8 2008: R+4.3
Not yet ingested
- Civics
- —
Market trends
- HPI YoY
- ▼ -148.00%
- Current HPI
- 291.8198
- Rent YoY
- ▲ 4.93%
- Metro
- Fort Wayne, IN
- State GDP YoY
- ▲ 2.90%
- F500 in state
- 18
Industry mix (Fortune 500 HQ in IN)
| Industry | F500 HQs | Revenue |
|---|---|---|
| Industrial Machinery | 2 | $37B |
|
||
| Healthcare | 1 | $177B |
|
||
| Pharmaceuticals | 1 | $45B |
|
||
| Metals / Steel | 1 | $18B |
|
||
| Agriculture | 1 | $17B |
|
||
| Packaging | 1 | $12B |
|
||
Price history
-79.1% since first listed2 events — show timeline
- 2026-06-16 Listed $99,900 IRMLS
- 2006-06-01 Sold (Public Records) $477,760 Public Records
Property tax history
+10.3%/yrLatest (2024): $1,363 · +12.2% YoY. Source: county tax records.
Cash-flow waterfall
monthlySold comps — $/sqft
last 12 mo · ≤1 miLoading sold comps…