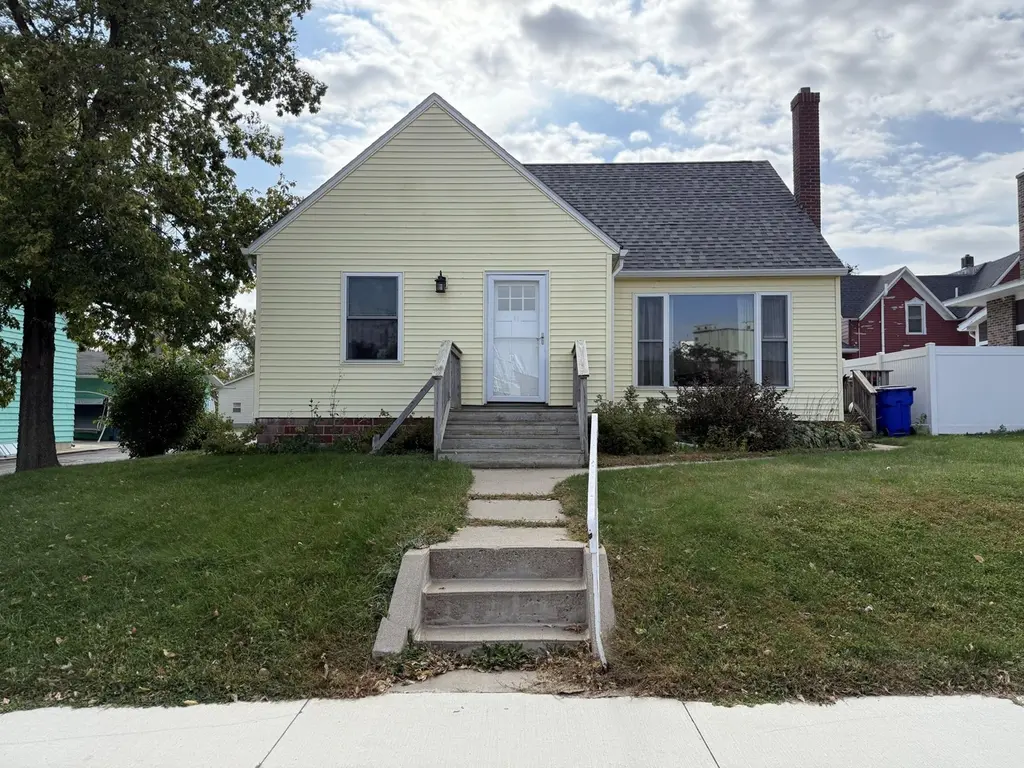
755 Chestnut St · Dawson, MN
Flood risk 1/10 · Minimal
- FEMA flood zone
- X (unshaded)
- Chance of flooding over 30 yrs
- 0.0%
- Est. flood insurance / yr
- $473 – $860
Fire risk 2/10 · Minimal
- Est. fire insurance / yr
- $888 – $1,650
Heat risk 2/10 · Minimal
- Hot days now (above 100°F)
- 7 days/yr
- Hot days in 30 yrs
- 13 days/yr
Wind risk 2/10 · Minimal
- Chance of severe wind over 30 yrs
- —
Air-quality risk 2/10 · Minimal
- Unhealthy air days now
- 1 days/yr
- Unhealthy air days in 30 yrs
- 1 days/yr
Risk factors via First Street. Map © Google.
Why this score? — see what drove the C grade
The composite is a weighted blend of 9 inputs, each scored 0–100. Each bar is that input's sub-score; the figure is the points it added to the 100-point composite (weight × sub-score).
- ARV discount +13.9/15.0
- Cash flow +13.5/30.0
- Appreciation +7.1/10.0
- 1% rule +4.4/10.0
- Schools +4.2/10.0
- DSCR +4.1/10.0
- Livability +3.9/5.0
- Rent growth +2.5/5.0
- Condition / age +2.5/5.0
$135,000
🖨 Deal sheet 📄 Offer letter ✓ Due diligence
Listing remarks MLS
Welcome to 755 Chestnut St in Dawson! This home has a great location, ample storage and great updates! The basement has so much potential, including another bedroom with the addition of an egress window.
Key facts
- 3,746 sq ft lot
- Built 1949
- Listed 257 days
Neighborhood map
What this means for you Summary
Snapshot
- This is a 3-bed/2.0-bath single-family listed at $135k.
Deal economics
- At list price, monthly cash flow is $6 ($66/yr) — positive.
- The deal already cash-flows at list — no discount required.
- To meet the 1% rule (rent ≥ 1% of price), the offer needs to be $126k (6.5% below list).
- Recommended offer: $119k (12.0% below list) — sets the bar for market timing.
Location & tenants
- Location reads 77/100 on livability (#145 in MN, #3,213 nationally) — a middle-class / working-renter tenant base. Strengths: crime A+, cost of living A+, housing A+; Watch: amenities F, commute F.
- Dawson-Boyd Public School District (rural): math 42% / reading 58% proficiency, ranked #124 of 301 in MN (top 41%) — acceptable for families but not a draw, mixed tenant base, ~2y average lease.
- Market conditions: 28 active listings in the ZIP; 9 units permitted in Lac qui Parle County in 2024 (0 in 5+ unit buildings).
Forward outlook
- In year one you build about $7k of equity ($933 loan paydown + $6k appreciation (4.2% local appreciation)).
- Lac qui Parle County population projected at -19% by 2050 — secular population decline; favor cash flow + early exit over multi-decade hold.
- At projected returns (4.2% appreciation + 3.0% rent growth), your $38k cash investment doubles in ~5 years — after that, you're playing with house money.
- By year 6, paydown + projected appreciation supports a ~$35k cash-out refi (75% LTV) — recoverable capital for the next deal without selling this one.
Negotiation context
- It's been on market 258 days — a 12% lower offer ($119k) is reasonable based on typical stale-listing flexibility.
- 7 sale attempts since 15y ago; this cycle's ask has dropped $10k (7%) from the opening price — seller is motivated, your offer sets the floor, not the list.
Risks & watch-outs
- Watch-outs: built in 1949 — expect roof / HVAC / electrical / plumbing capex.
Questions for the listing agent
- It's been on market 258 days. Have you received any prior offers? Is the seller open to a 12% concession, seller financing, or rate buy-down credit?
- Built in 1949 — when were the roof, HVAC, electrical panel, plumbing, and water heater last replaced?
- Why hasn't it sold? Are there any deal-killer items the seller is aware of (foundation, flood, title, zoning, code violations)?
- Is there a deadline driving the sale (1031 exchange, divorce, estate, relocation)? That informs how much negotiation room exists.
- What's the average days-on-market for RENTAL listings here right now (not sales)? A rising rental-DOM trend means longer vacancies and softer asking-rent achievability than the comps imply.
- What's the recent tenant-quality profile in this submarket — average credit score on applications, eviction rate, late-payment / NSF rate, and stable-employment percentage? A property-management company in the area should have these aggregated.
- How much new for-sale + rental construction is in the pipeline within 1–3 miles? Heavy new supply typically softens prices + rents 12–24 months out; constrained supply supports both.
Investment metrics
- 1% rule
- 0.94% ✗
- Cap rate
- 6.34%
- Cash-on-cash
- 0.18%
- DSCR
- 1.01
- GRM
- 8.9
CMA / ARV
- ARV (median comp)
- $157,514
- List price
- $135,000
- Delta
- -14.29%
- Verdict
- UNDERPRICED
- Comps
- 1 within 2.0 mi
Projected returns pro-forma
4.24% appreciation · 3.0% rent growth · sell at horizon
- IRR
- 11.1%
- Equity multiple
- 1.68×
- Total profit
- $25,737
- Equity at exit
- $70,347
- IRR
- 12.7%
- Equity multiple
- 3.13×
- Total profit
- $80,618
- Equity at exit
- $116,601
Cash invested: $37,800 (down + closing). Projections, not guarantees.
Landlord ↔ Tenant lean methodology
- Overall (STATE)
- 46 Balanced
- State Minnesota
- 46 Balanced · D+2
- County
- — inherits STATE
- City
- — inherits STATE
ZIP-level market 56232
- Home prices YoY
- 2.1%
- Active inventory
- 28
- Price-to-rent
- 8.9×
Monthly cashflow live
- Estimated rent
- $1,263 medium interval (Pro) →
- Mortgage (P&I)
- −$708
- Tax from tax record
- −$228 /mo · $2,734/yr
- Insurance
- −$56
- HOA
- −$0
- Vacancy / Maint / Mgmt
- −$265
- Net cashflow
- $6
Break-even live
UW: 25.0% down · 7.5% · 30yr · 1.5% tax · 5.0% vac · 8.0% maint · 8.0% mgmt
Financing live
Cash to close
- Down payment
- $33,750
- Closing costs
- $4,050
- Reserves months
- —
- Total cash needed
- —
Loan-product check · same deal, 3 products live
Conventional
25% down · 7.5% · 30yr
- Down + closing
- —
- Monthly P&I
- —
- Monthly cashflow
- —
- DSCR
- —
- Eligible?
- —
Personal DTI + credit; lowest rate.
DSCR
20% down · 8.5% · 30yr
- Down + closing
- —
- Monthly P&I
- —
- Monthly cashflow
- —
- DSCR
- —
- Eligible?
- —
No personal income docs; deal must DSCR.
Hard money
10% down · 12.0% · 12mo
- Down + closing
- —
- Monthly P&I
- —
- Monthly cashflow
- —
- DSCR
- —
- Eligible?
- —
Short-term bridge; refi at stabilization.
Listing history 38 events
-
2026-06-18days on market $135,000 Active 258 DOM
-
2026-06-17days on market $135,000 Active 257 DOM
-
2026-06-16days on market $135,000 Active 256 DOM
-
2026-06-15days on market $135,000 Active 255 DOM
-
2026-06-13days on market $135,000 Active 253 DOM
-
2026-06-12days on market $135,000 Active 252 DOM
-
2026-06-09days on market $135,000 Active 249 DOM
-
2026-06-08days on market $135,000 Active 248 DOM
-
2026-06-07days on market $135,000 Active 247 DOM
-
2026-06-05days on market $135,000 Active 245 DOM
-
2026-06-04days on market $135,000 Active 243 DOM
-
2026-06-02days on market $135,000 Active 242 DOM
-
2026-06-01days on market $135,000 Active 241 DOM
-
2026-05-31days on market $135,000 Active 240 DOM
-
2026-05-31days on market $135,000 Active 239 DOM
-
2026-04-22price $135,000 203-char remark
Show marketing remark (203 chars)
Welcome to 755 Chestnut St in Dawson! This home has a great location, ample storage and great updates! The basement has so much potential, including another bedroom with the addition of an egress window.
-
2026-02-19price $139,500 203-char remark
Show marketing remark (203 chars)
Welcome to 755 Chestnut St in Dawson! This home has a great location, ample storage and great updates! The basement has so much potential, including another bedroom with the addition of an egress window.
-
2025-10-03$144,900 Active 203-char remark
Show marketing remark (203 chars)
Welcome to 755 Chestnut St in Dawson! This home has a great location, ample storage and great updates! The basement has so much potential, including another bedroom with the addition of an egress window.
-
2025-10-02status Active
-
2025-10-02historical
-
2025-10-02historical
-
2025-07-17price $144,900
-
2025-06-04price $149,900
-
2025-04-01$155,000 Active
-
2022-12-29soldstatus $130,512
-
2022-12-22soldstatus $130,512 Sold
-
2022-11-14status Pending
-
2022-09-10price $138,900
-
2022-08-17price $149,900
-
2022-08-05$156,999 Active
-
2021-08-17soldstatus $225,000
-
2019-02-02historical
-
2019-02-02historical
-
2017-07-03soldstatus $79,000
-
2017-06-30soldstatus $79,000
-
2017-04-11$76,900
-
2011-05-17$56,500
-
2011-05-17$56,500
ⓘ Source: listings_history table (triggers on properties + properties_extension) + one-shot
backfill from property_details.listing_events for pre-trigger history.
Tax reassessment forecast MN · Partial reset (capped growth)
- Current annual tax
- $2,734 · $228/mo
- Projected year-2 tax
- $2,734 · $228/mo
- Expected delta
- $0/yr ($0/mo · 0.0%)
ⓘ Screening estimate from a state-policy table — verify with the county assessor before closing.
Climate risk First Street
- Flood 1/10 Low FEMA zone X (unshaded) · 0% chance over 30 yrs
- Wildfire 2/10 Low
- Heat 2/10 Low 7 d/yr ≥100°F today · 13 d/yr by 30 yrs out
- Wind 2/10 Low
- Air quality 2/10 Low 1 unhealthy d/yr today · 1 by 30 yrs out
Nearby sold comps map
Loading sold comps map…
Walkable amenities ~0.75 mi
Loading nearby amenities…
Taxation est. · year 1
- Rental income
- $15,153
- − Mortgage interest
- −$7,562
- − Property taxes
- −$2,734
- − Insurance
- −$675
- − Repairs & maintenance
- −$1,212
- − Management
- −$1,212
- − Depreciation
- −$3,927
- Taxable loss
- −$2,170
- Est. tax savings @ 24.0%
- +$521
- After-tax cash flow
- $587/yr
For passive investors: Depreciation is non-cash, so a rental often shows a tax loss while cash-flowing — sheltering income. Rental losses are passive: they offset passive income freely, and up to $25,000/yr can offset ordinary (W-2) income if you actively participate and your MAGI is under $100k (phasing out to $0 by $150k); unused losses carry forward. On sale, claimed depreciation is recaptured at up to 25%, and gains may owe capital-gains tax (a 1031 exchange can defer both). Figures are a year-1 estimate at your 24.0% rate — not tax advice; consult a CPA.
Schools (NCES district)
- District
- Dawson-Boyd Public School District
- NCES district ID
- 2710090
- Math proficiency
- 42% ▼ -17.00%
- Reading proficiency
- 58% ▼ -7.00%
- Median HH income
- $47,615
- Composite
- 42.5/100
- National rank
- #3204
- State rank
- #124 of 301 in MN
Livability — Dawson
- Score
- 77/100
- State rank
- #145
- US rank
- #3213
Category grades
Schools grade is shown separately in the Schools card above.
Census & demographics
- Census place
- Dawson, MN
- Population (ZIP)
- 2,365
Population outlook (Lac qui Parle County) Hauer SSP2
- Today (2025)
- 6,291 people
- By 2030
- 6,021 · -4.3%
- By 2040
- 5,517 · -12.3%
- By 2050
- 5,094 · -19.0%
- By 2075
- 4,640 · -26.2%
- By 2100
- 4,173 · -33.7%
Race, ethnicity, and origin ACS 2023
- Neighborhood character
- Predominantly White (89%)
- Race & ethnicity
- White 89% Two or more races 5% Hispanic / Latino 5%
- Common ancestry
- Portuguese 41% English 3% Scottish 2%
- Foreign-born
- 4% · Canada
- Languages at home
- 96% English-only · Spanish 3%
Political lean MEDSL · Lac qui Parle
- 2024 margin
- Solid R (+32.2) · D 32.9% · R 65.2% · Other 1.9%
- 2008→2024 swing
- -38.2pp toward R · 2008: 5.9pp · 2024: -32.2pp
- All cycles
- 2024: R+32.2 2020: R+26.8 2016: R+25.9 2012: D+0.9 2008: D+5.9
Not yet ingested
- Civics
- —
Market trends
- HPI YoY
- ▲ 4.24%
- Current HPI
- 210.1619
- Rent YoY
- —
- Metro
- —
- State GDP YoY
- ▲ 2.41%
- F500 in state
- 34
Industry mix (Fortune 500 HQ in MN)
| Industry | F500 HQs | Revenue |
|---|---|---|
| Healthcare | 2 | $407B |
|
||
| Retail | 2 | $150B |
|
||
| Consumer Goods | 2 | $32B |
|
||
| Industrial Machinery | 2 | $6B |
|
||
| Agriculture | 1 | $40B |
|
||
| Healthcare / Medical Devices | 1 | $32B |
|
||
Price history
+138.9% since first listed23 events — show timeline
- 2026-04-22 Price Changed $135,000 NORTHSTARMLS as Distributed by MLS Grid
- 2026-02-19 Price Changed $139,500 NORTHSTARMLS as Distributed by MLS Grid
- 2025-10-03 Listed $144,900 NORTHSTARMLS as Distributed by MLS Grid
- 2025-10-02 Relisted — NORTHSTARMLS as Distributed by MLS Grid
- 2025-10-02 Listing Removed — NORTHSTARMLS as Distributed by MLS Grid
- 2025-10-02 Listing Removed — NORTHSTARMLS as Distributed by MLS Grid
- 2025-07-17 Price Changed $144,900 NORTHSTARMLS as Distributed by MLS Grid
- 2025-06-04 Price Changed $149,900 NORTHSTARMLS as Distributed by MLS Grid
- 2025-04-01 Listed $155,000 NORTHSTARMLS as Distributed by MLS Grid
- 2022-12-29 Sold (Public Records) $130,512 Public Records
- 2022-12-22 Sold (MLS) $130,512 NORTHSTARMLS as Distributed by MLS Grid
- 2022-11-14 Pending — NORTHSTARMLS as Distributed by MLS Grid
- 2022-09-10 Price Changed $138,900 NORTHSTARMLS as Distributed by MLS Grid
- 2022-08-17 Price Changed $149,900 NORTHSTARMLS as Distributed by MLS Grid
- 2022-08-05 Listed $156,999 NORTHSTARMLS as Distributed by MLS Grid
- 2021-08-17 Sold (Public Records) $225,000 Public Records
- 2019-02-02 Listing Removed — NORTHSTARMLS as Distributed by MLS Grid
- 2019-02-02 Listing Removed — NORTHSTARMLS as Distributed by MLS Grid
- 2017-07-03 Sold (Public Records) $79,000 Public Records
- 2017-06-30 Sold (MLS) $79,000 NORTHSTARMLS as Distributed by MLS Grid
- 2017-04-11 Listed $76,900 NORTHSTARMLS as Distributed by MLS Grid
- 2011-05-17 Listed $56,500 NORTHSTARMLS as Distributed by MLS Grid
- 2011-05-17 Listed $56,500 NORTHSTARMLS as Distributed by MLS Grid
Property tax history
+11.1%/yrLatest (2026): $2,734 · +21.7% YoY. Source: county tax records.
Cash-flow waterfall
monthlySold comps — $/sqft
last 12 mo · ≤1 miLoading sold comps…