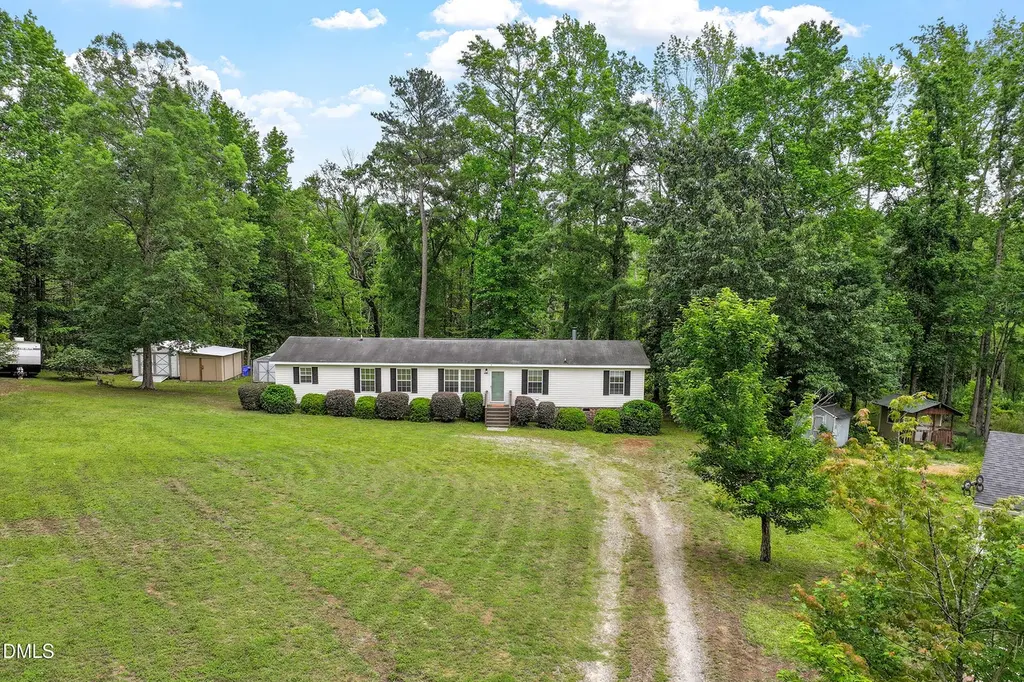
4649 Low Ground Ct · Garner, NC
Flood risk 1/10 · Minimal
- FEMA flood zone
- X (unshaded)
- Chance of flooding over 30 yrs
- 0.0%
- Est. flood insurance / yr
- $507 – $1,088
Fire risk 4/10 · Minor
- Est. fire insurance / yr
- $906 – $1,684
Heat risk 6/10 · Moderate
- Hot days now (above 105°F)
- 7 days/yr
- Hot days in 30 yrs
- 17 days/yr
Wind risk 6/10 · Moderate
- Chance of severe wind over 30 yrs
- 58.0%
Air-quality risk 2/10 · Minimal
- Unhealthy air days now
- 1 days/yr
- Unhealthy air days in 30 yrs
- 1 days/yr
Risk factors via First Street. Map © Google.
Why this score? — see what drove the D+ grade
The composite is a weighted blend of 9 inputs, each scored 0–100. Each bar is that input's sub-score; the figure is the points it added to the 100-point composite (weight × sub-score).
- Cash flow +17.5/30.0
- ARV discount +7.5/15.0
- DSCR +5.5/10.0
- Schools +4.9/10.0
- 1% rule +3.8/10.0
- Livability +3.8/5.0
- Rent growth +2.8/5.0
- Condition / age +2.5/5.0
- Appreciation +0.0/10.0
$267,500
🖨 Deal sheet 📄 Offer letter ✓ Due diligence
Listing remarks MLS
This home is in excellent condition! Four Bedrooms with seperated Den and Media Room. Price per square foot is amazing. Comparing to other homes in this price range, age and square footage will reveal this is a bargain. On a FHA permanent foundation, qualified buyers can own with as little as 3.5% Down. You will definately want to show this property,
Key facts
- Private lot
- Garden area
- Expansive yard
Tags
Property features AI
Finance
- Other: Zoning: R-30
- HOA & community: No association; Not a senior community
Exterior
- Utilities: Electricity connected; Water connected (community water / shared well); Septic connected (septic tank)
- Home design: Manufactured double-wide home; One-story with entry on level 1; Facing direction not specified
- Construction: Brick veneer and vinyl siding exterior; Block, brick/mortar, permanent foundation; Built as a manufactured house
- Exterior features: Asphalt roof; Lot approximately 1.08 acres; Publicly maintained asphalt road access
Interior
- Kitchen: Dishwasher; Free-standing range; Refrigerator
- Bedrooms: 4 bedrooms (all on the main level)
- Flooring: Carpet; Luxury vinyl; Tile
- Bathrooms: 2 full bathrooms
- Heating & cooling: Central heating and cooling; Heat pump
- Interior features: Dishwasher; Free-standing range; Refrigerator
Neighborhood map
What this means for you Summary
Snapshot
- This is a 4-bed/2.0-bath manufactured listed at $268k.
Deal economics
- At list price, monthly cash flow is $207 ($2k/yr) — positive.
- The deal already cash-flows at list — no discount required.
- To meet the 1% rule (rent ≥ 1% of price), the offer needs to be $235k (12.0% below list).
- Recommended offer: $235k (12.0% below list) — sets the bar for 1% rule.
- Cap rate 7.2% vs local median 3.3% in Garner — top-decile yield for the area; either an underpriced asset or a hidden risk that comps aren't pricing in. Stress-test before assuming the spread holds.
Location & tenants
- Location reads 76/100 on livability (#35 in NC, #3,421 nationally) — a middle-class / working-renter tenant base. Strengths: housing A+, commute A-, cost of living A-; Watch: amenities D, crime F.
- Wake County Schools (suburban): math 52% / reading 60% proficiency, ranked #35 of 178 in NC (top 20%) — acceptable for families but not a draw, mixed tenant base, ~2y average lease.
- Zoned schools: Bryan Road Elementary (math 52% / reading 42%, grade D-, #497 of 1,410 statewide, top 38%, 649 students, 44% FRL); East Garner Middle (math 23% / reading 33%, grade F, #360 of 475 statewide, top 77%, 1,186 students, 73% FRL); South Garner High (math 45% / reading 50%, grade D, #331 of 535 statewide, top 62%, 1,824 students, 66% FRL) — zoned schools average 61% FRL vs 30% district-wide (31 pts higher); higher-poverty schools than district average — tighter screening recommended.
- Zoned-school proficiency averages 41% at this address vs 56% district-wide (-15 pts) — the specific schools serving this property underperform the Wake County Schools average; the district grade overstates school quality for this exact location.
- Market conditions: Rents rising (+1.1%/yr); 645 active listings in the ZIP; 3 comparable units currently listed for rent nearby; rentals leasing fast (median 4d on market — plan ~1-2 weeks tenant-placement turnaround); solid renter incomes; 15,249 units permitted in Wake County in 2024 (5,568 in 5+ unit buildings).
- This rent runs 33% of the median local income ($86k/yr) — at the standard rent-burdened threshold; future hikes will face affordability resistance.
Forward outlook
- Local home prices are declining (-3.0%/yr); year-one equity from $2k of loan paydown is wiped out by about $8k of value loss. Plan a longer hold.
- Wake County population projected at +51% by 2050 — long-run rental-demand tailwind backs the buy-and-hold thesis.
Negotiation context
- Only 13 days on market — expect competitive offers; lowballing is unlikely to land.
- 5 sale attempts since 17y ago with the ask held roughly flat each time — persistent listings suggest the price (not the market) is what's stuck; bring a comps-based counter.
- Current owner paid $120k; list at $268k implies a 123% gain — meaningful room to come down on a strong offer.
Risks & watch-outs
- Climate carrying-cost: major wind risk, 58% chance of damaging wind over 30y; extreme-heat days projected 7→17/yr by 2055 (HVAC capex compounding) — expect insurance premiums to compound above CPI over the hold.
Questions for the listing agent
- Is there a deadline driving the sale (1031 exchange, divorce, estate, relocation)? That informs how much negotiation room exists.
- Schools are D-rated, which usually means shorter tenancies and higher turnover. Who's the typical renter profile here, and what's been the actual vacancy rate?
- Crime grade is F in this area — have there been break-ins, vandalism, or insurance claims at this property in the last 3 years? What carrier currently insures it and at what premium?
- The area grade is low — what's the realistic commute time and amenity access for the typical tenant pool here? Any planned neighborhood developments (good or bad) we should know about?
- What's the average days-on-market for RENTAL listings here right now (not sales)? A rising rental-DOM trend means longer vacancies and softer asking-rent achievability than the comps imply.
- What's the recent tenant-quality profile in this submarket — average credit score on applications, eviction rate, late-payment / NSF rate, and stable-employment percentage? A property-management company in the area should have these aggregated.
- How much new for-sale + rental construction is in the pipeline within 1–3 miles? Heavy new supply typically softens prices + rents 12–24 months out; constrained supply supports both.
Investment metrics
- 1% rule
- 0.88% ✗
- Cap rate
- 7.22%
- Cash-on-cash
- 3.32%
- DSCR
- 1.15
- GRM
- 9.5
CMA / ARV
No comps found within radius.
Projected returns pro-forma
-3.0% appreciation · 1.15% rent growth · sell at horizon
- IRR
- -13.0%
- Equity multiple
- 0.54×
- Total profit
- $-34,550
- Equity at exit
- $39,885
- IRR
- -6.9%
- Equity multiple
- 0.59×
- Total profit
- $-30,468
- Equity at exit
- $23,129
Cash invested: $74,900 (down + closing). Projections, not guarantees.
Landlord ↔ Tenant lean methodology
- Overall (STATE)
- 85 Strongly Landlord-Friendly
- State North Carolina
- 85 Strongly Landlord-Friendly · R+3
- County
- — inherits STATE
- City
- — inherits STATE
ZIP-level market 27529
- Rents YoY
- 1.1%
- Active inventory
- 645
- Price-to-rent
- 9.5×
Monthly cashflow live
- Estimated rent
- $2,355 medium interval (Pro) →
- Mortgage (P&I)
- −$1,403
- Tax from tax record
- −$139 /mo · $1,668/yr
- Insurance
- −$111
- HOA
- −$0
- Vacancy / Maint / Mgmt
- −$495
- Net cashflow
- $207
Break-even live
UW: 25.0% down · 7.5% · 30yr · 1.5% tax · 5.0% vac · 8.0% maint · 8.0% mgmt
Financing live
Cash to close
- Down payment
- $66,875
- Closing costs
- $8,025
- Reserves months
- —
- Total cash needed
- —
Loan-product check · same deal, 3 products live
Conventional
25% down · 7.5% · 30yr
- Down + closing
- —
- Monthly P&I
- —
- Monthly cashflow
- —
- DSCR
- —
- Eligible?
- —
Personal DTI + credit; lowest rate.
DSCR
20% down · 8.5% · 30yr
- Down + closing
- —
- Monthly P&I
- —
- Monthly cashflow
- —
- DSCR
- —
- Eligible?
- —
No personal income docs; deal must DSCR.
Hard money
10% down · 12.0% · 12mo
- Down + closing
- —
- Monthly P&I
- —
- Monthly cashflow
- —
- DSCR
- —
- Eligible?
- —
Short-term bridge; refi at stabilization.
Rent comps 3 comps
| Address | Beds | Baths | Sqft | Rent | $/sqft | DOM | Units | Dist |
|---|---|---|---|---|---|---|---|---|
| 202 Galloway Dr Garner, NC | 3.0 | 2.5 | 2385 | $2,300 | $0.96 | 19d | 1 | 1.02mi |
| 8908 White Oak Rd Garner, NC | 3.0 | 2.0 | 1948 | $2,200 | $1.13 | 1d | 1 | 1.17mi |
| 149 Blue Melody Ave Garner, NC | 3.0 | 2.5 | 1500 | $2,100 | $1.40 | 3d | 1 | 1.49mi |
Listing history 21 events
-
2026-06-13statusdays on market $267,500 Pending 13 DOM
-
2026-06-09days on market $267,500 Active 12 DOM
-
2026-06-08days on market $267,500 Active 11 DOM
-
2026-06-07days on market $267,500 Active 10 DOM
-
2026-06-05days on market $267,500 Active 7 DOM
-
2026-06-03days on market $267,500 Active 6 DOM
-
2026-06-02days on market $267,500 Active 5 DOM
-
2026-06-01days on market $267,500 Active 4 DOM
-
2026-05-31days on market $267,500 Active 3 DOM
-
2026-05-28$267,500 Active
-
2010-04-21soldstatus $119,870 352-char remark
Show marketing remark (352 chars)
This home is in excellent condition! Four Bedrooms with seperated Den and Media Room. Price per square foot is amazing. Comparing to other homes in this price range, age and square footage will reveal this is a bargain. On a FHA permanent foundation, qualified buyers can own with as little as 3.5% Down. You will definately want to show this property,
-
2010-04-10historical 352-char remark
Show marketing remark (352 chars)
This home is in excellent condition! Four Bedrooms with seperated Den and Media Room. Price per square foot is amazing. Comparing to other homes in this price range, age and square footage will reveal this is a bargain. On a FHA permanent foundation, qualified buyers can own with as little as 3.5% Down. You will definately want to show this property,
-
2009-12-21$119,900 352-char remark
Show marketing remark (352 chars)
This home is in excellent condition! Four Bedrooms with seperated Den and Media Room. Price per square foot is amazing. Comparing to other homes in this price range, age and square footage will reveal this is a bargain. On a FHA permanent foundation, qualified buyers can own with as little as 3.5% Down. You will definately want to show this property,
-
2009-09-15soldstatus $58,000 248-char remark
Show marketing remark (248 chars)
HUD Property Condition IN, Case #381-804057 Property for sale AS-IS, without warranties, repairs. Not responsible for latent/structural defects/code violations, or LBP/Radon/Mold notice. Electronic bidding via internet only. Acreage is approximate.
-
2009-08-25historical 248-char remark
Show marketing remark (248 chars)
HUD Property Condition IN, Case #381-804057 Property for sale AS-IS, without warranties, repairs. Not responsible for latent/structural defects/code violations, or LBP/Radon/Mold notice. Electronic bidding via internet only. Acreage is approximate.
-
2009-07-25historical
-
2009-07-24$84,000 248-char remark
Show marketing remark (248 chars)
HUD Property Condition IN, Case #381-804057 Property for sale AS-IS, without warranties, repairs. Not responsible for latent/structural defects/code violations, or LBP/Radon/Mold notice. Electronic bidding via internet only. Acreage is approximate.
-
2009-05-15$84,000
-
2005-06-21soldstatus $260,000
ⓘ Source: listings_history table (triggers on properties + properties_extension) + one-shot
backfill from property_details.listing_events for pre-trigger history.
Tax reassessment forecast NC · Resets to sale price
- Current annual tax
- $1,668 · $139/mo
- Projected year-2 tax
- $2,194 · $183/mo
- Expected delta
- +$525/yr (+$44/mo · 31.5%)
ⓘ Screening estimate from a state-policy table — verify with the county assessor before closing.
Climate risk First Street
- Flood 1/10 Low FEMA zone X (unshaded) · 0% chance over 30 yrs
- Wildfire 4/10 Moderate
- Heat 6/10 Major 7 d/yr ≥105°F today · 17 d/yr by 30 yrs out
- Wind 6/10 Major 58% chance of damaging wind over 30 yrs
- Air quality 2/10 Low 1 unhealthy d/yr today · 1 by 30 yrs out
Nearby sold comps map
Loading sold comps map…
Walkable amenities ~0.75 mi
Loading nearby amenities…
Taxation est. · year 1
- Rental income
- $28,258
- − Mortgage interest
- −$14,984
- − Property taxes
- −$1,668
- − Insurance
- −$1,338
- − Repairs & maintenance
- −$2,261
- − Management
- −$2,261
- − Depreciation
- −$7,782
- Taxable loss
- −$2,035
- Est. tax savings @ 24.0%
- +$488
- After-tax cash flow
- $2,973/yr
For passive investors: Depreciation is non-cash, so a rental often shows a tax loss while cash-flowing — sheltering income. Rental losses are passive: they offset passive income freely, and up to $25,000/yr can offset ordinary (W-2) income if you actively participate and your MAGI is under $100k (phasing out to $0 by $150k); unused losses carry forward. On sale, claimed depreciation is recaptured at up to 25%, and gains may owe capital-gains tax (a 1031 exchange can defer both). Figures are a year-1 estimate at your 24.0% rate — not tax advice; consult a CPA.
Schools (NCES district)
- District
- Wake County Schools
- NCES district ID
- 3704720
- Math proficiency
- 52% ▲ 2.00%
- Reading proficiency
- 60% ▲ 4.00%
- Median HH income
- $67,509
- Composite
- 49.41/100
- National rank
- #2010
- State rank
- #35 of 178 in NC
Livability — Garner
- Score
- 76/100
- State rank
- #35
- US rank
- #3421
Category grades
Schools grade is shown separately in the Schools card above.
Census & demographics
- County
- Wake County · 1,216,256 people
- City population
- 55,242
- Metro
- Raleigh-Cary, NC
- Population (ZIP)
- 55,242
- Household income
- $85,716
- Rent vs Own
- Severe rent burden
- 1455.0
Population outlook (Wake County) Hauer SSP2
- Today (2025)
- 1,293,152 people
- By 2030
- 1,428,223 · +10.4%
- By 2040
- 1,698,188 · +31.3%
- By 2050
- 1,955,807 · +51.2%
- By 2075
- 2,520,273 · +94.9%
- By 2100
- 2,893,335 · +123.7%
Race, ethnicity, and origin ACS 2023
- Neighborhood character
- Diverse neighborhood (Simpson 0.61)
- Race & ethnicity
- White 56% Black 25% Hispanic / Latino 13% Two or more races 9% Asian 1%
- Hispanic origin (detail)
- Mexican 8% Puerto Rican 2%
- Common ancestry
- Lithuanian 3% Slovak 3% Italian 2%
- Foreign-born
- 8% · Canada
- Languages at home
- 87% English-only · Spanish 11% Other Indo-European 1%
Political lean MEDSL · Wake
- 2024 margin
- Strong D (+25.5) · D 61.9% · R 36.4% · Other 1.7%
- 2008→2024 swing
- +11.1pp toward D · 2008: 14.4pp · 2024: 25.5pp
- All cycles
- 2024: D+25.5 2020: D+26.4 2016: D+20.5 2012: D+10.2 2008: D+14.4
Not yet ingested
- Civics
- —
Market trends
- HPI YoY
- ▼ -241.30%
- Current HPI
- 238.8492
- Rent YoY
- ▲ 1.15%
- Metro
- Raleigh-Cary, NC
- State GDP YoY
- ▲ 3.28%
- F500 in state
- 26
Industry mix (Fortune 500 HQ in NC)
| Industry | F500 HQs | Revenue |
|---|---|---|
| Financial Services | 2 | $213B |
|
||
| Retail | 2 | $95B |
|
||
| Industrial Conglomerate | 1 | $38B |
|
||
| Metals / Steel | 1 | $35B |
|
||
| Utilities | 1 | $30B |
|
||
| Industrial Machinery | 1 | $19B |
|
||
Price history
+2.9% since first listed12 events — show timeline
- 2026-05-28 Listed $267,500 TMLS
- 2010-04-21 Sold (MLS) $119,870 AMLSNC
- 2010-04-21 Sold (MLS) $119,870 TMLS
- 2010-04-10 Listing Removed — TMLS
- 2009-12-21 Listed $119,900 AMLSNC
- 2009-12-21 Listed $119,900 TMLS
- 2009-09-15 Sold (MLS) $58,000 TMLS
- 2009-08-25 Listing Removed — TMLS
- 2009-07-25 Listing Removed — TMLS
- 2009-07-24 Listed $84,000 TMLS
- 2009-05-15 Listed $84,000 TMLS
- 2005-06-21 Sold (Public Records) $260,000 Public Records
Property tax history
+3.8%/yrLatest (2025): $1,668 · +3.0% YoY. Source: county tax records.
Cash-flow waterfall
monthlySold comps — $/sqft
last 12 mo · ≤1 miLoading sold comps…