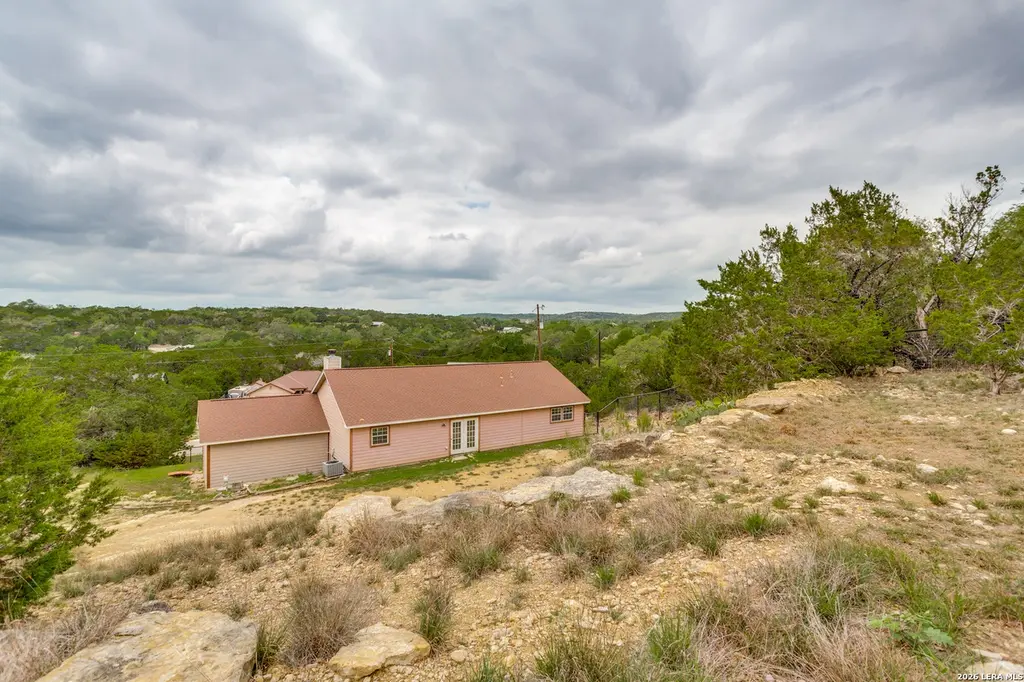
2630 Rocky Rdg · Canyon Lake, TX
Flood risk 1/10 · Minimal
- FEMA flood zone
- X (unshaded)
- Chance of flooding over 30 yrs
- 0.0%
- Est. flood insurance / yr
- $507 – $1,088
Fire risk 4/10 · Minor
- Est. fire insurance / yr
- $1,222 – $2,270
Heat risk 7/10 · Major
- Hot days now (above 106°F)
- 7 days/yr
- Hot days in 30 yrs
- 22 days/yr
Wind risk 6/10 · Moderate
- Chance of severe wind over 30 yrs
- 67.0%
Air-quality risk 2/10 · Minimal
- Unhealthy air days now
- 0 days/yr
- Unhealthy air days in 30 yrs
- 1 days/yr
Risk factors via First Street. Map © Google.
Why this score? — see what drove the D grade
The composite is a weighted blend of 9 inputs, each scored 0–100. Each bar is that input's sub-score; the figure is the points it added to the 100-point composite (weight × sub-score).
- ARV discount +15.0/15.0
- Cash flow +8.4/30.0
- Schools +5.2/10.0
- Livability +3.4/5.0
- 1% rule +2.6/10.0
- Condition / age +2.5/5.0
- DSCR +2.3/10.0
- Rent growth +2.2/5.0
- Appreciation +0.0/10.0
$300,000
🖨 Deal sheet (PDF) 📄 Offer letter ✓ Due diligence
Listing remarks
Discover your own Hill Country escape in the highly desirable Rocky Creek Ranch community. Set on a gated, fully fenced half-acre lot, this beautifully updated 3-bedroom, 2-bath home offers the perfect blend of privacy, comfort, and functionality-with plenty of space to park your boat or RV. Step inside to an inviting open-concept layout featuring a stunning rock fireplace, durable hard-surface flooring throughout (no carpet), and stylish updates at every turn. The kitchen shines with a remodeled pantry, new dishwasher, and updated lighting and fixtures that add a fresh, modern touch. Start your mornings with coffee on the covered front porch and unwind in the evenings with breathtaking Hil
Key facts
- Remodeled pantry
- Rock fireplace
- New dishwasher
Tags
Property features AI
Finance
- HOA & community: Mandatory HOA; HOA fee $97 annually; Association transfer fee $150; Subdivision: ROCKY CREEK RANCH
Exterior
- Parking: 2-car garage
- Utilities: Water service by TX Water Co; Aerobic septic system; Private garbage service; Electricity by PERDENALES
- Home design: Pre-owned home; Approximately 20 years old
- Construction: Slab foundation; Composition roof
- Exterior features: Siding exterior; Lot in ROCKY CREEK RANCH subdivision
Interior
- Kitchen: Eat-in kitchen with island; Walk-in pantry
- Bedrooms: Master bedroom with full bath (12 x 12); Bedroom 2 (13 x 12); Bedroom 3 (13 x 12)
- Flooring: Ceramic tile floors
- Bathrooms: 2 full bathrooms; Master bath with tub/shower combination (9 x 5)
- Heating & cooling: Central heating (electric); Central air conditioning
- Interior features: Ceiling fans; Living/Dining room combination; Eat-in kitchen; Kitchen island; Walk-in pantry; Utility room inside; 1 living area
- Laundry & utility: Washer connection; Dryer connection; Utility room inside
Neighborhood map
What this means for you Summary
Snapshot
- This is a 3-bed/2.0-bath single-family listed at $300k.
Deal economics
- At list price, monthly cash flow is $-270 ($-3k/yr) — negative.
- To cash-flow at today's rent, offer at most $252k (15.9% below list).
- To meet the 1% rule (rent ≥ 1% of price), the offer needs to be $228k (23.9% below list).
- Recommended offer: $228k (23.9% below list) — sets the bar for 1% rule.
- Cap rate 5.2% vs local median 2.2% in Canyon Lake — top-decile yield for the area; either an underpriced asset or a hidden risk that comps aren't pricing in. Stress-test before assuming the spread holds.
Location & tenants
- Location reads 67/100 on livability (#534 in TX) — a middle-class / working-renter tenant base. Strengths: employment A+, housing A+, cost of living A; Watch: amenities F, commute F, health & safety F.
- Comal ISD (rural): math 57% / reading 59% proficiency, ranked #58 of 826 in TX (top 7%) — acceptable for families but not a draw, mixed tenant base, ~2y average lease.
- Zoned schools: Rebecca Creek El (math 55% / reading 52%, grade C, #686 of 4,322 statewide, top 16%, 605 students, 51% FRL); Mt Valley Middle (math 55% / reading 51%, grade C+, #281 of 1,662 statewide, top 18%, 808 students, 49% FRL); Canyon Lake H S (math 46% / reading 56%, grade D+, #482 of 1,632 statewide, top 30%, 1,038 students, 37% FRL) — zoned schools average 46% FRL vs 31% district-wide (15 pts higher); higher-poverty schools than district average — tighter screening recommended.
- Market conditions: Rents soft (-1.2%/yr); 1029 active listings in the ZIP; 2 comparable units currently listed for rent nearby; solid renter incomes; 3,420 units permitted in Comal County in 2024 (1,164 in 5+ unit buildings).
- This rent runs 33% of the median local income ($84k/yr) — at the standard rent-burdened threshold; future hikes will face affordability resistance.
Forward outlook
- Local home prices are declining (-3.0%/yr); year-one equity from $2k of loan paydown is wiped out by about $9k of value loss. Plan a longer hold.
- Comal County population projected at +70% by 2050 — long-run rental-demand tailwind backs the buy-and-hold thesis.
Negotiation context
- It's been on market 54 days — a 3% lower offer ($291k) is reasonable based on typical stale-listing flexibility.
- 13 sale attempts since 19y ago with the ask held roughly flat each time — persistent listings suggest the price (not the market) is what's stuck; bring a comps-based counter.
Risks & watch-outs
- Climate carrying-cost: major wind risk, 67% chance of damaging wind over 30y; extreme-heat days projected 7→22/yr by 2055 (HVAC capex compounding) — expect insurance premiums to compound above CPI over the hold.
Questions for the listing agent
- What do current leases actually rent for vs. the listed asking? Can we see a recent rent roll and the last 12 months of T-12 income?
- It's been on market 54 days. Have you received any prior offers? Is the seller open to a 24% concession, seller financing, or rate buy-down credit?
- What does the HOA fee cover, when was the last increase, and are there any pending special assessments or reserve-fund shortfalls?
- Is there a deadline driving the sale (1031 exchange, divorce, estate, relocation)? That informs how much negotiation room exists.
- The area grade is low — what's the realistic commute time and amenity access for the typical tenant pool here? Any planned neighborhood developments (good or bad) we should know about?
- What's the average days-on-market for RENTAL listings here right now (not sales)? A rising rental-DOM trend means longer vacancies and softer asking-rent achievability than the comps imply.
- What's the recent tenant-quality profile in this submarket — average credit score on applications, eviction rate, late-payment / NSF rate, and stable-employment percentage? A property-management company in the area should have these aggregated.
- How much new for-sale + rental construction is in the pipeline within 1–3 miles? Heavy new supply typically softens prices + rents 12–24 months out; constrained supply supports both.
Investment metrics
- 1% rule
- 0.76% ✗
- Cap rate
- 5.21%
- Cash-on-cash
- -3.85%
- DSCR
- 0.83
- GRM
- 10.9
CMA / ARV
- ARV (median comp)
- $432,495
- List price
- $300,000
- Delta
- -30.64%
- Verdict
- UNDERPRICED
- Comps
- 20 within 1.0 mi
Show comp detail 12 sales within ~0.75 mi
| Address | Dist | Beds/Ba | Sqft | Sold | Price | $/sf | Match |
|---|---|---|---|---|---|---|---|
| 2825 Rocky Rdg | 0.18mi | 3/2.0 | 1,690 (+8%) | 3mo | $420,000 | $249 | 75 |
| 1598 Desiree St | 0.20mi | 3/2.0 | 1,655 (+6%) | 11mo | $439,900 | $266 | 71 |
| 220 Cody | 0.33mi | 3/2.0 | 1,410 (-10%) | 1mo | $349,900 | $248 | 68 |
| 909 Marlys Ave | 0.23mi | 3/2.0 | 1,718 (+10%) | 10mo | $399,500 | $233 | 64 |
| 1084 Lasso Loop | 0.38mi | 3/2.0 | 1,442 (-8%) | 10mo | $392,000 | $272 | 62 |
| 1192 Desiree | 0.40mi | 3/2.0 | 1,352 (-13%) | 2mo | $350,000 | $259 | 57 |
| 131 Flint Cir | 0.73mi | 3/2.0 | 1,622 (+4%) | 3mo | $364,500 | $225 | 56 |
| 1204 Lasso Loop | 0.48mi | 4/2.0 (+1) | 1,669 (+7%) | 6mo | $435,000 | $261 | 56 |
| 1229 Marlys | 0.37mi | 3/2.0 | 1,357 (-13%) | 10mo | $356,000 | $262 | 52 |
| 1246 Desiree St | 0.36mi | 3/2.0 | 1,365 (-12%) | 13mo | $359,900 | $264 | 52 |
| 150 Kaleigh Way | 0.34mi | 4/2.0 (+1) | 1,749 (+12%) | 10mo | $445,000 | $254 | 51 |
| 1468 Lasso Loop | 0.69mi | 3/2.0 | 1,487 (-5%) | 14mo | $425,000 | $286 | 48 |
Match score weights: distance 35% · size 25% · config 20% · recency 20%. Top-matched comps best support the ARV.
Projected returns pro-forma
-3.0% appreciation · 0.0% rent growth · sell at horizon
- IRR
- -26.2%
- Equity multiple
- 0.14×
- Total profit
- $-72,452
- Equity at exit
- $44,731
- IRR
- -37.2%
- Equity multiple
- -0.32×
- Total profit
- $-110,937
- Equity at exit
- $25,939
Cash invested: $84,000 (down + closing). Projections, not guarantees.
Landlord ↔ Tenant lean methodology
- Overall (STATE)
- 87 Strongly Landlord-Friendly
- State Texas
- 87 Strongly Landlord-Friendly · R+5
- County
- — inherits STATE
- City
- — inherits STATE
ZIP-level market 78133
- Home prices YoY
- -33.8%
- Rents YoY
- -1.2%
- Active inventory
- 1029
- Price-to-rent
- 10.9×
Monthly cashflow live
- Estimated rent
- $2,284 medium interval (Pro) →
- Mortgage (P&I)
- −$1,573
- Tax from tax record
- −$368 /mo · $4,414/yr
- Insurance
- −$125
- HOA
- −$8
- Vacancy / Maint / Mgmt
- −$480
- Net cashflow
- $-270
Break-even live
Sensitivity live
| Price | -10% $-100 | -5% $-185 | +0% $-270 | +5% $-355 | +10% $-440 |
|---|---|---|---|---|---|
| Rent | -10% $-450 | -5% $-360 | +0% $-270 | +5% $-180 | +10% $-89 |
| Rate | -1.0pp $-119 | -0.5pp $-193 | base $-270 | +0.5pp $-347 | +1.0pp $-427 |
UW: 25.0% down · 7.5% · 30yr · 1.5% tax · 5.0% vac · 8.0% maint · 8.0% mgmt
Financing live
Cash to close
- Down payment
- $75,000
- Closing costs
- $9,000
- Reserves months
- —
- Total cash needed
- —
Loan-product check · same deal, 3 products live
Conventional
25% down · 7.5% · 30yr
- Down + closing
- —
- Monthly P&I
- —
- Monthly cashflow
- —
- DSCR
- —
- Eligible?
- —
Personal DTI + credit; lowest rate.
DSCR
20% down · 8.5% · 30yr
- Down + closing
- —
- Monthly P&I
- —
- Monthly cashflow
- —
- DSCR
- —
- Eligible?
- —
No personal income docs; deal must DSCR.
Hard money
10% down · 12.0% · 12mo
- Down + closing
- —
- Monthly P&I
- —
- Monthly cashflow
- —
- DSCR
- —
- Eligible?
- —
Short-term bridge; refi at stabilization.
Rent comps 2 comps
| Address | Beds | Baths | Sqft | Rent | $/sqft | DOM | Units | Dist |
|---|---|---|---|---|---|---|---|---|
| 968 Marlys Ave Canyon Lake, TX | 3.0 | 2.0 | 1293 | $2,400 | $1.86 | 26d | 1 | 0.26mi |
| 1405 Yaupon Dr Fischer, TX | 3.0 | 2.0 | 1458 | $2,500 | $1.71 | 4d | 1 | 1.37mi |
HOA detail
- Monthly dues
- $8 · $96/yr
- Likely covers
- security
Listing history 50 events
-
2026-06-21days on market $300,000 Active 54 DOM
-
2026-06-18days on market $300,000 Active 51 DOM
-
2026-06-17days on market $300,000 Active 50 DOM
-
2026-06-16days on market $300,000 Active 49 DOM
-
2026-06-15days on market $300,000 Active 48 DOM
-
2026-06-13days on market $300,000 Active 46 DOM
-
2026-06-10days on market $300,000 Active 42 DOM
-
2026-06-08days on market $300,000 Active 41 DOM
-
2026-06-07days on market $300,000 Active 40 DOM
-
2026-06-04days on market $300,000 Active 37 DOM
-
2026-06-03days on market $300,000 Active 36 DOM
-
2026-06-02days on market $300,000 Active 35 DOM
-
2026-06-01days on market $300,000 Active 34 DOM
-
2026-05-31days on market $300,000 Active 33 DOM
-
2026-05-08status Back on Market 1211-char remark
-
2026-05-02historical Active Option 1211-char remark
-
2026-04-28$300,000 New 1211-char remark
-
2026-04-08historical
-
2026-04-01price $315,000
-
2026-02-21price $319,000
-
2026-01-17historical
-
2025-10-16price $329,000
-
2025-10-15price $329,000
-
2025-10-15price
-
2025-09-16price $339,000
-
2025-09-15price $339,000
-
2025-09-15price
-
2025-08-25price $349,000
-
2025-08-19price $339,000
-
2025-07-23$349,000 New
-
2025-07-23$349,000 Active
-
2025-07-23Active
-
2025-07-16historical
-
2025-06-30historical
-
2024-08-19$432,000 Active
-
2024-08-19Active
-
2024-08-16$432,000 New
-
2024-08-16historical
-
2024-07-08$370,900 New
-
2018-06-12soldstatus
-
2018-06-11soldstatus Sold
-
2018-05-24historical
-
2018-04-29status Pending
-
2018-04-29status Pending with Option
-
2018-04-23$200,000 Active
-
2018-04-23$200,000 New
-
2012-06-19soldstatus
-
2012-05-18historical
-
2011-08-16$114,900
-
2007-10-30soldstatus
ⓘ Source: listings_history table (triggers on properties + properties_extension) + one-shot
backfill from property_details.listing_events for pre-trigger history.
Tax reassessment forecast TX · Resets to sale price
- Current annual tax
- $4,414 · $368/mo
- Projected year-2 tax
- $5,490 · $458/mo
- Expected delta
- +$1,076/yr (+$90/mo · 24.4%)
ⓘ Screening estimate from a state-policy table — verify with the county assessor before closing.
Climate risk First Street
- Flood 1/10 Low FEMA zone X (unshaded) · 0% chance over 30 yrs
- Wildfire 4/10 Moderate
- Heat 7/10 Severe 7 d/yr ≥106°F today · 22 d/yr by 30 yrs out
- Wind 6/10 Major 67% chance of damaging wind over 30 yrs
- Air quality 2/10 Low 0 unhealthy d/yr today · 1 by 30 yrs out
Nearby sold comps map
Loading sold comps map…
Walkable amenities ~0.75 mi
Loading nearby amenities…
Taxation est. · year 1
- Rental income
- $27,408
- − Mortgage interest
- −$16,805
- − Property taxes
- −$4,414
- − Insurance
- −$1,500
- − Repairs & maintenance
- −$2,193
- − Management
- −$2,193
- − HOA
- −$96
- − Depreciation
- −$8,727
- Taxable loss
- −$8,520
- Est. tax savings @ 24.0%
- +$2,045
- After-tax cash flow
- $-1,192/yr
For passive investors: Depreciation is non-cash, so a rental often shows a tax loss while cash-flowing — sheltering income. Rental losses are passive: they offset passive income freely, and up to $25,000/yr can offset ordinary (W-2) income if you actively participate and your MAGI is under $100k (phasing out to $0 by $150k); unused losses carry forward. On sale, claimed depreciation is recaptured at up to 25%, and gains may owe capital-gains tax (a 1031 exchange can defer both). Figures are a year-1 estimate at your 24.0% rate — not tax advice; consult a CPA.
Schools (NCES district)
- District
- Comal ISD
- NCES district ID
- 4814730
- Math proficiency
- 57% ▼ -9.00%
- Reading proficiency
- 59% ▼ -2.00%
- Median HH income
- $74,792
- Composite
- 51.79/100
- National rank
- #1671
- State rank
- #58 of 826 in TX
Livability — Canyon Lake
- Score
- 67/100
- State rank
- #534
- US rank
- #10441
Category grades
Schools grade is shown separately in the Schools card above.
Census & demographics
- County
- Comal County · 206,262 people
- City population
- 42,159
- Metro
- San Antonio-New Braunfels, TX
- Population (ZIP)
- 21,959
- Household income
- $83,853
- Rent vs Own
- Severe rent burden
- 402.0
Population outlook (Comal County) Hauer SSP2
- Today (2025)
- 175,637 people
- By 2030
- 199,911 · +13.8%
- By 2040
- 249,436 · +42.0%
- By 2050
- 299,430 · +70.5%
- By 2075
- 423,857 · +141.3%
- By 2100
- 512,048 · +191.5%
Race, ethnicity, and origin ACS 2023
- Neighborhood character
- Predominantly White (74%)
- Race & ethnicity
- White 74% Hispanic / Latino 20% Two or more races 10% Black 2%
- Hispanic origin (detail)
- Mexican 15%
- Common ancestry
- Lithuanian 3% Romanian 3% Italian 3%
- Foreign-born
- 4% · Canada
- Languages at home
- 91% English-only · Spanish 7%
Political lean MEDSL · Comal
- 2024 margin
- Solid R (+45.5) · D 26.8% · R 72.2%
- 2008→2024 swing
- +1.9pp toward D · 2008: -47.4pp · 2024: -45.5pp
- All cycles
- 2024: R+45.5 2020: R+42.7 2016: R+50.1 2012: R+54.1 2008: R+47.4
Not yet ingested
- Civics
- —
Market trends
- HPI YoY
- ▼ -111.36%
- Current HPI
- 218.4633
- Rent YoY
- ▼ -1.20%
- Metro
- San Antonio-New Braunfels, TX
- State GDP YoY
- ▲ 3.95%
- F500 in state
- 110
Industry mix (Fortune 500 HQ in TX)
| Industry | F500 HQs | Revenue |
|---|---|---|
| Energy | 16 | $1,198B |
|
||
| Technology | 5 | $198B |
|
||
| Engineering / Construction | 4 | $72B |
|
||
| Energy Services | 3 | $60B |
|
||
| Utilities | 3 | $41B |
|
||
| Healthcare | 2 | $330B |
|
||
Price history
+136.2% since first listed40 events — show timeline
- 2026-05-08 Relisted — LERA
- 2026-05-02 Contingent — LERA
- 2026-04-28 Listed $300,000 LERA
- 2026-04-08 Listing Removed — LERA
- 2026-04-01 Price Changed $315,000 LERA
- 2026-02-21 Price Changed $319,000 LERA
- 2026-01-17 Listing Removed — CTXMLS
- 2025-10-16 Price Changed $329,000 LERA
- 2025-10-15 Price Changed $329,000 CTXMLS
- 2025-10-15 Price Changed — Unlock MLS
- 2025-09-16 Price Changed $339,000 LERA
- 2025-09-15 Price Changed $339,000 CTXMLS
- 2025-09-15 Price Changed — Unlock MLS
- 2025-08-25 Price Changed $349,000 LERA
- 2025-08-19 Price Changed $339,000 LERA
- 2025-07-23 Listed $349,000 LERA
- 2025-07-23 Listed — Unlock MLS
- 2025-07-23 Listed $349,000 CTXMLS
- 2025-07-16 Listing Removed — LERA
- 2025-06-30 Listing Removed — CTXMLS
- 2024-08-19 Listed — Unlock MLS
- 2024-08-19 Listed $432,000 CTXMLS
- 2024-08-16 Listing Removed — LERA
- 2024-08-16 Listed $432,000 LERA
- 2024-07-08 Listed $370,900 LERA
- 2018-06-12 Sold (Public Records) — Public Records
- 2018-06-11 Sold (MLS) — LERA
- 2018-05-24 Listing Removed — CTXMLS
- 2018-04-29 Pending — LERA
- 2018-04-29 Pending — CTXMLS
- 2018-04-23 Listed $200,000 CTXMLS
- 2018-04-23 Listed $200,000 LERA
- 2012-06-19 Sold (MLS) — LERA
- 2012-05-18 Listing Removed — LERA
- 2011-08-16 Listed $114,900 LERA
- 2007-10-30 Sold (MLS) — LERA
- 2007-10-19 Sold (Public Records) — Public Records
- 2007-07-11 Listing Removed — LERA
- 2007-04-26 Listed $127,000 LERA
- 2006-05-19 Sold (Public Records) — Public Records
Property tax history
+3.1%/yrLatest (2026): $4,414 · -5.0% YoY. Source: county tax records.
Cash-flow waterfall
monthlySold comps — $/sqft
last 12 mo · ≤1 miLoading sold comps…