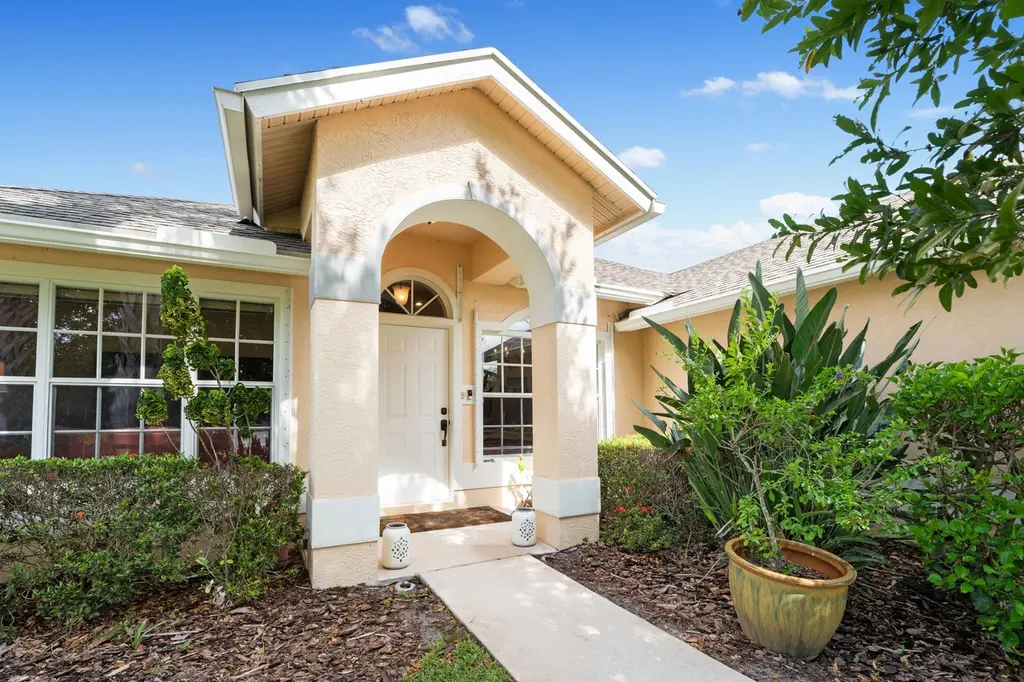
4652 SW Alpha St · Port St. Lucie, FL
Flood risk 1/10 · Minimal
- FEMA flood zone
- X (unshaded)
- Chance of flooding over 30 yrs
- 0.0%
- Est. flood insurance / yr
- $507 – $1,088
Fire risk 3/10 · Minor
- Est. fire insurance / yr
- $947 – $1,759
Heat risk 10/10 · Severe
- Hot days now (above 106°F)
- 7 days/yr
- Hot days in 30 yrs
- 25 days/yr
Wind risk 10/10 · Severe
- Chance of severe wind over 30 yrs
- 99.0%
Air-quality risk 1/10 · Minimal
- Unhealthy air days now
- 0 days/yr
- Unhealthy air days in 30 yrs
- 0 days/yr
Risk factors via First Street. Map © Google.
Why this score? — see what drove the D- grade
The composite is a weighted blend of 9 inputs, each scored 0–100. Each bar is that input's sub-score; the figure is the points it added to the 100-point composite (weight × sub-score).
- Cash flow +13.7/30.0
- ARV discount +5.9/15.0
- DSCR +4.2/10.0
- Schools +3.7/10.0
- 1% rule +2.8/10.0
- Rent growth +2.6/5.0
- Livability +2.5/5.0
- Condition / age +2.5/5.0
- Appreciation +0.0/10.0
$389,000
🖨 Deal sheet (PDF) 📄 Offer letter ✓ Due diligence
Listing remarks MLS
THIS IS A TRUE UNIQUE HOME THAT IS A MUST SEE. CENTRALLY LOCATED CLOSE TO HIGHWAYS, SHOPS AND MORE. DRIVING UP TO THE HOME YOU ARE GREETED WITH A NICE FRONT ELEVATION AND OTHER REALLY NICE AMENITIES. ENTERING THE PROPERTY YOU ARE TAKEN BY THE VERY NICE WOOD FLOORS AND UPGRADES. YOU ARE WALKING INTO A NICE SEPARATE LIVING, DINING AND FAMILY ROOM. THE FAMILY ROOM WHICH IS OVERLOOKED BY THE NICE KITCHEN OFFERS A FIREPLACE AND MORE. THIS HOME IS UNIQUE AND IS A GREAT OPPORTUNITY.
Key facts
- Open patio
- Usable outdoor space
- 0.23 acre lot
Tags
Property features AI
Finance
- Other: Pets allowed with no restrictions
Exterior
- Parking: Total of 68 parking spaces on the property; Attached 2-car garage; Covered parking (2 spaces); Concrete driveway
- Security: Closed-circuit cameras; Smoke detectors
- Utilities: Public water; Public sewer; Electricity available; Water available; Sewer available
- Home design: Single-family residence; One story; Resale property; Faces east
- Construction: Block/Concrete/CBS construction; Composition shingle roof
- Exterior features: Open patio; Patio; Shed/outbuilding for storage; Backyard fencing; Landscaped yard; Many trees; Room for a pool; Publicly maintained road frontage
Interior
- Kitchen: Dishwasher; Electric range; Microwave; Refrigerator; Garbage disposal; Owned water purifier; Electric water heater
- Bedrooms: Three bedrooms on the main level
- Flooring: Tile flooring; Wood flooring
- Bathrooms: Two full bathrooms on the main level
- Heating & cooling: Central heating; Central air conditioning; Ceiling fans
- Interior features: Built-in features; Entrance foyer; High ceilings; Vaulted ceilings; Walk-in closets; Split bedroom layout; French doors; Wood-burning fireplace
- Laundry & utility: Laundry room inside the house
Neighborhood map
What this means for you Summary
Snapshot
- This is a 3-bed/2.0-bath single-family listed at $389k.
Deal economics
- At list price, monthly cash flow is $31 ($368/yr) — positive.
- The deal already cash-flows at list — no discount required.
- To meet the 1% rule (rent ≥ 1% of price), the offer needs to be $302k (22.4% below list).
- Recommended offer: $302k (22.4% below list) — sets the bar for 1% rule.
- Cap rate 6.4% vs local median 3.9% in Port St. Lucie — top-decile yield for the area; either an underpriced asset or a hidden risk that comps aren't pricing in. Stress-test before assuming the spread holds.
Location & tenants
- Location reads: area grade D — affects rentability + tenant quality, not the cash-flow math above.
- St. Lucie (urban): math 40% / reading 48% proficiency, ranked #51 of 73 in FL (top 70%) — families likely to look elsewhere, expect single-tenant / working-renter base with shorter leases.
- Market conditions: Rents flat; 758 active listings in the ZIP; 17 comparable units currently listed for rent nearby; rentals at typical pace (median 25d on market — plan ~3-4 weeks tenant-placement turnaround); solid renter incomes; 4,868 units permitted in St. Lucie County in 2024 (268 in 5+ unit buildings).
- This rent runs 42% of the median local income ($86k/yr) — at the standard rent-burdened threshold; future hikes will face affordability resistance.
Forward outlook
- Local home prices are declining (-3.0%/yr); year-one equity from $3k of loan paydown is wiped out by about $12k of value loss. Plan a longer hold.
- St. Lucie County population projected at +20% by 2050 — long-run rental-demand tailwind backs the buy-and-hold thesis.
Negotiation context
- It's been on market 20 days — a 2% lower offer ($383k) is reasonable based on typical stale-listing flexibility.
- 5 sale attempts since 24y ago with the ask held roughly flat each time — persistent listings suggest the price (not the market) is what's stuck; bring a comps-based counter.
- Current owner paid $86k; list at $389k implies a 352% gain — meaningful room to come down on a strong offer.
Risks & watch-outs
- Climate carrying-cost: severe wind risk, 99% chance of damaging wind over 30y; extreme-heat days projected 7→25/yr by 2055 (HVAC capex compounding) — expect insurance premiums to compound above CPI over the hold.
Questions for the listing agent
- Is there a deadline driving the sale (1031 exchange, divorce, estate, relocation)? That informs how much negotiation room exists.
- The area grade is low — what's the realistic commute time and amenity access for the typical tenant pool here? Any planned neighborhood developments (good or bad) we should know about?
- What's the average days-on-market for RENTAL listings here right now (not sales)? A rising rental-DOM trend means longer vacancies and softer asking-rent achievability than the comps imply.
- What's the recent tenant-quality profile in this submarket — average credit score on applications, eviction rate, late-payment / NSF rate, and stable-employment percentage? A property-management company in the area should have these aggregated.
- How much new for-sale + rental construction is in the pipeline within 1–3 miles? Heavy new supply typically softens prices + rents 12–24 months out; constrained supply supports both.
Investment metrics
- 1% rule
- 0.78% ✗
- Cap rate
- 6.39%
- Cash-on-cash
- 0.34%
- DSCR
- 1.02
- GRM
- 10.7
CMA / ARV
- ARV (on-the-fly)
- $375,360
- Comps found
- 6
Show comp detail 6 sales within ~0.75 mi
| Address | Dist | Beds/Ba | Sqft | Sold | Price | $/sf | Match |
|---|---|---|---|---|---|---|---|
| 504 SW Pea Ct | 0.40mi | 3/2.0 | 1,353 (-0%) | 11mo | $400,000 | $296 | 71 |
| 4657 SW Leeward St | 0.16mi | 3/2.0 | 1,559 (+15%) | 16mo | $370,000 | $237 | 55 |
| 373 SW Columbus Dr | 0.39mi | 3/2.0 | 1,443 (+6%) | 21mo | $350,000 | $243 | 54 |
| 135 SW Felix Ave | 0.39mi | 3/2.0 | 1,172 (-14%) | 10mo | $349,900 | $299 | 50 |
| 4621 SW Darwin Blvd | 0.21mi | 3/2.0 | 1,552 (+14%) | 23mo | $395,990 | $255 | 48 |
| 4323 SW Otto Ct | 0.72mi | 3/2.0 | 1,552 (+14%) | 16mo | $427,990 | $276 | 30 |
Match score weights: distance 35% · size 25% · config 20% · recency 20%. Top-matched comps best support the ARV.
Projected returns pro-forma
-3.0% appreciation · 0.22% rent growth · sell at horizon
- IRR
- -18.6%
- Equity multiple
- 0.36×
- Total profit
- $-69,458
- Equity at exit
- $58,001
- IRR
- -16.9%
- Equity multiple
- 0.17×
- Total profit
- $-90,506
- Equity at exit
- $33,634
Cash invested: $108,920 (down + closing). Projections, not guarantees.
Landlord ↔ Tenant lean methodology
- Overall (STATE)
- 87 Strongly Landlord-Friendly
- State Florida
- 87 Strongly Landlord-Friendly · R+3
- County
- — inherits STATE
- City
- — inherits STATE
ZIP-level market 34953
- Home prices YoY
- -10.1%
- Rents YoY
- 0.2%
- Active inventory
- 758
- Price-to-rent
- 10.7×
Monthly cashflow live
- Estimated rent
- $3,019 high interval (Pro) →
- Mortgage (P&I)
- −$2,040
- Tax from tax record
- −$152 /mo · $1,823/yr
- Insurance
- −$162
- HOA
- −$0
- Vacancy / Maint / Mgmt
- −$634
- Net cashflow
- $31
Break-even live
Sensitivity live
| Price | -10% $251 | -5% $141 | +0% $31 | +5% $-79 | +10% $-190 |
|---|---|---|---|---|---|
| Rent | -10% $-208 | -5% $-89 | +0% $31 | +5% $150 | +10% $269 |
| Rate | -1.0pp $227 | -0.5pp $130 | base $31 | +0.5pp $-70 | +1.0pp $-173 |
UW: 25.0% down · 7.5% · 30yr · 1.5% tax · 5.0% vac · 8.0% maint · 8.0% mgmt
Financing live
Cash to close
- Down payment
- $97,250
- Closing costs
- $11,670
- Reserves months
- —
- Total cash needed
- —
Loan-product check · same deal, 3 products live
Conventional
25% down · 7.5% · 30yr
- Down + closing
- —
- Monthly P&I
- —
- Monthly cashflow
- —
- DSCR
- —
- Eligible?
- —
Personal DTI + credit; lowest rate.
DSCR
20% down · 8.5% · 30yr
- Down + closing
- —
- Monthly P&I
- —
- Monthly cashflow
- —
- DSCR
- —
- Eligible?
- —
No personal income docs; deal must DSCR.
Hard money
10% down · 12.0% · 12mo
- Down + closing
- —
- Monthly P&I
- —
- Monthly cashflow
- —
- DSCR
- —
- Eligible?
- —
Short-term bridge; refi at stabilization.
Rent comps 17 comps
| Address | Beds | Baths | Sqft | Rent | $/sqft | DOM | Units | Dist |
|---|---|---|---|---|---|---|---|---|
| 393 SW Tarra Ave Port Saint Lucie, FL | 4.0 | 2.0 | 1827 | $2,900 | $1.59 | 22d | 1 | 0.26mi |
| 4481 SW Darlington St Port Saint Lucie, FL | 4.0 | 2.0 | 1796 | $2,700 | $1.50 | 15d | 1 | 0.69mi |
| 223 SW Elderberry Dr Port Saint Lucie, FL | 3.0 | 2.0 | 1231 | $2,200 | $1.79 | 24d | 1 | 0.79mi |
| 601 SW Icon Ave Port Saint Lucie, FL | 3.0 | 2.0 | 1383 | $2,800 | $2.02 | 22d | 1 | 0.85mi |
| 860 SW Bushel Trl Palm City, FL | 3.0 | 2.5 | 1840 | $3,750 | $2.04 | 24d | 1 | 0.89mi |
| 864 SW Bushel Trl Palm City, FL | 3.0 | 2.5 | 1855 | $3,900 | $2.10 | 24d | 1 | 0.89mi |
| 866 SW Bushel Trl Palm City, FL | 3.0 | 2.5 | 1846 | $3,900 | $2.11 | 24d | 1 | 0.89mi |
| 4498 SW Port St Lucie Blvd Port Saint Lucie, FL | 3.0 | 2.5 | 1122 | $2,500 | $2.23 | 24d | 1 | 0.93mi |
| 511 SW Nadell Ave Port Saint Lucie, FL | 4.0 | 2.0 | 1833 | $2,486 | $1.36 | 15d | 1 | 0.95mi |
| 7808 SW Cline St Palm City, FL | 3.0 | 2.5 | 1846 | $4,000 | $2.17 | 24d | 1 | 1.00mi |
| 930 SW Prairie Ave Palm City, FL | 3.0 | 3.0 | 1834 | $3,800 | $2.07 | 24d | 1 | 1.01mi |
| 149 SW Becker Rd Port Saint Lucie, FL | 3.0 | 2.0 | 1233 | $2,400 | $1.95 | 15d | 1 | 1.13mi |
| 459 SW Laconic Ave Port Saint Lucie, FL | 3.0 | 2.0 | 1351 | $2,670 | $1.98 | 15d | 1 | 1.15mi |
| 4285 SW Walker St Port Saint Lucie, FL | 4.0 | 2.0 | 1833 | $2,476 | $1.35 | 15d | 1 | 1.29mi |
| 4262 SW Jared St Port Saint Lucie, FL | 3.0 | 2.0 | 1240 | $2,350 | $1.90 | 24d | 1 | 1.29mi |
| 962 SW Kappa Ave Port Saint Lucie, FL | 3.0 | 2.0 | 1275 | $3,000 | $2.35 | 24d | 1 | 1.41mi |
| 269 SW Ridgecrest Dr Port Saint Lucie, FL | 3.0 | 2.0 | 1740 | $2,595 | $1.49 | 24d | 1 | 1.41mi |
Listing history 17 events
-
2026-06-18days on market $389,000 Active 20 DOM
-
2026-06-17days on market $389,000 Active 19 DOM
-
2026-06-16days on market $389,000 Active 18 DOM
-
2026-06-15days on market $389,000 Active 17 DOM
-
2026-06-14days on market $389,000 Active 15 DOM
-
2026-06-13days on market $389,000 Active 14 DOM
-
2026-06-10days on market $389,000 Active 12 DOM
-
2026-06-09days on market $389,000 Active 11 DOM
-
2026-06-08days on market $389,000 Active 10 DOM
-
2026-06-07days on market $389,000 Active 9 DOM
-
2026-06-05days on market $389,000 Active 6 DOM
-
2026-06-03days on market $389,000 Active 5 DOM
-
2026-06-02days on market $389,000 Active 4 DOM
-
2026-06-01days on market $389,000 Active 3 DOM
-
2026-05-31days on market $389,000 Active 2 DOM
-
2026-05-30remarks 699-char remark
-
2026-05-30$389,000 Active 1 DOM
ⓘ Source: listings_history table (triggers on properties + properties_extension) + one-shot
backfill from property_details.listing_events for pre-trigger history.
Tax reassessment forecast FL · Resets to sale price
- Current annual tax
- $1,823 · $152/mo
- Projected year-2 tax
- $3,229 · $269/mo
- Expected delta
- +$1,405/yr (+$117/mo · 77.1%)
ⓘ Screening estimate from a state-policy table — verify with the county assessor before closing.
Climate risk First Street
- Flood 1/10 Low FEMA zone X (unshaded) · 0% chance over 30 yrs
- Wildfire 3/10 Moderate
- Heat 10/10 Extreme 7 d/yr ≥106°F today · 25 d/yr by 30 yrs out
- Wind 10/10 Extreme 99% chance of damaging wind over 30 yrs
- Air quality 1/10 Low 0 unhealthy d/yr today · 0 by 30 yrs out
Nearby sold comps map
Loading sold comps map…
Walkable amenities ~0.75 mi
Loading nearby amenities…
Taxation est. · year 1
- Rental income
- $36,222
- − Mortgage interest
- −$21,790
- − Property taxes
- −$1,823
- − Insurance
- −$1,945
- − Repairs & maintenance
- −$2,898
- − Management
- −$2,898
- − Depreciation
- −$11,316
- Taxable loss
- −$6,448
- Est. tax savings @ 24.0%
- +$1,548
- After-tax cash flow
- $1,915/yr
For passive investors: Depreciation is non-cash, so a rental often shows a tax loss while cash-flowing — sheltering income. Rental losses are passive: they offset passive income freely, and up to $25,000/yr can offset ordinary (W-2) income if you actively participate and your MAGI is under $100k (phasing out to $0 by $150k); unused losses carry forward. On sale, claimed depreciation is recaptured at up to 25%, and gains may owe capital-gains tax (a 1031 exchange can defer both). Figures are a year-1 estimate at your 24.0% rate — not tax advice; consult a CPA.
Schools (NCES district)
- District
- St. Lucie
- NCES district ID
- 1201770
- Math proficiency
- 40% ▼ -11.00%
- Reading proficiency
- 48% ▼ -4.00%
- Median HH income
- $44,737
- Composite
- 37.28/100
- National rank
- #4449
- State rank
- #51 of 73 in FL
Livability — Port St. Lucie
No livability data for this city. (Only ~50 U.S. cities are tracked.)
Census & demographics
- Census place
- Port St. Lucie, FL
- County
- Saint Lucie County · 337,150 people
- City population
- 221,051
- Metro
- Port St. Lucie, FL
- Population (ZIP)
- 86,875
- Household income
- $85,667
- Rent vs Own
- Severe rent burden
- 857.0
Population outlook (St. Lucie County) Hauer SSP2
- Today (2025)
- 338,016 people
- By 2030
- 355,687 · +5.2%
- By 2040
- 385,521 · +14.1%
- By 2050
- 406,106 · +20.1%
- By 2075
- 441,054 · +30.5%
- By 2100
- 436,885 · +29.2%
Race, ethnicity, and origin ACS 2023
- Neighborhood character
- Diverse neighborhood (Simpson 0.69)
- Race & ethnicity
- White 42% Hispanic / Latino 28% Black 23% Two or more races 15% Asian 2%
- Hispanic origin (detail)
- Mexican 2% Puerto Rican 8% Cuban 4% Dominican 3%
- Common ancestry
- Hispanic 4% Romanian 2% Estonian 2%
- Foreign-born
- 24% · Canada, Jamaica, China
- Languages at home
- 69% English-only · Spanish 19% French/Haitian/Cajun 6% Other Indo-European 3%
Political lean MEDSL · St. Lucie
- 2024 margin
- Lean R (+9.1) · D 45.1% · R 54.2%
- 2008→2024 swing
- -21.2pp toward R · 2008: 12.1pp · 2024: -9.1pp
- All cycles
- 2024: R+9.1 2020: R+1.6 2016: R+2.5 2012: D+7.9 2008: D+12.1
Not yet ingested
- Civics
- —
Market trends
- HPI YoY
- ▼ -44.19%
- Current HPI
- 392.7681
- Rent YoY
- ▲ 0.22%
- Metro
- Port St. Lucie, FL
- State GDP YoY
- ▲ 3.28%
- F500 in state
- 36
Industry mix (Fortune 500 HQ in FL)
| Industry | F500 HQs | Revenue |
|---|---|---|
| Industrial Technology | 2 | $29B |
|
||
| Insurance | 2 | $17B |
|
||
| Retail | 1 | $60B |
|
||
| Technology Distribution | 1 | $58B |
|
||
| Homebuilding | 1 | $35B |
|
||
| Technology Manufacturing | 1 | $35B |
|
||
Price history
+6383.3% since first listed13 events — show timeline
- 2026-05-29 Listed $389,000 Beaches MLS
- 2011-03-28 Sold (Public Records) $86,000 Public Records
- 2011-03-18 Sold (MLS) $86,000 Beaches MLS
- 2011-03-10 Listing Removed — Beaches MLS
- 2010-11-08 Listed $90,000 Beaches MLS
- 2006-06-28 Sold (MLS) $73,000 Beaches MLS
- 2006-06-17 Listing Removed — Beaches MLS
- 2006-04-25 Listed $74,900 Beaches MLS
- 2006-03-03 Listing Removed — Beaches MLS
- 2006-01-10 Listed $89,900 Beaches MLS
- 2002-06-28 Sold (MLS) $6,000 Beaches MLS
- 2002-05-28 Listing Removed — Beaches MLS
- 2002-03-04 Listed $6,000 Beaches MLS
Property tax history
+2.0%/yrLatest (2025): $1,823 · +16.7% YoY. Source: county tax records.
Cash-flow waterfall
monthlySold comps — $/sqft
last 12 mo · ≤1 miLoading sold comps…