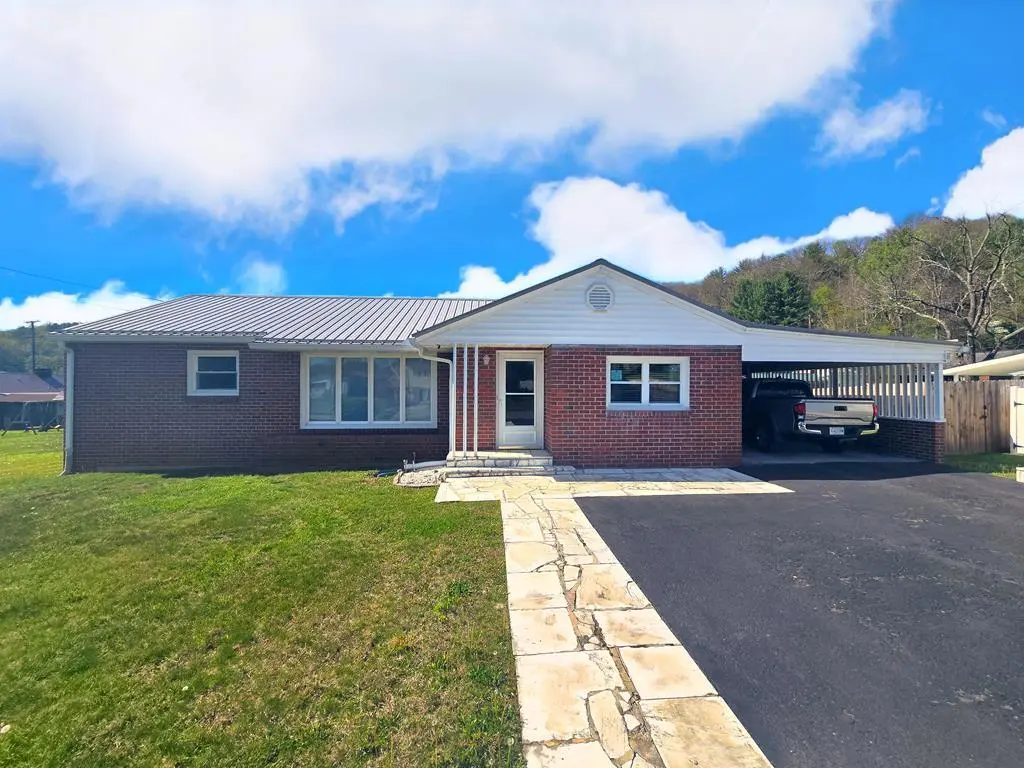
106 Second Ave · Richlands, VA
Flood risk 1/10 · Minimal
- FEMA flood zone
- X (unshaded)
- Chance of flooding over 30 yrs
- 0.0%
- Est. flood insurance / yr
- $507 – $1,088
Fire risk 3/10 · Minor
- Est. fire insurance / yr
- $666 – $1,236
Heat risk 3/10 · Minor
- Hot days now (above 93°F)
- 8 days/yr
- Hot days in 30 yrs
- 22 days/yr
Wind risk 2/10 · Minimal
- Chance of severe wind over 30 yrs
- —
Air-quality risk 1/10 · Minimal
- Unhealthy air days now
- 0 days/yr
- Unhealthy air days in 30 yrs
- 0 days/yr
Risk factors via First Street. Map © Google.
Why this score? — see what drove the D- grade
The composite is a weighted blend of 9 inputs, each scored 0–100. Each bar is that input's sub-score; the figure is the points it added to the 100-point composite (weight × sub-score).
- Cash flow +10.0/30.0
- Schools +6.0/10.0
- ARV discount +4.6/15.0
- Appreciation +4.1/10.0
- Livability +3.3/5.0
- DSCR +2.9/10.0
- Rent growth +2.5/5.0
- Condition / age +2.5/5.0
- 1% rule +1.9/10.0
$185,000
🖨 Deal sheet 📄 Offer letter ✓ Due diligence
Listing remarks
Welcome to 106 Second Ave, Richlands, VA, located in the desirable Lake Park Subdivision. This well-maintained one-story brick ranch offers 4 bedroom, 1.5 bath and 1,738 sqft, and is move-in ready with a great combination of comfort and charm. Enjoy relaxing on the screened-in porch, complete with a built-in grill, overlooking the level yard. The home also features a convenient carport, a 10x10 storage shed, and a bonus shower in the utility room. Inside, you'll find beautiful hardwood floors and tile in the updated kitchen. The plumbing has been updated to PEX, adding peace of mind for the new owner. Conveniently located near the hospital, shopping, and the Spearhead Trails, this home offe
Key facts
- Level yard
- Screened-in porch
- Carport
Tags
Neighborhood map
What this means for you Summary
Snapshot
- This is a 4-bed/2.0-bath single-family listed at $185k.
Deal economics
- At list price, monthly cash flow is $-111 ($-1k/yr) — negative.
- To cash-flow at today's rent, offer at most $165k (10.6% below list).
- To meet the 1% rule (rent ≥ 1% of price), the offer needs to be $128k (30.9% below list).
- Recommended offer: $128k (30.9% below list) — sets the bar for 1% rule.
- Cap rate 5.6% vs local median 4.4% in Richlands — meaningfully above typical; check what's discounted (condition, days-on-market, listing class) to confirm the premium yield is real.
Location & tenants
- Location reads 66/100 on livability (#314 in VA) — a middle-class / working-renter tenant base. Strengths: cost of living A+, housing A-; Watch: crime C-, amenities F, commute F.
- Tazewell County Public School District (town): math 67% / reading 78% proficiency, ranked #21 of 131 in VA (top 16%) — strong family-tenant draw, lease renewals of 3-5y typical.
- Zoned schools: Richlands Elementary (math 69% / reading 79%, grade A, #248 of 1,108 statewide, top 23%, 547 students, 83% FRL); Richlands Middle (math 58% / reading 71%, grade A-, #123 of 342 statewide, top 37%, 495 students, 83% FRL); Richlands High (math 68% / reading 87%, grade A-, #83 of 319 statewide, top 28%, 636 students, 82% FRL) — zoned schools average 83% FRL vs 47% district-wide (36 pts higher); higher-poverty schools than district average — tighter screening recommended.
- Market conditions: 44 active listings in the ZIP; 4 units permitted in Tazewell County in 2024 (0 in 5+ unit buildings).
Forward outlook
- Local home prices are declining (-1.9%/yr); year-one equity from $1k of loan paydown is wiped out by about $3k of value loss. Plan a longer hold.
- Tazewell County population projected at -30% by 2050 — secular population decline; favor cash flow + early exit over multi-decade hold.
Negotiation context
- Only 4 days on market — expect competitive offers; lowballing is unlikely to land.
- 3 sale attempts since 3y ago with the ask held roughly flat each time — persistent listings suggest the price (not the market) is what's stuck; bring a comps-based counter.
Risks & watch-outs
- Watch-outs: built in 1957 — expect roof / HVAC / electrical / plumbing capex.
Questions for the listing agent
- What do current leases actually rent for vs. the listed asking? Can we see a recent rent roll and the last 12 months of T-12 income?
- Built in 1957 — when were the roof, HVAC, electrical panel, plumbing, and water heater last replaced?
- Is there a deadline driving the sale (1031 exchange, divorce, estate, relocation)? That informs how much negotiation room exists.
- Schools are B-rated — typically a magnet for longer-tenancy family renters. What's the average tenant stay here, and is there a school-zone premium baked into asking?
- The area grade is low — what's the realistic commute time and amenity access for the typical tenant pool here? Any planned neighborhood developments (good or bad) we should know about?
- What's the average days-on-market for RENTAL listings here right now (not sales)? A rising rental-DOM trend means longer vacancies and softer asking-rent achievability than the comps imply.
- What's the recent tenant-quality profile in this submarket — average credit score on applications, eviction rate, late-payment / NSF rate, and stable-employment percentage? A property-management company in the area should have these aggregated.
- How much new for-sale + rental construction is in the pipeline within 1–3 miles? Heavy new supply typically softens prices + rents 12–24 months out; constrained supply supports both.
Investment metrics
- 1% rule
- 0.69% ✗
- Cap rate
- 5.57%
- Cash-on-cash
- -2.57%
- DSCR
- 0.89
- GRM
- 12.1
CMA / ARV
- ARV (on-the-fly)
- $173,800
- Comps found
- 4
Show comp detail 4 sales within ~0.75 mi
| Address | Dist | Beds/Ba | Sqft | Sold | Price | $/sf | Match |
|---|---|---|---|---|---|---|---|
| 106 Second Ave | 0.00mi | 4/1.5 | 1,738 (0%) | 0mo | $185,000 | $106 | 98 |
| 115 1st Ave | 0.11mi | 3/1.0 (-1) | 1,544 (-11%) | 14mo | $100,000 | $65 | 56 |
| 202 Hill Creek Rd | 0.33mi | 3/2.5 (-1) | 1,992 (+15%) | 22mo | $200,000 | $100 | 35 |
| 306 Rockbridge Ave | 0.52mi | 3/1.0 (-1) | 1,488 (-14%) | 10mo | $78,000 | $52 | 34 |
Match score weights: distance 35% · size 25% · config 20% · recency 20%. Top-matched comps best support the ARV.
Projected returns pro-forma
-1.87% appreciation · 3.0% rent growth · sell at horizon
- IRR
- -13.7%
- Equity multiple
- 0.45×
- Total profit
- $-28,233
- Equity at exit
- $37,039
- IRR
- -6.4%
- Equity multiple
- 0.50×
- Total profit
- $-26,016
- Equity at exit
- $32,716
Cash invested: $51,800 (down + closing). Projections, not guarantees.
Landlord ↔ Tenant lean methodology
- Overall (STATE)
- 55 Moderately Landlord-Leaning
- State Virginia
- 55 Moderately Landlord-Leaning · D+2
- County
- — inherits STATE
- City
- — inherits STATE
ZIP-level market 24641
- Home prices YoY
- -1.3%
- Active inventory
- 44
- Price-to-rent
- 12.1×
Monthly cashflow live
- Estimated rent
- $1,279 medium interval (Pro) →
- Mortgage (P&I)
- −$970
- Tax from tax record
- −$74 /mo · $888/yr
- Insurance
- −$77
- HOA
- −$0
- Vacancy / Maint / Mgmt
- −$269
- Net cashflow
- $-111
Break-even live
UW: 25.0% down · 7.5% · 30yr · 1.5% tax · 5.0% vac · 8.0% maint · 8.0% mgmt
Financing live
Cash to close
- Down payment
- $46,250
- Closing costs
- $5,550
- Reserves months
- —
- Total cash needed
- —
Loan-product check · same deal, 3 products live
Conventional
25% down · 7.5% · 30yr
- Down + closing
- —
- Monthly P&I
- —
- Monthly cashflow
- —
- DSCR
- —
- Eligible?
- —
Personal DTI + credit; lowest rate.
DSCR
20% down · 8.5% · 30yr
- Down + closing
- —
- Monthly P&I
- —
- Monthly cashflow
- —
- DSCR
- —
- Eligible?
- —
No personal income docs; deal must DSCR.
Hard money
10% down · 12.0% · 12mo
- Down + closing
- —
- Monthly P&I
- —
- Monthly cashflow
- —
- DSCR
- —
- Eligible?
- —
Short-term bridge; refi at stabilization.
Listing history 6 events
-
2026-04-24status Pending
-
2026-04-20$185,000 Active
-
2023-08-29status Active
-
2023-08-19historical
-
2023-05-26price $242,900
-
2023-03-23$259,900 Active
ⓘ Source: listings_history table (triggers on properties + properties_extension) + one-shot
backfill from property_details.listing_events for pre-trigger history.
Tax reassessment forecast VA · Resets to sale price
- Current annual tax
- $888 · $74/mo
- Projected year-2 tax
- $1,517 · $126/mo
- Expected delta
- +$629/yr (+$52/mo · 70.8%)
ⓘ Screening estimate from a state-policy table — verify with the county assessor before closing.
Climate risk First Street
- Flood 1/10 Low FEMA zone X (unshaded) · 0% chance over 30 yrs
- Wildfire 3/10 Moderate
- Heat 3/10 Moderate 8 d/yr ≥93°F today · 22 d/yr by 30 yrs out
- Wind 2/10 Low
- Air quality 1/10 Low 0 unhealthy d/yr today · 0 by 30 yrs out
Nearby sold comps map
Loading sold comps map…
Walkable amenities ~0.75 mi
Loading nearby amenities…
Taxation est. · year 1
- Rental income
- $15,347
- − Mortgage interest
- −$10,363
- − Property taxes
- −$888
- − Insurance
- −$925
- − Repairs & maintenance
- −$1,228
- − Management
- −$1,228
- − Depreciation
- −$5,382
- Taxable loss
- −$4,666
- Est. tax savings @ 24.0%
- +$1,120
- After-tax cash flow
- $-211/yr
For passive investors: Depreciation is non-cash, so a rental often shows a tax loss while cash-flowing — sheltering income. Rental losses are passive: they offset passive income freely, and up to $25,000/yr can offset ordinary (W-2) income if you actively participate and your MAGI is under $100k (phasing out to $0 by $150k); unused losses carry forward. On sale, claimed depreciation is recaptured at up to 25%, and gains may owe capital-gains tax (a 1031 exchange can defer both). Figures are a year-1 estimate at your 24.0% rate — not tax advice; consult a CPA.
Schools (NCES district)
- District
- Tazewell County Public School District
- NCES district ID
- 5103810
- Math proficiency
- 67% ▼ -23.00%
- Reading proficiency
- 78% ▼ -6.00%
- Median HH income
- $37,003
- Composite
- 60.16/100
- National rank
- #865
- State rank
- #21 of 131 in VA
Livability — Richlands
- Score
- 66/100
- State rank
- #314
- US rank
- #11229
Category grades
Schools grade is shown separately in the Schools card above.
Census & demographics
- Census place
- Richlands, VA
- Population (ZIP)
- 5,417
Population outlook (Tazewell County) Hauer SSP2
- Today (2025)
- 38,275 people
- By 2030
- 35,719 · -6.7%
- By 2040
- 30,875 · -19.3%
- By 2050
- 26,798 · -30.0%
- By 2075
- 19,286 · -49.6%
- By 2100
- 13,631 · -64.4%
Race, ethnicity, and origin ACS 2023
- Neighborhood character
- Predominantly White (98%)
- Race & ethnicity
- White 98% Asian 2%
- Common ancestry
- Serbian 1% Italian 1%
- Foreign-born
- 1%
- Languages at home
- 98% English-only · Other Indo-European 1%
Political lean MEDSL · Tazewell
- 2024 margin
- Solid R (+68.9) · D 15.3% · R 84.2%
- 2008→2024 swing
- -36.0pp toward R · 2008: -32.9pp · 2024: -68.9pp
- All cycles
- 2024: R+68.9 2020: R+67.2 2016: R+66.3 2012: R+57.5 2008: R+32.9
Not yet ingested
- Civics
- —
Market trends
- HPI YoY
- ▼ -1.87%
- Current HPI
- 141.9823
- Rent YoY
- —
- Metro
- —
- State GDP YoY
- ▲ 2.40%
- F500 in state
- 50
Industry mix (Fortune 500 HQ in VA)
| Industry | F500 HQs | Revenue |
|---|---|---|
| Aerospace / Defense | 4 | $236B |
|
||
| Technology / Defense | 3 | $32B |
|
||
| Financial Services | 2 | $176B |
|
||
| Utilities | 2 | $27B |
|
||
| Insurance | 2 | $25B |
|
||
| Technology | 2 | $15B |
|
||
Price history
-28.8% since first listed6 events — show timeline
- 2026-04-24 Pending — SWVAR
- 2026-04-20 Listed $185,000 SWVAR
- 2023-08-29 Relisted — SWVAR
- 2023-08-19 Delisted — SWVAR
- 2023-05-26 Price Changed $242,900 SWVAR
- 2023-03-23 Listed $259,900 SWVAR
Property tax history
+3.9%/yrLatest (2025): $888 · +0.0% YoY. Source: county tax records.
Cash-flow waterfall
monthlySold comps — $/sqft
last 12 mo · ≤1 miLoading sold comps…