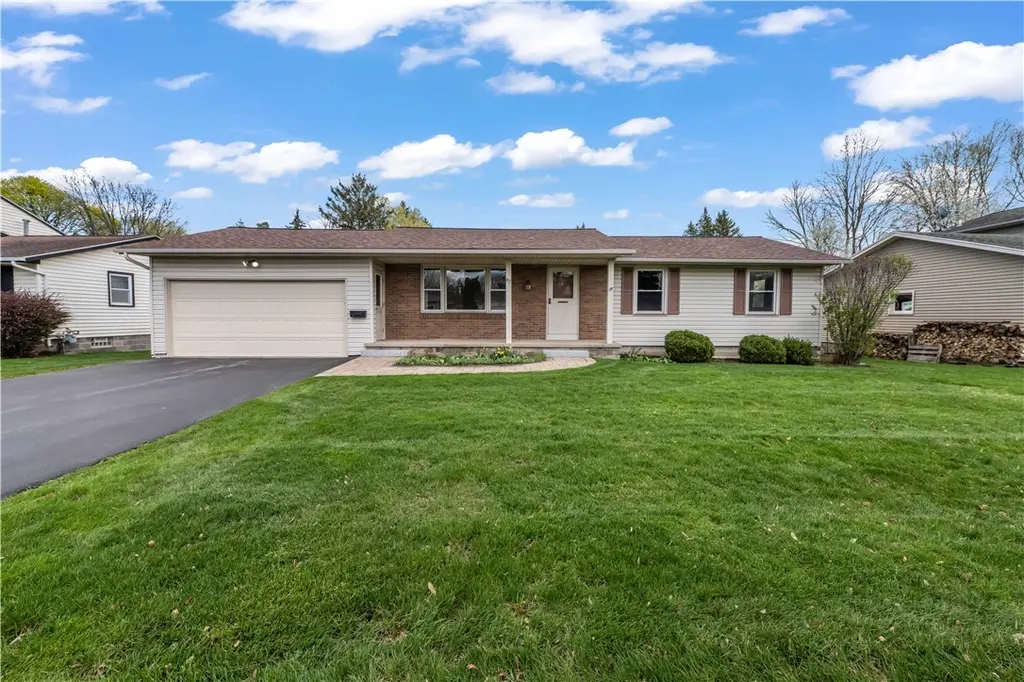
87 Bru Mar Dr · Gates, NY
Flood risk 1/10 · Minimal
- FEMA flood zone
- X (unshaded)
- Chance of flooding over 30 yrs
- 0.0%
- Est. flood insurance / yr
- $473 – $860
Fire risk 1/10 · Minimal
- Est. fire insurance / yr
- $691 – $1,283
Heat risk 2/10 · Minimal
- Hot days now (above 95°F)
- 7 days/yr
- Hot days in 30 yrs
- 15 days/yr
Wind risk 1/10 · Minimal
- Chance of severe wind over 30 yrs
- —
Air-quality risk 2/10 · Minimal
- Unhealthy air days now
- 1 days/yr
- Unhealthy air days in 30 yrs
- 2 days/yr
Risk factors via First Street. Map © Google.
Why this score? — see what drove the F grade
The composite is a weighted blend of 9 inputs, each scored 0–100. Each bar is that input's sub-score; the figure is the points it added to the 100-point composite (weight × sub-score).
- ARV discount +9.4/15.0
- Cash flow +6.6/30.0
- Rent growth +4.1/5.0
- Schools +3.6/10.0
- Livability +3.4/5.0
- 1% rule +2.9/10.0
- Condition / age +2.5/5.0
- DSCR +0.8/10.0
- Appreciation +0.0/10.0
$224,900
🖨 Deal sheet 📄 Offer letter ✓ Due diligence
Listing remarks
Welcome to this pristine one-family-owned ranch in Gates Chili Schools, where bright open living spaces, pride of ownership, and thoughtful updates come together in a home that truly stands out. Offering 3 bedrooms and 2 full baths, this well-maintained ranch features both a comfortable living room and a huge family room addition, giving you the kind of flexible space that is hard to find. The finished basement adds even more room to enjoy and includes a full bath, new carpet, and fresh paint. Sellers report the basement has always been bone dry with no history of water issues. The kitchen offers great cabinet and counter space, and all appliances remain, including both washer and dryer set
Key facts
- First floor laundry
- Finished basement
- Large spacious deck
Tags
Property features AI
Exterior
- Parking: Attached 2-car garage with garage door opener, electricity and water available
- Utilities: Public water connected; Sewer connected; Cable and high-speed internet available; Circuit breaker electrical service
- Home design: Single-story residence; Resale property
- Construction: Brick and vinyl siding exterior; Asphalt roof; Block foundation; Copper plumbing
- Exterior features: Blacktop driveway; Heated driveway; Covered porch and deck; Deck; Shed(s) and storage
Interior
- Kitchen: Dishwasher; Gas oven and gas range; Microwave; Disposal; Freezer; Refrigerator; Eat-in kitchen
- Bedrooms: Three main-level bedrooms
- Flooring: Carpet; Hardwood; Linoleum; Vinyl; Varied flooring
- Bathrooms: Two full bathrooms (one on the main level)
- Heating & cooling: Gas forced-air heating; Central air conditioning
- Interior features: Ceiling fans; Eat-in kitchen; Separate/formal living room; Finished full basement with sump pump; Total of 9 rooms (includes living, family, laundry)
- Laundry & utility: Washer and dryer included; Laundry located on main level and in basement; Gas water heater
Neighborhood map
What this means for you Summary
Snapshot
- This is a 3-bed/1.5-bath single-family listed at $225k.
Deal economics
- At list price, monthly cash flow is $-372 ($-4k/yr) — negative.
- To cash-flow at today's rent, offer at most $159k (29.2% below list).
- To meet the 1% rule (rent ≥ 1% of price), the offer needs to be $178k (20.8% below list).
- Recommended offer: $159k (29.2% below list) — sets the bar for cash-flow.
- Cap rate 4.3% vs local median 5.9% in Gates — below-typical yield; the buyer is paying a premium for something (appreciation thesis, condition, location) that the cap rate doesn't capture.
Location & tenants
- Location reads 67/100 on livability (#582 in NY) — a middle-class / working-renter tenant base. Strengths: housing A+, health & safety A+; Watch: amenities F, commute F.
- Gates-Chili Central School District (suburban): math 41% / reading 42% proficiency, ranked #491 of 590 in NY (top 83%) — families likely to look elsewhere, expect single-tenant / working-renter base with shorter leases.
- Market conditions: Rents rising fast (+6.3%/yr); 124 active listings in the ZIP; 1 comparable units currently listed for rent nearby; 1,169 units permitted in Monroe County in 2024 (591 in 5+ unit buildings).
- This rent runs 38% of the median local income ($56k/yr) — at the standard rent-burdened threshold; future hikes will face affordability resistance.
Forward outlook
- Local home prices are declining (-3.0%/yr); year-one equity from $2k of loan paydown is wiped out by about $7k of value loss. Plan a longer hold.
- Monroe County population projected to shrink 6% by 2050 — rents likely to lag national; underwrite the cash flow, not the appreciation.
Negotiation context
- Only 7 days on market — expect competitive offers; lowballing is unlikely to land.
Risks & watch-outs
- Watch-outs: property tax is 2.7% of price.
Questions for the listing agent
- What do current leases actually rent for vs. the listed asking? Can we see a recent rent roll and the last 12 months of T-12 income?
- Built in 1979 — when were the roof, HVAC, electrical panel, plumbing, and water heater last replaced?
- Property tax is high relative to price — has the assessment been appealed recently, and will the sale trigger a re-assessment?
- Is there a deadline driving the sale (1031 exchange, divorce, estate, relocation)? That informs how much negotiation room exists.
- Schools are B-rated — typically a magnet for longer-tenancy family renters. What's the average tenant stay here, and is there a school-zone premium baked into asking?
- The area grade is low — what's the realistic commute time and amenity access for the typical tenant pool here? Any planned neighborhood developments (good or bad) we should know about?
- What's the average days-on-market for RENTAL listings here right now (not sales)? A rising rental-DOM trend means longer vacancies and softer asking-rent achievability than the comps imply.
- What's the recent tenant-quality profile in this submarket — average credit score on applications, eviction rate, late-payment / NSF rate, and stable-employment percentage? A property-management company in the area should have these aggregated.
- How much new for-sale + rental construction is in the pipeline within 1–3 miles? Heavy new supply typically softens prices + rents 12–24 months out; constrained supply supports both.
Investment metrics
- 1% rule
- 0.79% ✗
- Cap rate
- 4.31%
- Cash-on-cash
- -7.08%
- DSCR
- 0.68
- GRM
- 10.5
CMA / ARV
- ARV (on-the-fly)
- $234,608
- Comps found
- 12
Show comp detail 12 sales within ~0.75 mi
| Address | Dist | Beds/Ba | Sqft | Sold | Price | $/sf | Match |
|---|---|---|---|---|---|---|---|
| 87 Bru Mar Dr | 0.00mi | 3/2.0 | 1,364 (0%) | 1mo | $305,000 | $224 | 97 |
| 41 Shadywood Dr | 0.32mi | 3/1.5 | 1,496 (+10%) | 1mo | $255,000 | $170 | 68 |
| 38 Debby Ln | 0.18mi | 3/1.0 | 1,528 (+12%) | 6mo | $200,000 | $131 | 64 |
| 68 Elder St | 0.27mi | 3/1.5 | 1,200 (-12%) | 6mo | $215,000 | $179 | 62 |
| 20 Fairchild Rd | 0.54mi | 4/1.0 (+1) | 1,346 (-1%) | 4mo | $203,000 | $151 | 62 |
| 178 Ardella St | 0.33mi | 4/1.0 (+1) | 1,246 (-9%) | 4mo | $240,000 | $193 | 60 |
| 87 Simmons St | 0.25mi | 4/1.5 (+1) | 1,520 (+11%) | 6mo | $175,000 | $115 | 59 |
| 81 Spencerport Rd | 0.49mi | 3/1.0 | 1,231 (-10%) | 5mo | $222,000 | $180 | 55 |
| 67 Colwick Rd | 0.65mi | 4/1.0 (+1) | 1,297 (-5%) | 2mo | $200,000 | $154 | 53 |
| 36 Gatewood Ave | 0.75mi | 3/1.0 | 1,242 (-9%) | 3mo | $260,000 | $209 | 46 |
| 151 Gatewood Ave | 0.68mi | 2/1.0 (-1) | 1,218 (-11%) | 4mo | $179,540 | $147 | 40 |
| 137 Rahway Rd | 0.67mi | 3/1.5 | 1,567 (+15%) | 6mo | $270,000 | $172 | 39 |
Match score weights: distance 35% · size 25% · config 20% · recency 20%. Top-matched comps best support the ARV.
Projected returns pro-forma
-3.0% appreciation · 6.28% rent growth · sell at horizon
- IRR
- -24.3%
- Equity multiple
- 0.14×
- Total profit
- $-53,874
- Equity at exit
- $33,533
- IRR
- -11.4%
- Equity multiple
- 0.20×
- Total profit
- $-50,077
- Equity at exit
- $19,445
Cash invested: $62,972 (down + closing). Projections, not guarantees.
Landlord ↔ Tenant lean methodology
- Overall (STATE)
- 15 Strongly Tenant-Friendly
- State New York
- 15 Strongly Tenant-Friendly · D+10
- County
- — inherits STATE
- City
- — inherits STATE
ZIP-level market 14606
- Home prices YoY
- -17.9%
- Rents YoY
- 6.3%
- Active inventory
- 124
- Price-to-rent
- 10.5×
Monthly cashflow live
- Estimated rent
- $1,780 medium interval (Pro) →
- Mortgage (P&I)
- −$1,179
- Tax from tax record
- −$505 /mo · $6,058/yr
- Insurance
- −$94
- HOA
- −$0
- Vacancy / Maint / Mgmt
- −$374
- Net cashflow
- $-372
Break-even live
UW: 25.0% down · 7.5% · 30yr · 1.5% tax · 5.0% vac · 8.0% maint · 8.0% mgmt
Financing live
Cash to close
- Down payment
- $56,225
- Closing costs
- $6,747
- Reserves months
- —
- Total cash needed
- —
Loan-product check · same deal, 3 products live
Conventional
25% down · 7.5% · 30yr
- Down + closing
- —
- Monthly P&I
- —
- Monthly cashflow
- —
- DSCR
- —
- Eligible?
- —
Personal DTI + credit; lowest rate.
DSCR
20% down · 8.5% · 30yr
- Down + closing
- —
- Monthly P&I
- —
- Monthly cashflow
- —
- DSCR
- —
- Eligible?
- —
No personal income docs; deal must DSCR.
Hard money
10% down · 12.0% · 12mo
- Down + closing
- —
- Monthly P&I
- —
- Monthly cashflow
- —
- DSCR
- —
- Eligible?
- —
Short-term bridge; refi at stabilization.
Rent comps 1 comps
| Address | Beds | Baths | Sqft | Rent | $/sqft | DOM | Units | Dist |
|---|---|---|---|---|---|---|---|---|
| 155 Canal Landing Blvd Rochester, NY | 1.0–3.0 | 1.5–2.0 | 1174 | $2,050 | $1.75 | 2d | 5 | 1.42mi |
Listing history 2 events
-
2026-04-29status Pending
-
2026-04-22$224,900 Active
ⓘ Source: listings_history table (triggers on properties + properties_extension) + one-shot
backfill from property_details.listing_events for pre-trigger history.
Tax reassessment forecast NY · Partial reset (capped growth)
- Current annual tax
- $6,058 · $505/mo
- Projected year-2 tax
- $6,058 · $505/mo
- Expected delta
- $0/yr ($0/mo · 0.0%)
ⓘ Screening estimate from a state-policy table — verify with the county assessor before closing.
Climate risk First Street
- Flood 1/10 Low FEMA zone X (unshaded) · 0% chance over 30 yrs
- Wildfire 1/10 Low
- Heat 2/10 Low 7 d/yr ≥95°F today · 15 d/yr by 30 yrs out
- Wind 1/10 Low
- Air quality 2/10 Low 1 unhealthy d/yr today · 2 by 30 yrs out
Nearby sold comps map
Loading sold comps map…
Walkable amenities ~0.75 mi
Loading nearby amenities…
Taxation est. · year 1
- Rental income
- $21,363
- − Mortgage interest
- −$12,598
- − Property taxes
- −$6,058
- − Insurance
- −$1,124
- − Repairs & maintenance
- −$1,709
- − Management
- −$1,709
- − Depreciation
- −$6,543
- Taxable loss
- −$8,378
- Est. tax savings @ 24.0%
- +$2,011
- After-tax cash flow
- $-2,448/yr
For passive investors: Depreciation is non-cash, so a rental often shows a tax loss while cash-flowing — sheltering income. Rental losses are passive: they offset passive income freely, and up to $25,000/yr can offset ordinary (W-2) income if you actively participate and your MAGI is under $100k (phasing out to $0 by $150k); unused losses carry forward. On sale, claimed depreciation is recaptured at up to 25%, and gains may owe capital-gains tax (a 1031 exchange can defer both). Figures are a year-1 estimate at your 24.0% rate — not tax advice; consult a CPA.
Schools (NCES district)
- District
- Gates-Chili Central School District
- NCES district ID
- 3611880
- Math proficiency
- 41% ▼ -12.00%
- Reading proficiency
- 42% ▼ -6.00%
- Median HH income
- $55,045
- Composite
- 36.23/100
- National rank
- #4719
- State rank
- #491 of 590 in NY
Livability — Gates
- Score
- 67/100
- State rank
- #582
- US rank
- #10531
Category grades
Schools grade is shown separately in the Schools card above.
Census & demographics
- Census place
- Gates, NY
- County
- Monroe County · 674,131 people
- Metro
- Rochester, NY
- Population (ZIP)
- 25,538
- Household income
- $55,807
- Rent vs Own
- Severe rent burden
- 986.0
Population outlook (Monroe County) Hauer SSP2
- Today (2025)
- 759,460 people
- By 2030
- 757,154 · -0.3%
- By 2040
- 740,644 · -2.5%
- By 2050
- 714,443 · -5.9%
- By 2075
- 645,883 · -15.0%
- By 2100
- 547,084 · -28.0%
Race, ethnicity, and origin ACS 2023
- Neighborhood character
- Diverse neighborhood (Simpson 0.64)
- Race & ethnicity
- White 51% Black 26% Hispanic / Latino 17% Two or more races 8% Asian 3%
- Hispanic origin (detail)
- Puerto Rican 12% Cuban 2%
- Common ancestry
- Romanian 3% Lithuanian 1% Iranian 1%
- Foreign-born
- 10% · Canada, Vietnam, Philippines
- Languages at home
- 79% English-only · Spanish 12% Other Indo-European 3% Other Asian/Pacific 2%
Political lean MEDSL · Monroe
- 2024 margin
- D (+19.1) · D 59.5% · R 40.5%
- 2008→2024 swing
- +1.4pp toward D · 2008: 17.7pp · 2024: 19.1pp
- All cycles
- 2024: D+19.1 2020: D+21.0 2016: D+14.1 2012: D+17.4 2008: D+17.7
Not yet ingested
- Civics
- —
Market trends
- HPI YoY
- ▼ -62.59%
- Current HPI
- 287.6868
- Rent YoY
- ▲ 6.28%
- Metro
- Rochester, NY
- State GDP YoY
- ▲ 2.60%
- F500 in state
- 92
Industry mix (Fortune 500 HQ in NY)
| Industry | F500 HQs | Revenue |
|---|---|---|
| Financial Services | 10 | $950B |
|
||
| Consumer Goods | 9 | $162B |
|
||
| Insurance | 4 | $225B |
|
||
| Telecommunications | 2 | $144B |
|
||
| Pharmaceuticals | 2 | $112B |
|
||
| Media / Entertainment | 2 | $69B |
|
||
Price history
2 events — show timeline
- 2026-04-29 Pending — UNYREIS
- 2026-04-22 Listed $224,900 UNYREIS
Property tax history
+2.6%/yrLatest (2025): $6,058 · -8.4% YoY. Source: county tax records.
Cash-flow waterfall
monthlySold comps — $/sqft
last 12 mo · ≤1 miLoading sold comps…