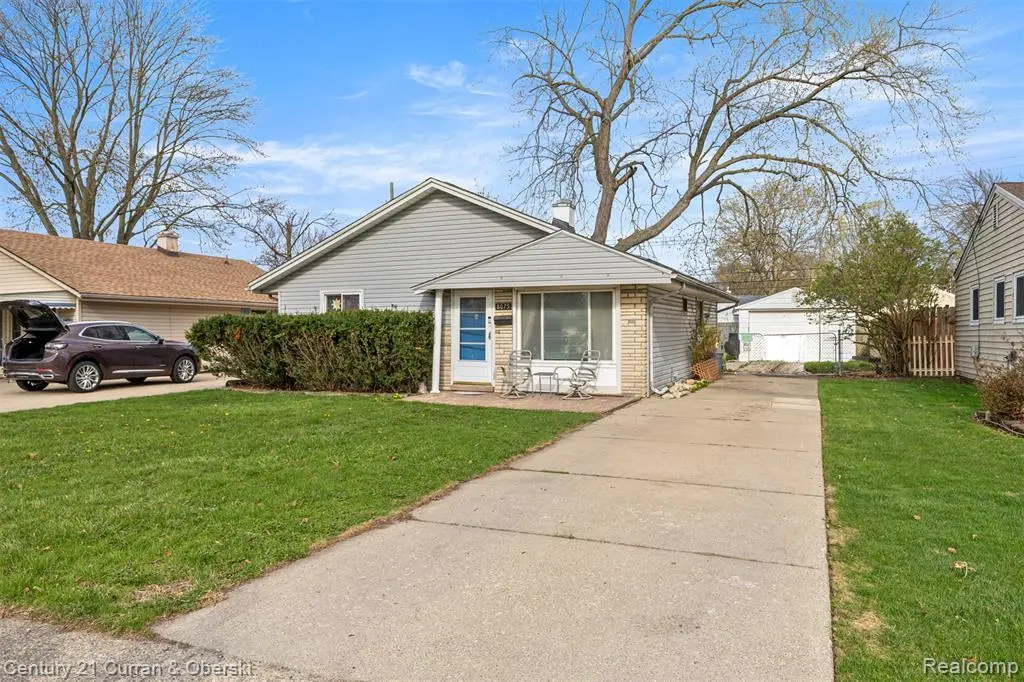
8075 William St · Taylor, MI
Flood risk 1/10 · Minimal
- FEMA flood zone
- X (unshaded)
- Chance of flooding over 30 yrs
- 0.0%
- Est. flood insurance / yr
- $507 – $1,088
Fire risk 1/10 · Minimal
- Est. fire insurance / yr
- $784 – $1,456
Heat risk 3/10 · Minor
- Hot days now (above 97°F)
- 7 days/yr
- Hot days in 30 yrs
- 15 days/yr
Wind risk 2/10 · Minimal
- Chance of severe wind over 30 yrs
- —
Air-quality risk 3/10 · Minor
- Unhealthy air days now
- 3 days/yr
- Unhealthy air days in 30 yrs
- 5 days/yr
Risk factors via First Street. Map © Google.
Why this score? — see what drove the D grade
The composite is a weighted blend of 9 inputs, each scored 0–100. Each bar is that input's sub-score; the figure is the points it added to the 100-point composite (weight × sub-score).
- Cash flow +15.4/30.0
- DSCR +4.7/10.0
- ARV discount +4.7/15.0
- 1% rule +4.3/10.0
- Livability +3.8/5.0
- Rent growth +3.7/5.0
- Condition / age +2.5/5.0
- Schools +1.8/10.0
- Appreciation +0.0/10.0
$165,000
🖨 Deal sheet 📄 Offer letter ✓ Due diligence
Listing remarks MLS
~Welcome Home ~ Brick and vinyl ranch with everything on one level, no stairs to climb here! Open concept into the living room and spacious eat-in kitchen. Big ticket items have been done!! The roof was completely redone with new wood and shingles in 2023! BRAND NEW FURNACE 2026! Come with a few finishing touches and enjoy this lovely home! Fenced in yard with a HUGE shed for extra storage. Convenient location close to shopping, grocery stores, restaurants, 1-94 and 1-75 freeways. Seller providing the Certificate of Occupancy~
Key facts
- 6,098 sq ft lot
- Garage
- Built 1954
Neighborhood map
What this means for you Summary
Snapshot
- This is a 3-bed/1.0-bath single-family listed at $165k.
Deal economics
- At list price, monthly cash flow is $63 ($752/yr) — positive.
- The deal already cash-flows at list — no discount required.
- To meet the 1% rule (rent ≥ 1% of price), the offer needs to be $153k (7.4% below list).
- Recommended offer: $153k (7.4% below list) — sets the bar for 1% rule.
- Cap rate 6.7% vs local median 5.4% in Taylor — meaningfully above typical; check what's discounted (condition, days-on-market, listing class) to confirm the premium yield is real.
Location & tenants
- Location reads 76/100 on livability (#144 in MI, #3,684 nationally) — a middle-class / working-renter tenant base. Strengths: commute A+, cost of living A+, housing A+; Watch: employment D+, schools F, crime F.
- Taylor School District (urban): math 14% / reading 27% proficiency, ranked #462 of 540 in MI (top 86%) — low school quality limits family demand, transient renter base, plan for 1-2y turnover; 68% free/reduced lunch — lower-income household profile, screen leases tightly.
- Market conditions: Rents rising fast (+4.9%/yr); 281 active listings in the ZIP; 6 comparable units currently listed for rent nearby; rentals leasing fast (median 12d on market — plan ~1-2 weeks tenant-placement turnaround); 2,639 units permitted in Wayne County in 2024 (1,216 in 5+ unit buildings).
- This rent runs 30% of the median local income ($61k/yr) — at the standard rent-burdened threshold; future hikes will face affordability resistance.
Forward outlook
- Local home prices are declining (-3.0%/yr); year-one equity from $1k of loan paydown is wiped out by about $5k of value loss. Plan a longer hold.
- Wayne County population projected at -17% by 2050 — secular population decline; favor cash flow + early exit over multi-decade hold.
Negotiation context
- It's been on market 52 days — a 3% lower offer ($160k) is reasonable based on typical stale-listing flexibility.
- 7 sale attempts since 23y ago with the ask held roughly flat each time — persistent listings suggest the price (not the market) is what's stuck; bring a comps-based counter.
- Current owner paid $119k; 39% above their basis — modest negotiation headroom, anchor on the comps not their cost.
Risks & watch-outs
- Watch-outs: built in 1954 — expect roof / HVAC / electrical / plumbing capex.
Questions for the listing agent
- It's been on market 52 days. Have you received any prior offers? Is the seller open to a 7% concession, seller financing, or rate buy-down credit?
- Built in 1954 — when were the roof, HVAC, electrical panel, plumbing, and water heater last replaced?
- Is there a deadline driving the sale (1031 exchange, divorce, estate, relocation)? That informs how much negotiation room exists.
- Schools are F-rated, which usually means shorter tenancies and higher turnover. Who's the typical renter profile here, and what's been the actual vacancy rate?
- Crime grade is F in this area — have there been break-ins, vandalism, or insurance claims at this property in the last 3 years? What carrier currently insures it and at what premium?
- The area grade is low — what's the realistic commute time and amenity access for the typical tenant pool here? Any planned neighborhood developments (good or bad) we should know about?
- What's the average days-on-market for RENTAL listings here right now (not sales)? A rising rental-DOM trend means longer vacancies and softer asking-rent achievability than the comps imply.
- What's the recent tenant-quality profile in this submarket — average credit score on applications, eviction rate, late-payment / NSF rate, and stable-employment percentage? A property-management company in the area should have these aggregated.
- How much new for-sale + rental construction is in the pipeline within 1–3 miles? Heavy new supply typically softens prices + rents 12–24 months out; constrained supply supports both.
Investment metrics
- 1% rule
- 0.93% ✗
- Cap rate
- 6.75%
- Cash-on-cash
- 1.63%
- DSCR
- 1.07
- GRM
- 9.0
CMA / ARV
- ARV (median comp)
- $155,475
- List price
- $165,000
- Delta
- 6.13%
- Verdict
- FAIR
- Comps
- 20 within 1.0 mi
Show comp detail 12 sales within ~0.75 mi
| Address | Dist | Beds/Ba | Sqft | Sold | Price | $/sf | Match |
|---|---|---|---|---|---|---|---|
| 7866 Dudley St | 0.16mi | 3/1.0 | 957 (0%) | 5mo | $172,900 | $181 | 89 |
| 8019 Roosevelt St | 0.25mi | 3/1.0 | 957 (0%) | 3mo | $175,100 | $183 | 86 |
| 7235 Mortenview Dr | 0.39mi | 3/1.0 | 946 (-1%) | 4mo | $169,900 | $180 | 77 |
| 8003 Roosevelt St | 0.26mi | 3/1.0 | 1,029 (+8%) | 1mo | $195,000 | $190 | 75 |
| 22324 Wohlfeil St | 0.43mi | 2/2.0 (-1) | 948 (-1%) | 5mo | $190,000 | $200 | 66 |
| 6731 Harding St | 0.62mi | 3/1.0 | 1,001 (+5%) | 5mo | $184,000 | $184 | 59 |
| 8910 Mason St | 0.43mi | 3/1.0 | 1,053 (+10%) | 5mo | $145,000 | $138 | 59 |
| 20548 Lockwood St | 0.53mi | 3/1.0 | 1,053 (+10%) | 3mo | $135,000 | $128 | 56 |
| 7713 Jackson St | 0.69mi | 3/1.0 | 1,023 (+7%) | 5mo | $174,000 | $170 | 52 |
| 21144 Pinecrest St | 0.61mi | 3/1.0 | 1,074 (+12%) | 1mo | $135,000 | $126 | 51 |
| 7855 Weddel St | 0.61mi | 3/1.5 | 850 (-11%) | 1mo | $213,500 | $251 | 50 |
| 20812 Wick Rd | 0.63mi | 3/1.0 | 1,100 (+15%) | 3mo | $155,000 | $141 | 43 |
Match score weights: distance 35% · size 25% · config 20% · recency 20%. Top-matched comps best support the ARV.
Projected returns pro-forma
-3.0% appreciation · 4.9% rent growth · sell at horizon
- IRR
- -11.6%
- Equity multiple
- 0.57×
- Total profit
- $-19,744
- Equity at exit
- $24,602
- IRR
- 0.2%
- Equity multiple
- 1.02×
- Total profit
- $748
- Equity at exit
- $14,266
Cash invested: $46,200 (down + closing). Projections, not guarantees.
Landlord ↔ Tenant lean methodology
- Overall (STATE)
- 62 Landlord-Friendly
- State Michigan
- 62 Landlord-Friendly · EVEN
- County
- — inherits STATE
- City
- — inherits STATE
ZIP-level market 48180
- Rents YoY
- 4.9%
- Active inventory
- 281
- Price-to-rent
- 9.0×
Monthly cashflow live
- Estimated rent
- $1,528 high interval (Pro) →
- Mortgage (P&I)
- −$865
- Tax from tax record
- −$210 /mo · $2,524/yr
- Insurance
- −$69
- HOA
- −$0
- Vacancy / Maint / Mgmt
- −$321
- Net cashflow
- $63
Break-even live
UW: 25.0% down · 7.5% · 30yr · 1.5% tax · 5.0% vac · 8.0% maint · 8.0% mgmt
Financing live
Cash to close
- Down payment
- $41,250
- Closing costs
- $4,950
- Reserves months
- —
- Total cash needed
- —
Loan-product check · same deal, 3 products live
Conventional
25% down · 7.5% · 30yr
- Down + closing
- —
- Monthly P&I
- —
- Monthly cashflow
- —
- DSCR
- —
- Eligible?
- —
Personal DTI + credit; lowest rate.
DSCR
20% down · 8.5% · 30yr
- Down + closing
- —
- Monthly P&I
- —
- Monthly cashflow
- —
- DSCR
- —
- Eligible?
- —
No personal income docs; deal must DSCR.
Hard money
10% down · 12.0% · 12mo
- Down + closing
- —
- Monthly P&I
- —
- Monthly cashflow
- —
- DSCR
- —
- Eligible?
- —
Short-term bridge; refi at stabilization.
Rent comps 6 comps
| Address | Beds | Baths | Sqft | Rent | $/sqft | DOM | Units | Dist |
|---|---|---|---|---|---|---|---|---|
| 7873 Syracuse St Taylor, MI | 2.0 | 1.0 | 728 | $1,400 | $1.92 | 43d | 1 | 1.02mi |
| 9620 Elm St Taylor, MI | 2.0 | 1.0 | 800 | $1,470 | $1.84 | 1d | 3 | 1.21mi |
| 9918 Allen Pointe Dr Allen Park, MI | 1.0–2.0 | 1.0–2.0 | 678 | $1,125 | $1.66 | 12d | 1 | 1.26mi |
| 10019 Allen Pointe Dr Allen Park, MI | 2.0 | 1.5 | 796 | $1,055 | $1.33 | 12d | 1 | 1.34mi |
| 24268 Haskell St Taylor, MI | 1.0–2.0 | 1.0 | 880 | $1,565 | $1.78 | 1d | 8 | 1.42mi |
| 9725 Ruth Allen Park, MI | 3.0 | 1.5 | 1110 | $1,800 | $1.62 | 2d | 1 | 1.50mi |
Listing history 28 events
-
2026-06-15statusdays on market $165,000 Pending 52 DOM
-
2026-06-13days on market $165,000 Active 51 DOM
-
2026-06-13days on market $165,000 Active 50 DOM
-
2026-06-09days on market $165,000 Active 47 DOM
-
2026-06-08days on market $165,000 Active 46 DOM
-
2026-06-07days on market $165,000 Active 45 DOM
-
2026-06-04days on market $165,000 Active 42 DOM
-
2026-06-03days on market $165,000 Active 41 DOM
-
2026-06-02days on market $165,000 Active 40 DOM
-
2026-06-01days on market $165,000 Active 39 DOM
-
2026-05-31days on market $165,000 Active 38 DOM
-
2026-04-24$165,000 Active 532-char remark
Show marketing remark (532 chars)
~Welcome Home ~ Brick and vinyl ranch with everything on one level, no stairs to climb here! Open concept into the living room and spacious eat-in kitchen. Big ticket items have been done!! The roof was completely redone with new wood and shingles in 2023! BRAND NEW FURNACE 2026! Come with a few finishing touches and enjoy this lovely home! Fenced in yard with a HUGE shed for extra storage. Convenient location close to shopping, grocery stores, restaurants, 1-94 and 1-75 freeways. Seller providing the Certificate of Occupancy~
-
2026-04-19historical $165,000 532-char remark
Show marketing remark (532 chars)
~Welcome Home ~ Brick and vinyl ranch with everything on one level, no stairs to climb here! Open concept into the living room and spacious eat-in kitchen. Big ticket items have been done!! The roof was completely redone with new wood and shingles in 2023! BRAND NEW FURNACE 2026! Come with a few finishing touches and enjoy this lovely home! Fenced in yard with a HUGE shed for extra storage. Convenient location close to shopping, grocery stores, restaurants, 1-94 and 1-75 freeways. Seller providing the Certificate of Occupancy~
-
2021-06-23soldstatus $119,000 Sold
-
2021-06-23soldstatus $119,000 Closed
-
2021-04-23status Pending
-
2021-04-23status Pending
-
2021-04-16historical Accepting Backup Offers
-
2021-04-16historical Accepting Backup Offers
-
2021-04-09$109,900 Active
-
2021-04-09$109,900 Active
-
2003-11-09historical
-
2003-11-01historical
-
2003-07-12$108,900
-
2003-07-09$108,900
-
2003-07-09$108,900
-
1998-02-16soldstatus $72,900
ⓘ Source: listings_history table (triggers on properties + properties_extension) + one-shot
backfill from property_details.listing_events for pre-trigger history.
Tax reassessment forecast MI · Partial reset (capped growth)
- Current annual tax
- $2,524 · $210/mo
- Projected year-2 tax
- $2,532 · $211/mo
- Expected delta
- +$9/yr (+$1/mo · 0.3%)
ⓘ Screening estimate from a state-policy table — verify with the county assessor before closing.
Climate risk First Street
- Flood 1/10 Low FEMA zone X (unshaded) · 0% chance over 30 yrs
- Wildfire 1/10 Low
- Heat 3/10 Moderate 7 d/yr ≥97°F today · 15 d/yr by 30 yrs out
- Wind 2/10 Low
- Air quality 3/10 Moderate 3 unhealthy d/yr today · 5 by 30 yrs out
Nearby sold comps map
Loading sold comps map…
Walkable amenities ~0.75 mi
Loading nearby amenities…
Taxation est. · year 1
- Rental income
- $18,335
- − Mortgage interest
- −$9,243
- − Property taxes
- −$2,524
- − Insurance
- −$825
- − Repairs & maintenance
- −$1,467
- − Management
- −$1,467
- − Depreciation
- −$4,800
- Taxable loss
- −$1,990
- Est. tax savings @ 24.0%
- +$478
- After-tax cash flow
- $1,230/yr
For passive investors: Depreciation is non-cash, so a rental often shows a tax loss while cash-flowing — sheltering income. Rental losses are passive: they offset passive income freely, and up to $25,000/yr can offset ordinary (W-2) income if you actively participate and your MAGI is under $100k (phasing out to $0 by $150k); unused losses carry forward. On sale, claimed depreciation is recaptured at up to 25%, and gains may owe capital-gains tax (a 1031 exchange can defer both). Figures are a year-1 estimate at your 24.0% rate — not tax advice; consult a CPA.
Schools (NCES district)
- District
- Taylor School District
- NCES district ID
- 2633540
- Math proficiency
- 14% ▼ -7.00%
- Reading proficiency
- 27% ▼ -4.00%
- Median HH income
- $43,062
- Composite
- 17.62/100
- National rank
- #9034
- State rank
- #462 of 540 in MI
Livability — Taylor
- Score
- 76/100
- State rank
- #144
- US rank
- #3684
Category grades
Schools grade is shown separately in the Schools card above.
Census & demographics
- Census place
- Taylor, MI
- County
- Wayne County · 1,562,939 people
- City population
- 62,081
- Metro
- Detroit-Warren-Dearborn, MI
- Population (ZIP)
- 62,081
- Household income
- $61,081
- Rent vs Own
- Severe rent burden
- 1957.0
Population outlook (Wayne County) Hauer SSP2
- Today (2025)
- 1,675,273 people
- By 2030
- 1,620,300 · -3.3%
- By 2040
- 1,502,341 · -10.3%
- By 2050
- 1,384,039 · -17.4%
- By 2075
- 1,124,592 · -32.9%
- By 2100
- 881,193 · -47.4%
Race, ethnicity, and origin ACS 2023
- Neighborhood character
- Majority White (65%)
- Race & ethnicity
- White 65% Black 19% Two or more races 9% Hispanic / Latino 9% Asian 2%
- Hispanic origin (detail)
- Mexican 6% Puerto Rican 2%
- Common ancestry
- Romanian 8% Lithuanian 3% Slovak 2%
- Foreign-born
- 7% · Canada
- Languages at home
- 89% English-only · Spanish 4% Arabic 3% Other Indo-European 3%
Political lean MEDSL · Wayne
- 2024 margin
- Strong D (+29.0) · D 62.7% · R 33.7% · Other 3.6%
- 2008→2024 swing
- -20.5pp toward R · 2008: 49.5pp · 2024: 29.0pp
- All cycles
- 2024: D+29.0 2020: D+38.1 2016: D+37.3 2012: D+46.9 2008: D+49.5
Not yet ingested
- Civics
- —
Market trends
- HPI YoY
- ▼ -212.33%
- Current HPI
- 228.921
- Rent YoY
- ▲ 4.90%
- Metro
- Detroit-Warren-Dearborn, MI
- State GDP YoY
- ▲ 1.37%
- F500 in state
- 28
Industry mix (Fortune 500 HQ in MI)
| Industry | F500 HQs | Revenue |
|---|---|---|
| Automotive Parts | 3 | $48B |
|
||
| Automotive | 2 | $372B |
|
||
| Chemicals | 1 | $45B |
|
||
| Automotive Retail | 1 | $29B |
|
||
| Healthcare / Medical Devices | 1 | $23B |
|
||
| Automotive Technology | 1 | $20B |
|
||
Price history
+126.3% since first listed17 events — show timeline
- 2026-04-24 Listed $165,000 MiRealSource-MiMLS
- 2026-04-24 Listed $165,000 REALCOMP
- 2026-04-19 Coming Soon $165,000 MiRealSource-MiMLS
- 2021-06-23 Sold (MLS) $119,000 MiRealSource-MiMLS
- 2021-06-23 Sold (MLS) $119,000 REALCOMP
- 2021-04-23 Pending — MiRealSource-MiMLS
- 2021-04-23 Pending — REALCOMP
- 2021-04-16 Contingent — MiRealSource-MiMLS
- 2021-04-16 Contingent — REALCOMP
- 2021-04-09 Listed $109,900 MiRealSource-MiMLS
- 2021-04-09 Listed $109,900 REALCOMP
- 2003-11-09 Listing Removed — MiRealSource-MiMLS
- 2003-11-01 Listing Removed — REALCOMP
- 2003-07-12 Listed $108,900 REALCOMP
- 2003-07-09 Listed $108,900 REALCOMP
- 2003-07-09 Listed $108,900 MiRealSource-MiMLS
- 1998-02-16 Sold (Public Records) $72,900 Public Records
Property tax history
+4.9%/yrLatest (2025): $2,524 · -11.7% YoY. Source: county tax records.
Cash-flow waterfall
monthlySold comps — $/sqft
last 12 mo · ≤1 miLoading sold comps…