 Duplex
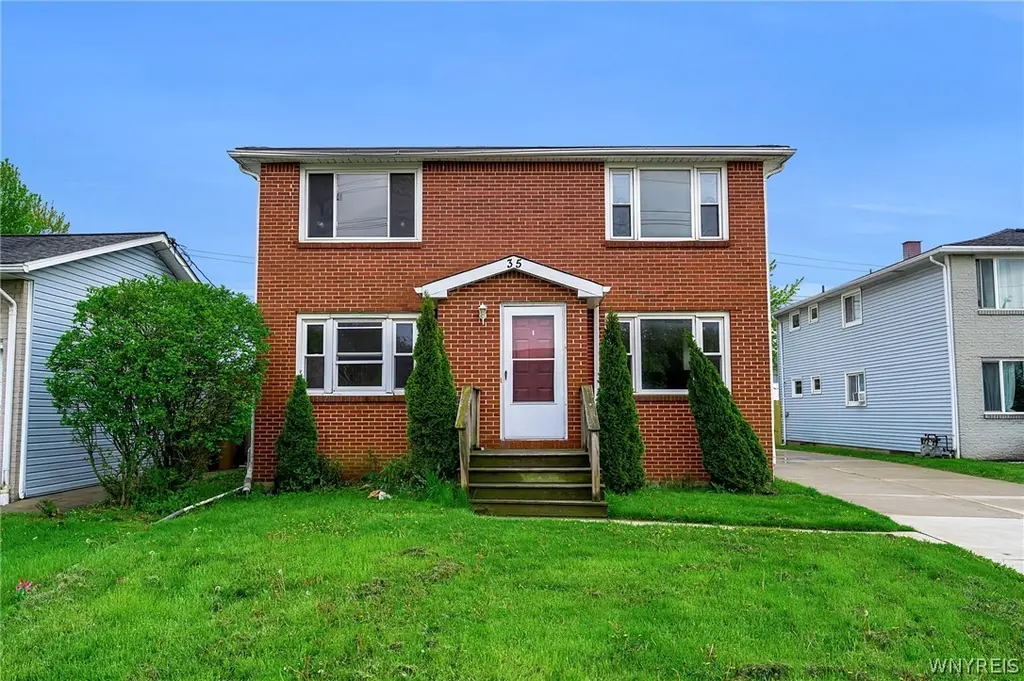
35 Crandon Blvd · Cheektowaga, NY
Flood risk 1/10 · Minimal
- FEMA flood zone
- X (unshaded)
- Chance of flooding over 30 yrs
- 0.0%
- Est. flood insurance / yr
- $473 – $860
Fire risk 1/10 · Minimal
- Est. fire insurance / yr
- $691 – $1,283
Heat risk 3/10 · Minor
- Hot days now (above 94°F)
- 7 days/yr
- Hot days in 30 yrs
- 15 days/yr
Wind risk 1/10 · Minimal
- Chance of severe wind over 30 yrs
- —
Air-quality risk 3/10 · Minor
- Unhealthy air days now
- 2 days/yr
- Unhealthy air days in 30 yrs
- 3 days/yr
Risk factors via First Street. Map © Google.
Why this score? — see what drove the C+ grade
The composite is a weighted blend of 9 inputs, each scored 0–100. Each bar is that input's sub-score; the figure is the points it added to the 100-point composite (weight × sub-score).
- Cash flow +20.2/30.0
- ARV discount +15.0/15.0
- 1% rule +6.5/10.0
- DSCR +6.4/10.0
- Schools +5.9/10.0
- Livability +4.2/5.0
- Rent growth +2.5/5.0
- Condition / age +2.5/5.0
- Appreciation +0.0/10.0
$299,900
🖨 Deal sheet 📄 Offer letter ✓ Due diligence
Multi-family units
County records classify this as Multi-Family (2-4 Unit). Listing-text estimate: 2 units. confirmed
Listing remarks
Located in Town of Cheektowaga, this 2-family home is ideal for both investors and owner-occupants. Offering approximately 2,380 square feet of living space, each unit features 3 bedrooms with spacious layouts and large living areas, providing comfortable, functional space for everyday living. Conveniently situated just minutes from Walden Galleria, Buffalo Niagara International Airport, Wegmans, and a wide variety of restaurants, shopping centers, and everyday amenities, this location offers both accessibility and strong rental appeal. Both units feature hardwood floors throughout, along with updated kitchens and bathrooms, creating a move-in ready feel for tenants or future owners. Major
Key facts
- 2 family home
- Updated windows
- Updated bathrooms
Tags
Property features AI
Finance
- Other: Operating expense details: see remarks
- Financial info: Owner pays trash collection and water; Rent includes trash collection and water; Two-unit multifamily property with separate electric and gas meters for each unit
Exterior
- Parking: Attached garage with concrete driveway; 2-car garage
- Utilities: Public water connected; Sewer connected
- Home design: Two-story building; Existing condition
- Construction: Brick and composite siding exterior; Asphalt roof; Poured foundation; Built (existing structure)
- Exterior features: Rectangular residential lot; City street frontage; Lot dimensions approximately 52 x 130
Interior
- Kitchen: Dishwasher (in both units); Microwave (in one unit); Eat-in kitchen (both units)
- Bedrooms: Two separate 3-bedroom units (each unit has 3 bedrooms)
- Flooring: Hardwood; Luxury vinyl; Varies
- Bathrooms: Each unit includes 1 full bathroom
- Heating & cooling: Gas forced-air heating
- Interior features: Ceiling fan(s)
- Laundry & utility: Gas water heater
Neighborhood map
What this means for you Summary
Snapshot
- This is a 2 × 3-bed/1.0-bath units multifamily listed at $300k.
Deal economics
- At list price, monthly cash flow is $381 ($5k/yr) — positive. Per door: $191/mo.
- The deal already cash-flows at list — no discount required.
- Meets the 1% rule at list price ($3k rent vs $300k).
- Cap rate 7.8% vs local median 3.8% in Cheektowaga — top-decile yield for the area; either an underpriced asset or a hidden risk that comps aren't pricing in. Stress-test before assuming the spread holds.
Location & tenants
- Location reads 84/100 on livability (#54 in NY, #811 nationally) — a professional / high-income tenant draw. Strengths: commute A+, housing A+, health & safety A+; Watch: crime C-.
- Cheektowaga-Maryvale Union Free School District (urban): math 67% / reading 73% proficiency, ranked #154 of 590 in NY (top 26%) — strong family-tenant draw, lease renewals of 3-5y typical.
- Market conditions: 207 active listings in the ZIP; 1 comparable units currently listed for rent nearby; 1,244 units permitted in Erie County in 2024 (563 in 5+ unit buildings).
- At $3,439/mo this rent would consume 61% of the median local household income ($67k/yr) (locally 991% of renters already pay >50% of income on rent) — very limited rent-growth headroom before tenants either downsize or default.
Forward outlook
- Local home prices are declining (-3.0%/yr); year-one equity from $2k of loan paydown is wiped out by about $9k of value loss. Plan a longer hold.
Negotiation context
- Only 7 days on market — expect competitive offers; lowballing is unlikely to land.
- 6 sale attempts since 14y ago with the ask held roughly flat each time — persistent listings suggest the price (not the market) is what's stuck; bring a comps-based counter.
- Current owner paid $168k; list at $300k implies a 79% gain — meaningful room to come down on a strong offer.
Risks & watch-outs
- Watch-outs: property tax is 2.6% of price.
Questions for the listing agent
- Can we see the unit-by-unit rent roll, current vacancy, and any below-market leases? What's the average tenancy length?
- What capital expenditures (roof, boiler, parking lot, exteriors) have been made in the last 5 years, and what's planned in the next 2?
- Built in 1971 — when were the roof, HVAC, electrical panel, plumbing, and water heater last replaced?
- Property tax is high relative to price — has the assessment been appealed recently, and will the sale trigger a re-assessment?
- Is there a deadline driving the sale (1031 exchange, divorce, estate, relocation)? That informs how much negotiation room exists.
- Schools are B-rated — typically a magnet for longer-tenancy family renters. What's the average tenant stay here, and is there a school-zone premium baked into asking?
- What's the average days-on-market for RENTAL listings here right now (not sales)? A rising rental-DOM trend means longer vacancies and softer asking-rent achievability than the comps imply.
- What's the recent tenant-quality profile in this submarket — average credit score on applications, eviction rate, late-payment / NSF rate, and stable-employment percentage? A property-management company in the area should have these aggregated.
- How much new apartment / multifamily construction is in the pipeline within 1–3 miles? Heavy new supply (>2% of stock underway) typically softens rents 12–24 months out; light construction supports rent growth.
Investment metrics
- 1% rule
- 1.15% ✓
- Cap rate
- 7.82%
- Cash-on-cash
- 5.45%
- DSCR
- 1.24
- GRM
- 7.3
CMA / ARV
- ARV (median comp)
- $557,605
- List price
- $299,900
- Delta
- -46.22%
- Verdict
- UNDERPRICED
- Comps
- 20 within 1.0 mi
Show comp detail 8 sales within ~0.75 mi
| Address | Dist | Beds/Ba | Sqft | Sold | Price | $/sf | Match |
|---|---|---|---|---|---|---|---|
| 145 Crandon Blvd | 0.27mi | 6/2.0 | 2,210 (-7%) | 8mo | $335,100 | $152 | 69 |
| 100 Meadowlawn Rd | 0.26mi | 6/3.0 | 2,268 (-5%) | 20mo | $300,000 | $132 | 60 |
| 119 Northcrest Ave | 0.67mi | 5/2.0 (-1) | 2,292 (-4%) | 0mo | $275,000 | $120 | 58 |
| 164 Chapel Ave | 0.57mi | 5/3.0 (-1) | 2,384 (+0%) | 9mo | $310,000 | $130 | 57 |
| 66 Claudette Ct | 0.48mi | 6/2.0 | 2,322 (-2%) | 22mo | $295,000 | $127 | 55 |
| 201 Meadowlawn Rd | 0.40mi | 6/2.0 | 2,187 (-8%) | 17mo | $250,000 | $114 | 54 |
| 2282 George Urban Blvd | 0.70mi | 6/3.0 | 2,268 (-5%) | 6mo | $360,000 | $159 | 50 |
| 10 Surfside Pkwy | 0.45mi | 5/3.0 (-1) | 2,440 (+2%) | 23mo | $380,000 | $156 | 47 |
Match score weights: distance 35% · size 25% · config 20% · recency 20%. Top-matched comps best support the ARV.
Projected returns pro-forma
-3.0% appreciation · 3.0% rent growth · sell at horizon
- IRR
- -7.8%
- Equity multiple
- 0.71×
- Total profit
- $-24,103
- Equity at exit
- $44,716
- IRR
- 1.9%
- Equity multiple
- 1.13×
- Total profit
- $11,144
- Equity at exit
- $25,930
Cash invested: $83,972 (down + closing). Projections, not guarantees.
Landlord ↔ Tenant lean methodology
- Overall (STATE)
- 15 Strongly Tenant-Friendly
- State New York
- 15 Strongly Tenant-Friendly · D+10
- County
- — inherits STATE
- City
- — inherits STATE
ZIP-level market 14225
- Home prices YoY
- -27.3%
- Active inventory
- 207
- Price-to-rent
- 14.5×
Monthly cashflow live
- Estimated rent
- $3,439 medium interval (Pro) →
- Mortgage (P&I)
- −$1,573
- Tax from tax record
- −$638 /mo · $7,655/yr
- Insurance
- −$125
- HOA
- −$0
- Vacancy / Maint / Mgmt
- −$722
- Net cashflow
- $381
Break-even live
2-unit breakdown (identical units grouped — click to expand)
| Units | Beds | Baths | Est. rent |
|---|---|---|---|
| 2× units | 3 | 1 | $3,438 |
| #1 | 3 | 1 | $1,719 |
| #2 | 3 | 1 | $1,719 |
| Total (2 units) | $3,439 | ||
UW: 25.0% down · 7.5% · 30yr · 1.5% tax · 5.0% vac · 8.0% maint · 8.0% mgmt
Financing live
Cash to close
- Down payment
- $74,975
- Closing costs
- $8,997
- Reserves months
- —
- Total cash needed
- —
Loan-product check · same deal, 3 products live
Conventional
25% down · 7.5% · 30yr
- Down + closing
- —
- Monthly P&I
- —
- Monthly cashflow
- —
- DSCR
- —
- Eligible?
- —
Personal DTI + credit; lowest rate.
DSCR
20% down · 8.5% · 30yr
- Down + closing
- —
- Monthly P&I
- —
- Monthly cashflow
- —
- DSCR
- —
- Eligible?
- —
No personal income docs; deal must DSCR.
Hard money
10% down · 12.0% · 12mo
- Down + closing
- —
- Monthly P&I
- —
- Monthly cashflow
- —
- DSCR
- —
- Eligible?
- —
Short-term bridge; refi at stabilization.
Rent comps 1 comps
| Address | Beds | Baths | Sqft | Rent | $/sqft | DOM | Units | Dist |
|---|---|---|---|---|---|---|---|---|
| 758 S Huth Rd Buffalo, NY | 5.0 | 2.0 | 2235 | $2,800 | $1.25 | 44d | 1 | 1.36mi |
Listing history 17 events
-
2026-05-14$299,900 Active 1177-char remark
-
2026-05-05historical
-
2026-04-27price $340,000
-
2026-03-09$359,900 Active
-
2026-01-01historical
-
2025-12-03price $359,000
-
2025-10-22$369,000 Active
-
2020-02-21soldstatus $167,500 Closed Sale or Rented
-
2020-02-21soldstatus $167,500
-
2020-01-13status Under Contract- Do Not Show
-
2020-01-07status Active
-
2020-01-07status Under Contract- Do Not Show
-
2019-12-21price $179,000
-
2019-12-11$182,000 Active
-
2012-09-19soldstatus $105,200
-
2012-09-19soldstatus $105,200
-
2012-06-01$109,900
ⓘ Source: listings_history table (triggers on properties + properties_extension) + one-shot
backfill from property_details.listing_events for pre-trigger history.
Tax reassessment forecast NY · Partial reset (capped growth)
- Current annual tax
- $7,655 · $638/mo
- Projected year-2 tax
- $7,655 · $638/mo
- Expected delta
- $0/yr ($0/mo · 0.0%)
ⓘ Screening estimate from a state-policy table — verify with the county assessor before closing.
Climate risk First Street
- Flood 1/10 Low FEMA zone X (unshaded) · 0% chance over 30 yrs
- Wildfire 1/10 Low
- Heat 3/10 Moderate 7 d/yr ≥94°F today · 15 d/yr by 30 yrs out
- Wind 1/10 Low
- Air quality 3/10 Moderate 2 unhealthy d/yr today · 3 by 30 yrs out
Nearby sold comps map
Loading sold comps map…
Walkable amenities ~0.75 mi
Loading nearby amenities…
Taxation est. · year 1
- Rental income
- $41,268
- − Mortgage interest
- −$16,799
- − Property taxes
- −$7,655
- − Insurance
- −$1,500
- − Repairs & maintenance
- −$3,301
- − Management
- −$3,301
- − Depreciation
- −$8,724
- Taxable loss
- −$13
- Est. tax savings @ 24.0%
- +$3
- After-tax cash flow
- $4,578/yr
For passive investors: Depreciation is non-cash, so a rental often shows a tax loss while cash-flowing — sheltering income. Rental losses are passive: they offset passive income freely, and up to $25,000/yr can offset ordinary (W-2) income if you actively participate and your MAGI is under $100k (phasing out to $0 by $150k); unused losses carry forward. On sale, claimed depreciation is recaptured at up to 25%, and gains may owe capital-gains tax (a 1031 exchange can defer both). Figures are a year-1 estimate at your 24.0% rate — not tax advice; consult a CPA.
Schools (NCES district)
- District
- Cheektowaga-Maryvale Union Free School District
- NCES district ID
- 3618600
- Math proficiency
- 67% ▲ 11.00%
- Reading proficiency
- 73% ▲ 23.00%
- Median HH income
- $46,537
- Composite
- 59.02/100
- National rank
- #960
- State rank
- #154 of 590 in NY
Livability — Cheektowaga
- Score
- 84/100
- State rank
- #54
- US rank
- #811
Category grades
Schools grade is shown separately in the Schools card above.
Census & demographics
- Census place
- Cheektowaga, NY
- County
- Erie County · 714,559 people
- City population
- 55,470
- Metro
- Buffalo-Cheektowaga, NY
- Population (ZIP)
- 33,620
- Household income
- $67,237
- Rent vs Own
- Severe rent burden
- 991.0
Population outlook (Erie County) Hauer SSP2
- Today (2025)
- 933,037 people
- By 2030
- 935,181 · +0.2%
- By 2040
- 928,531 · -0.5%
- By 2050
- 905,725 · -2.9%
- By 2075
- 834,037 · -10.6%
- By 2100
- 708,033 · -24.1%
Race, ethnicity, and origin ACS 2023
- Neighborhood character
- Predominantly White (74%)
- Race & ethnicity
- White 74% Black 13% Two or more races 7% Hispanic / Latino 4% Asian 3%
- Common ancestry
- Romanian 21% Lithuanian 3% Iranian 1%
- Foreign-born
- 6% · Canada, Vietnam
- Languages at home
- 92% English-only · Other Indo-European 2% Spanish 2% Arabic 1%
Political lean MEDSL · Erie
- 2024 margin
- Lean D (+9.7) · D 54.8% · R 45.2%
- 2008→2024 swing
- -7.9pp toward R · 2008: 17.5pp · 2024: 9.7pp
- All cycles
- 2024: D+9.7 2020: D+14.7 2016: D+4.8 2012: D+15.6 2008: D+17.5
Not yet ingested
- Civics
- —
Market trends
- HPI YoY
- ▼ -120.26%
- Current HPI
- 320.6248
- Rent YoY
- —
- Metro
- Buffalo-Cheektowaga, NY
- State GDP YoY
- ▲ 2.60%
- F500 in state
- 92
Industry mix (Fortune 500 HQ in NY)
| Industry | F500 HQs | Revenue |
|---|---|---|
| Financial Services | 10 | $950B |
|
||
| Consumer Goods | 9 | $162B |
|
||
| Insurance | 4 | $225B |
|
||
| Telecommunications | 2 | $144B |
|
||
| Pharmaceuticals | 2 | $112B |
|
||
| Media / Entertainment | 2 | $69B |
|
||
Price history
+172.9% since first listed18 events — show timeline
- 2026-05-21 Pending — WNYREIS
- 2026-05-14 Listed $299,900 WNYREIS
- 2026-05-05 Listing Removed — WNYREIS
- 2026-04-27 Price Changed $340,000 WNYREIS
- 2026-03-09 Listed $359,900 WNYREIS
- 2026-01-01 Listing Removed — WNYREIS
- 2025-12-03 Price Changed $359,000 WNYREIS
- 2025-10-22 Listed $369,000 WNYREIS
- 2020-02-21 Sold (Public Records) $167,500 Public Records
- 2020-02-21 Sold (MLS) $167,500 WNYREIS
- 2020-01-13 Pending — WNYREIS
- 2020-01-07 Relisted — WNYREIS
- 2020-01-07 Pending — WNYREIS
- 2019-12-21 Price Changed $179,000 WNYREIS
- 2019-12-11 Listed $182,000 WNYREIS
- 2012-09-19 Sold (Public Records) $105,200 Public Records
- 2012-09-19 Sold (MLS) $105,200 WNYREIS
- 2012-06-01 Listed $109,900 WNYREIS
Property tax history
+4.1%/yrLatest (2025): $7,655 · +2.0% YoY. Source: county tax records.
Cash-flow waterfall
monthlySold comps — $/sqft
last 12 mo · ≤1 miLoading sold comps…