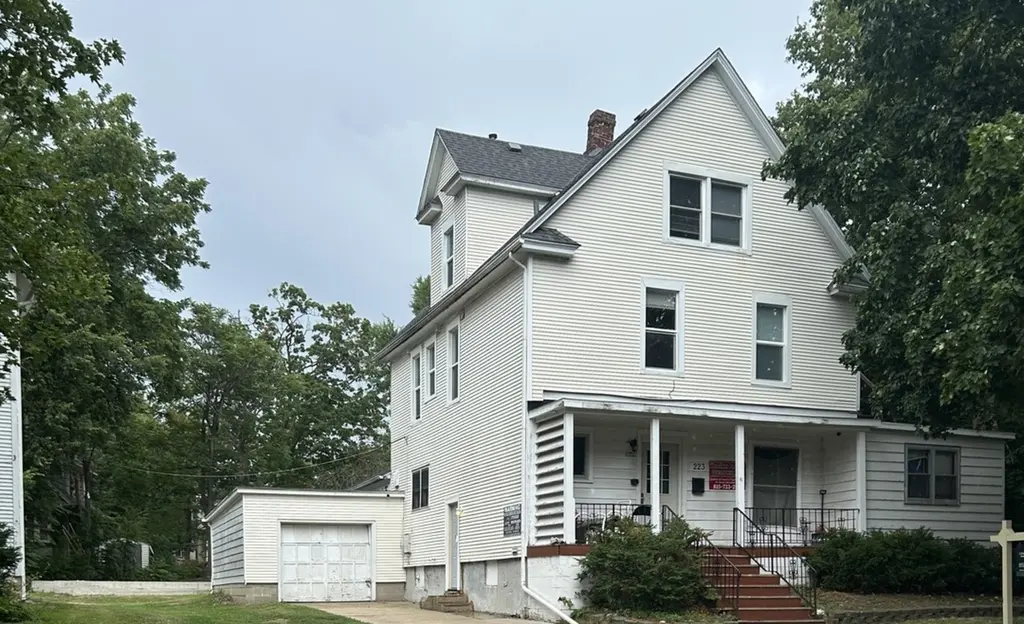
223 W Locust St · DeKalb, IL
Flood risk 1/10 · Minimal
- FEMA flood zone
- X (unshaded)
- Chance of flooding over 30 yrs
- 0.0%
- Est. flood insurance / yr
- $473 – $860
Fire risk 1/10 · Minimal
- Est. fire insurance / yr
- $804 – $1,492
Heat risk 2/10 · Minimal
- Hot days now (above 101°F)
- 7 days/yr
- Hot days in 30 yrs
- 15 days/yr
Wind risk 2/10 · Minimal
- Chance of severe wind over 30 yrs
- —
Air-quality risk 3/10 · Minor
- Unhealthy air days now
- 2 days/yr
- Unhealthy air days in 30 yrs
- 4 days/yr
Risk factors via First Street. Map © Google.
Why this score? — see what drove the D- grade
The composite is a weighted blend of 9 inputs, each scored 0–100. Each bar is that input's sub-score; the figure is the points it added to the 100-point composite (weight × sub-score).
- ARV discount +10.3/15.0
- Cash flow +8.4/30.0
- Rent growth +4.3/5.0
- Livability +3.9/5.0
- 1% rule +3.5/10.0
- Condition / age +2.5/5.0
- DSCR +2.3/10.0
- Schools +1.2/10.0
- Appreciation +0.0/10.0
$265,000
🖨 Deal sheet 📄 Offer letter ✓ Due diligence
Listing remarks MLS
An updated rooming house, in a great location close to NIU and downtown within walking distance or close to public transportation. Newer mechanicals furnaces & central air--windows -- plumbing -- some electrical. 3 updated Kitchens and 5 updated baths. If your investor this is ready for you. The potential for great rental income. Owner has other properties in the area and would consider a package deal. Don't miss this opportunity.
Key facts
- Updated baths
- Great location
- Updated kitchens
Tags
Neighborhood map
What this means for you Summary
Snapshot
- This is a 8-bed/3.0-bath other listed at $265k.
Deal economics
- At list price, monthly cash flow is $-236 ($-3k/yr) — negative.
- To cash-flow at today's rent, offer at most $223k (15.7% below list).
- To meet the 1% rule (rent ≥ 1% of price), the offer needs to be $224k (15.3% below list).
- Recommended offer: $223k (15.7% below list) — sets the bar for cash-flow.
Location & tenants
- Location reads 77/100 on livability (#154 in IL, #2,835 nationally) — a middle-class / working-renter tenant base. Strengths: commute A+, cost of living A+, housing A+; Watch: amenities D+, schools D, crime D-.
- Dekalb CUSD 428 (suburban): math 11% / reading 16% proficiency, ranked #541 of 620 in IL (top 87%) — low school quality limits family demand, transient renter base, plan for 1-2y turnover.
- Market conditions: Rents rising fast (+7.3%/yr); 85 active listings in the ZIP; 1 comparable units currently listed for rent nearby; 260 units permitted in DeKalb County in 2024 (73 in 5+ unit buildings).
- At $2,243/mo this rent would consume 57% of the median local household income ($47k/yr) (locally 3794% of renters already pay >50% of income on rent) — very limited rent-growth headroom before tenants either downsize or default.
Forward outlook
- Local home prices are declining (-3.0%/yr); year-one equity from $2k of loan paydown is wiped out by about $8k of value loss. Plan a longer hold.
- DeKalb County population projected to shrink 5% by 2050 — rents likely to lag national; underwrite the cash flow, not the appreciation.
Negotiation context
- It's been on market 343 days — a 12% lower offer ($233k) is reasonable based on typical stale-listing flexibility.
- 6 sale attempts since 3y ago; this cycle's ask has dropped $30k (10%) from the opening price — seller is motivated, your offer sets the floor, not the list.
Risks & watch-outs
- Watch-outs: built in 1920 — expect roof / HVAC / electrical / plumbing capex.
Questions for the listing agent
- What do current leases actually rent for vs. the listed asking? Can we see a recent rent roll and the last 12 months of T-12 income?
- It's been on market 343 days. Have you received any prior offers? Is the seller open to a 16% concession, seller financing, or rate buy-down credit?
- Built in 1920 — when were the roof, HVAC, electrical panel, plumbing, and water heater last replaced?
- Why hasn't it sold? Are there any deal-killer items the seller is aware of (foundation, flood, title, zoning, code violations)?
- Is there a deadline driving the sale (1031 exchange, divorce, estate, relocation)? That informs how much negotiation room exists.
- Schools are D-rated, which usually means shorter tenancies and higher turnover. Who's the typical renter profile here, and what's been the actual vacancy rate?
- Crime grade is D in this area — have there been break-ins, vandalism, or insurance claims at this property in the last 3 years? What carrier currently insures it and at what premium?
- The area grade is low — what's the realistic commute time and amenity access for the typical tenant pool here? Any planned neighborhood developments (good or bad) we should know about?
- What's the average days-on-market for RENTAL listings here right now (not sales)? A rising rental-DOM trend means longer vacancies and softer asking-rent achievability than the comps imply.
- What's the recent tenant-quality profile in this submarket — average credit score on applications, eviction rate, late-payment / NSF rate, and stable-employment percentage? A property-management company in the area should have these aggregated.
- How much new for-sale + rental construction is in the pipeline within 1–3 miles? Heavy new supply typically softens prices + rents 12–24 months out; constrained supply supports both.
Investment metrics
- 1% rule
- 0.85% ✗
- Cap rate
- 5.22%
- Cash-on-cash
- -3.82%
- DSCR
- 0.83
- GRM
- 9.8
CMA / ARV
- ARV (median comp)
- $282,853
- List price
- $265,000
- Delta
- -6.31%
- Verdict
- FAIR
- Comps
- 5 within 1.0 mi
Projected returns pro-forma
-3.0% appreciation · 7.33% rent growth · sell at horizon
- IRR
- -17.5%
- Equity multiple
- 0.36×
- Total profit
- $-47,641
- Equity at exit
- $39,512
- IRR
- -2.4%
- Equity multiple
- 0.80×
- Total profit
- $-14,504
- Equity at exit
- $22,912
Cash invested: $74,200 (down + closing). Projections, not guarantees.
Landlord ↔ Tenant lean methodology
- Overall (STATE)
- 43 Moderately Tenant-Leaning
- State Illinois
- 43 Moderately Tenant-Leaning · D+7
- County
- — inherits STATE
- City
- — inherits STATE
ZIP-level market 60115
- Home prices YoY
- -31.9%
- Rents YoY
- 7.3%
- Active inventory
- 85
- Price-to-rent
- 9.8×
Monthly cashflow live
- Estimated rent
- $2,243 medium interval (Pro) →
- Mortgage (P&I)
- −$1,390
- Tax from tax record
- −$508 /mo · $6,099/yr
- Insurance
- −$110
- HOA
- −$0
- Vacancy / Maint / Mgmt
- −$471
- Net cashflow
- $-236
Break-even live
UW: 25.0% down · 7.5% · 30yr · 1.5% tax · 5.0% vac · 8.0% maint · 8.0% mgmt
Financing live
Cash to close
- Down payment
- $66,250
- Closing costs
- $7,950
- Reserves months
- —
- Total cash needed
- —
Loan-product check · same deal, 3 products live
Conventional
25% down · 7.5% · 30yr
- Down + closing
- —
- Monthly P&I
- —
- Monthly cashflow
- —
- DSCR
- —
- Eligible?
- —
Personal DTI + credit; lowest rate.
DSCR
20% down · 8.5% · 30yr
- Down + closing
- —
- Monthly P&I
- —
- Monthly cashflow
- —
- DSCR
- —
- Eligible?
- —
No personal income docs; deal must DSCR.
Hard money
10% down · 12.0% · 12mo
- Down + closing
- —
- Monthly P&I
- —
- Monthly cashflow
- —
- DSCR
- —
- Eligible?
- —
Short-term bridge; refi at stabilization.
Rent comps 1 comps
| Address | Beds | Baths | Sqft | Rent | $/sqft | DOM | Units | Dist |
|---|---|---|---|---|---|---|---|---|
| 801 Lucinda Ave DeKalb, IL | 2.0–8.0 | 1.0–2.5 | — | $2,100 | — | 1d | 36 | 0.67mi |
Listing history 33 events
-
2026-06-18days on market $265,000 Active 343 DOM
-
2026-06-17days on market $265,000 Active 342 DOM
-
2026-06-16days on market $265,000 Active 341 DOM
-
2026-06-15days on market $265,000 Active 340 DOM
-
2026-06-13days on market $265,000 Active 338 DOM
-
2026-06-13days on market $265,000 Active 337 DOM
-
2026-06-09days on market $265,000 Active 334 DOM
-
2026-06-08days on market $265,000 Active 333 DOM
-
2026-06-07days on market $265,000 Active 332 DOM
-
2026-06-04days on market $265,000 Active 329 DOM
-
2026-06-03days on market $265,000 Active 328 DOM
-
2026-06-02days on market $265,000 Active 327 DOM
-
2026-06-01days on market $265,000 Active 326 DOM
-
2026-05-31days on market $265,000 Active 325 DOM
-
2026-01-12status Active 442-char remark
Show marketing remark (442 chars)
An updated rooming house, in a great location close to NIU and downtown within walking distance or close to public transportation. Newer mechanicals furnaces & central air--windows -- plumbing -- some electrical. 3 updated Kitchens and 5 updated baths. If your investor this is ready for you. The potential for great rental income. Owner has other properties in the area and would consider a package deal. Don't miss this opportunity.
-
2026-01-10historical 442-char remark
Show marketing remark (442 chars)
An updated rooming house, in a great location close to NIU and downtown within walking distance or close to public transportation. Newer mechanicals furnaces & central air--windows -- plumbing -- some electrical. 3 updated Kitchens and 5 updated baths. If your investor this is ready for you. The potential for great rental income. Owner has other properties in the area and would consider a package deal. Don't miss this opportunity.
-
2026-01-06status Active 442-char remark
Show marketing remark (442 chars)
An updated rooming house, in a great location close to NIU and downtown within walking distance or close to public transportation. Newer mechanicals furnaces & central air--windows -- plumbing -- some electrical. 3 updated Kitchens and 5 updated baths. If your investor this is ready for you. The potential for great rental income. Owner has other properties in the area and would consider a package deal. Don't miss this opportunity.
-
2025-12-30historical 442-char remark
Show marketing remark (442 chars)
An updated rooming house, in a great location close to NIU and downtown within walking distance or close to public transportation. Newer mechanicals furnaces & central air--windows -- plumbing -- some electrical. 3 updated Kitchens and 5 updated baths. If your investor this is ready for you. The potential for great rental income. Owner has other properties in the area and would consider a package deal. Don't miss this opportunity.
-
2025-09-20price $265,000 442-char remark
Show marketing remark (442 chars)
An updated rooming house, in a great location close to NIU and downtown within walking distance or close to public transportation. Newer mechanicals furnaces & central air--windows -- plumbing -- some electrical. 3 updated Kitchens and 5 updated baths. If your investor this is ready for you. The potential for great rental income. Owner has other properties in the area and would consider a package deal. Don't miss this opportunity.
-
2025-06-30$295,000 Active 442-char remark
Show marketing remark (442 chars)
An updated rooming house, in a great location close to NIU and downtown within walking distance or close to public transportation. Newer mechanicals furnaces & central air--windows -- plumbing -- some electrical. 3 updated Kitchens and 5 updated baths. If your investor this is ready for you. The potential for great rental income. Owner has other properties in the area and would consider a package deal. Don't miss this opportunity.
-
2024-10-23historical
-
2024-09-18price
-
2024-07-28price
-
2024-05-30status Active
-
2024-03-08price
-
2024-03-08historical Contingent - Continue to Show
-
2023-12-29historical $850
-
2023-12-13$850
-
2023-10-04Active
-
2015-05-11soldstatus $400,000
-
2006-11-20soldstatus $232,000
-
2006-11-20soldstatus $232,000
-
2005-02-03soldstatus $138,000
ⓘ Source: listings_history table (triggers on properties + properties_extension) + one-shot
backfill from property_details.listing_events for pre-trigger history.
Tax reassessment forecast IL · Partial reset (capped growth)
- Current annual tax
- $6,099 · $508/mo
- Projected year-2 tax
- $6,099 · $508/mo
- Expected delta
- $0/yr ($0/mo · 0.0%)
ⓘ Screening estimate from a state-policy table — verify with the county assessor before closing.
Climate risk First Street
- Flood 1/10 Low FEMA zone X (unshaded) · 0% chance over 30 yrs
- Wildfire 1/10 Low
- Heat 2/10 Low 7 d/yr ≥101°F today · 15 d/yr by 30 yrs out
- Wind 2/10 Low
- Air quality 3/10 Moderate 2 unhealthy d/yr today · 4 by 30 yrs out
Nearby sold comps map
Loading sold comps map…
Walkable amenities ~0.75 mi
Loading nearby amenities…
Taxation est. · year 1
- Rental income
- $26,919
- − Mortgage interest
- −$14,844
- − Property taxes
- −$6,099
- − Insurance
- −$1,325
- − Repairs & maintenance
- −$2,154
- − Management
- −$2,154
- − Depreciation
- −$7,709
- Taxable loss
- −$7,365
- Est. tax savings @ 24.0%
- +$1,768
- After-tax cash flow
- $-1,066/yr
For passive investors: Depreciation is non-cash, so a rental often shows a tax loss while cash-flowing — sheltering income. Rental losses are passive: they offset passive income freely, and up to $25,000/yr can offset ordinary (W-2) income if you actively participate and your MAGI is under $100k (phasing out to $0 by $150k); unused losses carry forward. On sale, claimed depreciation is recaptured at up to 25%, and gains may owe capital-gains tax (a 1031 exchange can defer both). Figures are a year-1 estimate at your 24.0% rate — not tax advice; consult a CPA.
Schools (NCES district)
- District
- Dekalb CUSD 428
- NCES district ID
- 1712000
- Math proficiency
- 11% ▼ -9.00%
- Reading proficiency
- 16% ▼ -6.00%
- Median HH income
- $42,007
- Composite
- 11.74/100
- National rank
- #9685
- State rank
- #541 of 620 in IL
Livability — DeKalb
- Score
- 77/100
- State rank
- #154
- US rank
- #2835
Category grades
Schools grade is shown separately in the Schools card above.
Census & demographics
- Census place
- DeKalb, IL
- County
- DeKalb County · 64,760 people
- City population
- 42,536
- Metro
- Chicago-Naperville-Elgin, IL-IN-WI
- Population (ZIP)
- 42,536
- Household income
- $47,043
- Rent vs Own
- Severe rent burden
- 3794.0
Population outlook (DeKalb County) Hauer SSP2
- Today (2025)
- 104,983 people
- By 2030
- 104,428 · -0.5%
- By 2040
- 102,199 · -2.7%
- By 2050
- 99,303 · -5.4%
- By 2075
- 93,978 · -10.5%
- By 2100
- 88,527 · -15.7%
Race, ethnicity, and origin ACS 2023
- Neighborhood character
- Diverse neighborhood (Simpson 0.61)
- Race & ethnicity
- White 58% Hispanic / Latino 18% Black 15% Two or more races 12% Asian 4%
- Hispanic origin (detail)
- Mexican 14% Puerto Rican 2%
- Common ancestry
- Romanian 5% Portuguese 3% Lithuanian 2%
- Foreign-born
- 9% · Canada, China
- Languages at home
- 82% English-only · Spanish 10% Arabic 2% Other Indo-European 2%
Political lean MEDSL · DeKalb
- 2024 margin
- Toss-up / Even · D 50.1% · R 48.1% · Other 1.7%
- 2008→2024 swing
- -14.8pp toward R · 2008: 16.8pp · 2024: 2.0pp
- All cycles
- 2024: D+2.0 2020: D+5.7 2016: D+3.0 2012: D+5.5 2008: D+16.8
Not yet ingested
- Civics
- —
Market trends
- HPI YoY
- ▼ -89.56%
- Current HPI
- 191.1189
- Rent YoY
- ▲ 7.33%
- Metro
- Chicago-Naperville-Elgin, IL-IN-WI
- State GDP YoY
- ▲ 1.59%
- F500 in state
- 60
Industry mix (Fortune 500 HQ in IL)
| Industry | F500 HQs | Revenue |
|---|---|---|
| Insurance | 4 | $201B |
|
||
| Consumer Goods | 4 | $87B |
|
||
| Industrial Machinery | 3 | $64B |
|
||
| Healthcare | 2 | $55B |
|
||
| Retail / Pharmacy | 1 | $148B |
|
||
| Agriculture / Food | 1 | $86B |
|
||
Price history
+92.0% since first listed19 events — show timeline
- 2026-01-12 Relisted — MRED as Distributed by MLS Grid
- 2026-01-10 Listing Removed — MRED as Distributed by MLS Grid
- 2026-01-06 Relisted — MRED as Distributed by MLS Grid
- 2025-12-30 Listing Removed — MRED as Distributed by MLS Grid
- 2025-09-20 Price Changed $265,000 MRED as Distributed by MLS Grid
- 2025-06-30 Listed $295,000 MRED as Distributed by MLS Grid
- 2024-10-23 Listing Removed — MRED as Distributed by MLS Grid
- 2024-09-18 Price Changed — MRED as Distributed by MLS Grid
- 2024-07-28 Price Changed — MRED as Distributed by MLS Grid
- 2024-05-30 Relisted — MRED as Distributed by MLS Grid
- 2024-03-08 Price Changed — MRED as Distributed by MLS Grid
- 2024-03-08 Contingent — MRED as Distributed by MLS Grid
- 2023-12-29 Rental Removed $850 APPFOLIO
- 2023-12-13 Listed for Rent $850 APPFOLIO
- 2023-10-04 Listed — MRED as Distributed by MLS Grid
- 2015-05-11 Sold (Public Records) $400,000 Public Records
- 2006-11-20 Sold (Public Records) $232,000 Public Records
- 2006-11-20 Sold (Public Records) $232,000 Public Records
- 2005-02-03 Sold (Public Records) $138,000 Public Records
Property tax history
+1.6%/yrLatest (2025): $6,099 · +8.6% YoY. Source: county tax records.
Cash-flow waterfall
monthlySold comps — $/sqft
last 12 mo · ≤1 miLoading sold comps…