 Triplex
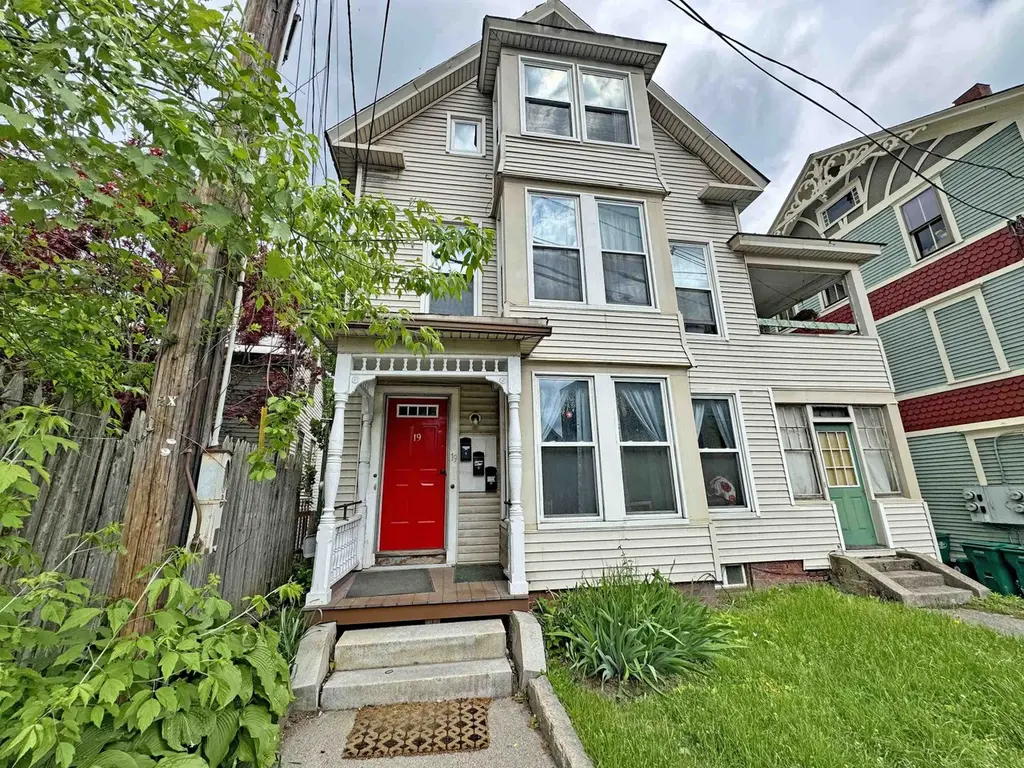
19 Canal St · Brattleboro, VT
Flood risk 1/10 · Minimal
- FEMA flood zone
- X (unshaded)
- Chance of flooding over 30 yrs
- 0.0%
- Est. flood insurance / yr
- $473 – $860
Fire risk 1/10 · Minimal
- Est. fire insurance / yr
- $480 – $892
Heat risk 3/10 · Minor
- Hot days now (above 94°F)
- 8 days/yr
- Hot days in 30 yrs
- 19 days/yr
Wind risk 4/10 · Minor
- Chance of severe wind over 30 yrs
- 11.0%
Air-quality risk 2/10 · Minimal
- Unhealthy air days now
- 0 days/yr
- Unhealthy air days in 30 yrs
- 1 days/yr
Risk factors via First Street. Map © Google.
Why this score? — see what drove the B- grade
The composite is a weighted blend of 9 inputs, each scored 0–100. Each bar is that input's sub-score; the figure is the points it added to the 100-point composite (weight × sub-score).
- Cash flow +30.0/30.0
- DSCR +10.0/10.0
- 1% rule +8.6/10.0
- ARV discount +7.5/15.0
- Schools +5.0/10.0
- Livability +3.4/5.0
- Rent growth +2.5/5.0
- Condition / age +2.5/5.0
- Appreciation +0.0/10.0
$399,000
🖨 Deal sheet (PDF) 📄 Offer letter ✓ Due diligence
Multi-family units
County records classify this as Multi-Family (2-4 Unit). Listing-text estimate: 3 units. confirmed
Listing remarks MLS
CHECK OUT THIS GOOD INCOME PRODUCTING PROPERTY WITH DOWN TOWN CONVENIENCE. THIS PROPERTY MAKES A GREAT OPPORTUNTIY FOR SOMEONE LOOKING TO OWN MULTI-FAMILY PROPERTIES.
Key facts
- Investment property
- Newer windows
- Vinyl siding
Tags
Property features AI
Finance
- Other: Operating expenses include insurance, maintenance, utilities, and water/sewer
- Financial info: Reported net income: $28,702
Exterior
- Parking: No driveway
- Utilities: Public water; Public sewer; Cable available; High-speed internet available on site
- Home design: Multi-family building; Existing property
- Construction: Built in 1900; Vinyl siding; Slate roof; 200 amp electrical service
- Exterior features: Located in town; Paved road frontage (approx. 40' of frontage); Beige exterior
Interior
- Bedrooms: One unit with 4 bedrooms; One unit with 3 bedrooms; One unit with 2 bedrooms
- Bathrooms: Each unit has 1 bathroom
- Heating & cooling: Oil heating; No central cooling
- Interior features: Full basement with interior access
Neighborhood map
What this means for you Summary
Snapshot
- This is a 3 × 1-bed/1-bath units multifamily listed at $399k.
Deal economics
- At list price, monthly cash flow is $2k ($21k/yr) — positive. Per door: $572/mo.
- The deal already cash-flows at list — no discount required.
- Meets the 1% rule at list price ($5k rent vs $399k).
- Recommended offer: $387k (3.0% below list) — sets the bar for market timing.
- Cap rate 11.5% vs local median 4.7% in Brattleboro — top-decile yield for the area; either an underpriced asset or a hidden risk that comps aren't pricing in. Stress-test before assuming the spread holds.
Location & tenants
- Location reads 67/100 on livability (#42 in VT) — a middle-class / working-renter tenant base. Strengths: health & safety A+, cost of living B; Watch: crime F, amenities D-, commute F.
- Zoned schools: Brattleboro Area Middle School (math 28% / reading 53%, grade F, #13 of 26 statewide, top 52%, 262 students, 38% FRL).
- Market conditions: 80 active listings in the ZIP; 188 units permitted in Windham County in 2024 (0 in 5+ unit buildings).
- At $5,411/mo this rent would consume 99% of the median local household income ($66k/yr) (locally 594% of renters already pay >50% of income on rent) — very limited rent-growth headroom before tenants either downsize or default.
Forward outlook
- Local home prices are declining (-3.0%/yr); year-one equity from $3k of loan paydown is wiped out by about $12k of value loss. Plan a longer hold.
- Windham County population projected at -26% by 2050 — secular population decline; favor cash flow + early exit over multi-decade hold.
- At projected returns (-3.0% appreciation + 3.0% rent growth), your $112k cash investment doubles in ~7 years — after that, you're playing with house money.
Negotiation context
- It's been on market 31 days — a 3% lower offer ($387k) is reasonable based on typical stale-listing flexibility.
- 2 sale attempts since 22y ago with the ask held roughly flat each time — persistent listings suggest the price (not the market) is what's stuck; bring a comps-based counter.
- Current owner paid $100k; list at $399k implies a 299% gain — meaningful room to come down on a strong offer.
Risks & watch-outs
- Watch-outs: built in 1900 — expect roof / HVAC / electrical / plumbing capex.
Questions for the listing agent
- It's been on market 31 days. Have you received any prior offers? Is the seller open to a 3% concession, seller financing, or rate buy-down credit?
- Can we see the unit-by-unit rent roll, current vacancy, and any below-market leases? What's the average tenancy length?
- What capital expenditures (roof, boiler, parking lot, exteriors) have been made in the last 5 years, and what's planned in the next 2?
- Built in 1900 — when were the roof, HVAC, electrical panel, plumbing, and water heater last replaced?
- Is there a deadline driving the sale (1031 exchange, divorce, estate, relocation)? That informs how much negotiation room exists.
- Schools are A-rated — typically a magnet for longer-tenancy family renters. What's the average tenant stay here, and is there a school-zone premium baked into asking?
- Crime grade is F in this area — have there been break-ins, vandalism, or insurance claims at this property in the last 3 years? What carrier currently insures it and at what premium?
- What's the average days-on-market for RENTAL listings here right now (not sales)? A rising rental-DOM trend means longer vacancies and softer asking-rent achievability than the comps imply.
- What's the recent tenant-quality profile in this submarket — average credit score on applications, eviction rate, late-payment / NSF rate, and stable-employment percentage? A property-management company in the area should have these aggregated.
- How much new apartment / multifamily construction is in the pipeline within 1–3 miles? Heavy new supply (>2% of stock underway) typically softens rents 12–24 months out; light construction supports rent growth.
Investment metrics
- 1% rule
- 1.36% ✓
- Cap rate
- 11.45%
- Cash-on-cash
- 18.43%
- DSCR
- 1.82
- GRM
- 6.1
CMA / ARV
No comps found within radius.
Projected returns pro-forma
-3.0% appreciation · 3.0% rent growth · sell at horizon
- IRR
- 10.1%
- Equity multiple
- 1.40×
- Total profit
- $44,612
- Equity at exit
- $59,492
- IRR
- 19.2%
- Equity multiple
- 2.61×
- Total profit
- $179,433
- Equity at exit
- $34,498
Cash invested: $111,720 (down + closing). Projections, not guarantees.
Landlord ↔ Tenant lean methodology
- Overall (STATE)
- 41 Moderately Tenant-Leaning
- State Vermont
- 41 Moderately Tenant-Leaning · D+15
- County
- — inherits STATE
- City
- — inherits STATE
ZIP-level market 05301
- Home prices YoY
- -19.2%
- Active inventory
- 80
- Price-to-rent
- 18.4×
Monthly cashflow live
- Estimated rent
- $5,411 medium interval (Pro) →
- Mortgage (P&I)
- −$2,092
- Tax from tax record
- −$300 /mo · $3,598/yr
- Insurance
- −$166
- HOA
- −$0
- Vacancy / Maint / Mgmt
- −$1,136
- Net cashflow
- $1,716
Break-even live
Sensitivity live
| Price | -10% $1,942 | -5% $1,829 | +0% $1,716 | +5% $1,603 | +10% $1,490 |
|---|---|---|---|---|---|
| Rent | -10% $1,289 | -5% $1,502 | +0% $1,716 | +5% $1,930 | +10% $2,144 |
| Rate | -1.0pp $1,917 | -0.5pp $1,818 | base $1,716 | +0.5pp $1,613 | +1.0pp $1,508 |
3-unit breakdown (identical units grouped — click to expand)
| Units | Beds | Baths | Est. rent |
|---|---|---|---|
| 3× units | 1 | 1 | $5,412 |
| #1 | 1 | 1 | $1,804 |
| #2 | 1 | 1 | $1,804 |
| #3 | 1 | 1 | $1,804 |
| Total (3 units) | $5,411 | ||
UW: 25.0% down · 7.5% · 30yr · 1.5% tax · 5.0% vac · 8.0% maint · 8.0% mgmt
Financing live
Cash to close
- Down payment
- $99,750
- Closing costs
- $11,970
- Reserves months
- —
- Total cash needed
- —
Loan-product check · same deal, 3 products live
Conventional
25% down · 7.5% · 30yr
- Down + closing
- —
- Monthly P&I
- —
- Monthly cashflow
- —
- DSCR
- —
- Eligible?
- —
Personal DTI + credit; lowest rate.
DSCR
20% down · 8.5% · 30yr
- Down + closing
- —
- Monthly P&I
- —
- Monthly cashflow
- —
- DSCR
- —
- Eligible?
- —
No personal income docs; deal must DSCR.
Hard money
10% down · 12.0% · 12mo
- Down + closing
- —
- Monthly P&I
- —
- Monthly cashflow
- —
- DSCR
- —
- Eligible?
- —
Short-term bridge; refi at stabilization.
Listing history 21 events
-
2026-06-21days on market $399,000 Active 31 DOM
-
2026-06-18days on market $399,000 Active 28 DOM
-
2026-06-17days on market $399,000 Active 27 DOM
-
2026-06-16days on market $399,000 Active 26 DOM
-
2026-06-15days on market $399,000 Active 25 DOM
-
2026-06-14days on market $399,000 Active 23 DOM
-
2026-06-13days on market $399,000 Active 22 DOM
-
2026-06-10days on market $399,000 Active 20 DOM
-
2026-06-09days on market $399,000 Active 19 DOM
-
2026-06-08days on market $399,000 Active 18 DOM
-
2026-06-07days on market $399,000 Active 17 DOM
-
2026-06-03days on market $399,000 Active 13 DOM
-
2026-06-02days on market $399,000 Active 12 DOM
-
2026-06-01days on market $399,000 Active 11 DOM
-
2026-05-31days on market $399,000 Active 10 DOM
-
2026-05-31days on market $399,000 Active 9 DOM
-
2026-05-21$399,000 Active
-
2004-06-23soldstatus $100,000 166-char remark
Show marketing remark (166 chars)
CHECK OUT THIS GOOD INCOME PRODUCTING PROPERTY WITH DOWN TOWN CONVENIENCE. THIS PROPERTY MAKES A GREAT OPPORTUNTIY FOR SOMEONE LOOKING TO OWN MULTI-FAMILY PROPERTIES.
-
2004-06-23soldstatus $100,000
Show marketing remark (166 chars)
CHECK OUT THIS GOOD INCOME PRODUCTING PROPERTY WITH DOWN TOWN CONVENIENCE. THIS PROPERTY MAKES A GREAT OPPORTUNTIY FOR SOMEONE LOOKING TO OWN MULTI-FAMILY PROPERTIES.
-
2004-04-28historical 166-char remark
Show marketing remark (166 chars)
CHECK OUT THIS GOOD INCOME PRODUCTING PROPERTY WITH DOWN TOWN CONVENIENCE. THIS PROPERTY MAKES A GREAT OPPORTUNTIY FOR SOMEONE LOOKING TO OWN MULTI-FAMILY PROPERTIES.
-
2004-04-23$100,000 166-char remark
Show marketing remark (166 chars)
CHECK OUT THIS GOOD INCOME PRODUCTING PROPERTY WITH DOWN TOWN CONVENIENCE. THIS PROPERTY MAKES A GREAT OPPORTUNTIY FOR SOMEONE LOOKING TO OWN MULTI-FAMILY PROPERTIES.
ⓘ Source: listings_history table (triggers on properties + properties_extension) + one-shot
backfill from property_details.listing_events for pre-trigger history.
Tax reassessment forecast VT · Partial reset (capped growth)
- Current annual tax
- $3,598 · $300/mo
- Projected year-2 tax
- $5,589 · $466/mo
- Expected delta
- +$1,992/yr (+$166/mo · 55.4%)
ⓘ Screening estimate from a state-policy table — verify with the county assessor before closing.
Climate risk First Street
- Flood 1/10 Low FEMA zone X (unshaded) · 0% chance over 30 yrs
- Wildfire 1/10 Low
- Heat 3/10 Moderate 8 d/yr ≥94°F today · 19 d/yr by 30 yrs out
- Wind 4/10 Moderate 11% chance of damaging wind over 30 yrs
- Air quality 2/10 Low 0 unhealthy d/yr today · 1 by 30 yrs out
Nearby sold comps map
Loading sold comps map…
Walkable amenities ~0.75 mi
Loading nearby amenities…
Taxation est. · year 1
- Rental income
- $64,932
- − Mortgage interest
- −$22,350
- − Property taxes
- −$3,598
- − Insurance
- −$1,995
- − Repairs & maintenance
- −$5,195
- − Management
- −$5,195
- − Depreciation
- −$11,607
- Taxable income
- $14,993
- Est. tax owed @ 24.0%
- −$3,598
- After-tax cash flow
- $16,996/yr
For passive investors: Depreciation is non-cash, so a rental often shows a tax loss while cash-flowing — sheltering income. Rental losses are passive: they offset passive income freely, and up to $25,000/yr can offset ordinary (W-2) income if you actively participate and your MAGI is under $100k (phasing out to $0 by $150k); unused losses carry forward. On sale, claimed depreciation is recaptured at up to 25%, and gains may owe capital-gains tax (a 1031 exchange can defer both). Figures are a year-1 estimate at your 24.0% rate — not tax advice; consult a CPA.
Schools (NCES district)
No district data.
Livability — Brattleboro
- Score
- 67/100
- State rank
- #42
- US rank
- #10223
Category grades
Schools grade is shown separately in the Schools card above.
Census & demographics
- Census place
- Brattleboro, VT
- County
- Windham County · 16,955 people
- City population
- 16,955
- Metro
- nan
- Population (ZIP)
- 16,955
- Household income
- $65,910
- Rent vs Own
- Severe rent burden
- 594.0
Population outlook (Windham County) Hauer SSP2
- Today (2025)
- 40,432 people
- By 2030
- 38,472 · -4.8%
- By 2040
- 33,954 · -16.0%
- By 2050
- 29,774 · -26.4%
- By 2075
- 22,351 · -44.7%
- By 2100
- 15,961 · -60.5%
Race, ethnicity, and origin ACS 2023
- Neighborhood character
- Predominantly White (90%)
- Race & ethnicity
- White 90% Two or more races 6% Hispanic / Latino 3% Asian 2%
- Common ancestry
- Lithuanian 7% Romanian 5% Italian 4%
- Foreign-born
- 2% · Canada
- Languages at home
- 97% English-only · Spanish 2% Other Asian/Pacific 1%
Political lean MEDSL · Windham
- 2024 margin
- Solid D (+42.7) · D 69.6% · R 26.9% · Other 3.5%
- 2008→2024 swing
- -5.4pp toward R · 2008: 48.1pp · 2024: 42.7pp
- All cycles
- 2024: D+42.7 2020: D+47.3 2016: D+42.0 2012: D+49.2 2008: D+48.1
Not yet ingested
- Civics
- —
Market trends
- HPI YoY
- ▼ -67.19%
- Current HPI
- 283.2338
- Rent YoY
- —
- Metro
- nan
- State GDP YoY
- —
- F500 in state
- 0
Price history
+299.0% since first listed5 events — show timeline
- 2026-05-21 Listed $399,000 PrimeMLS
- 2004-06-23 Sold (Public Records) $100,000 Public Records
- 2004-06-23 Sold (MLS) $100,000 PrimeMLS
- 2004-04-28 Delisted — PrimeMLS
- 2004-04-23 Listed $100,000 PrimeMLS
Property tax history
-3.9%/yrLatest (2024): $3,598 · +11.7% YoY. Source: county tax records.
Cash-flow waterfall
monthlySold comps — $/sqft
last 12 mo · ≤1 miLoading sold comps…