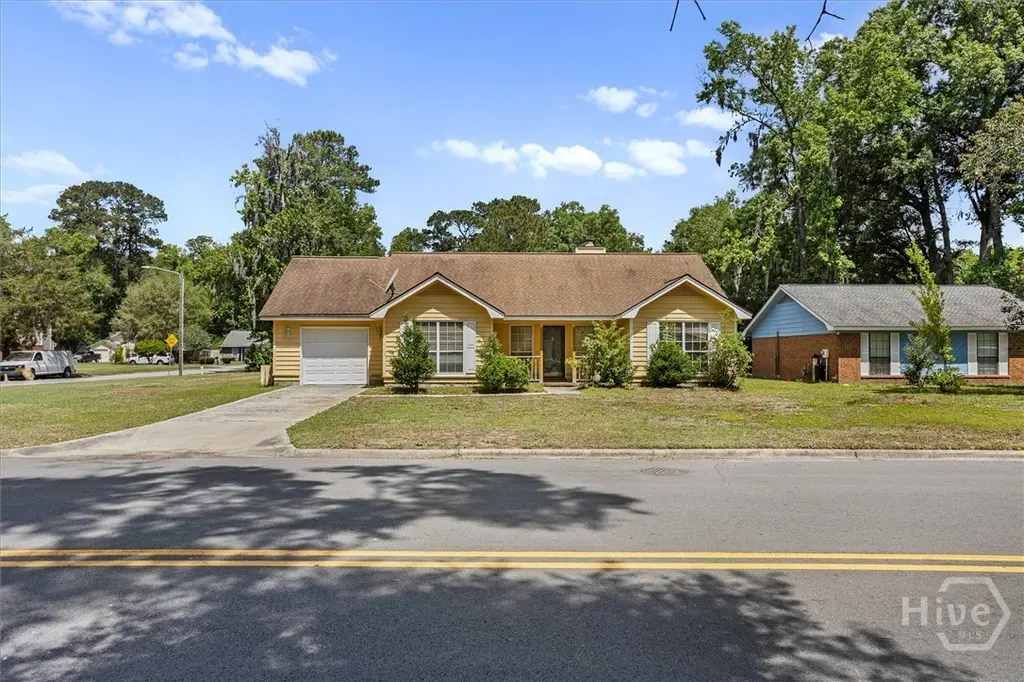
98 Red Fox Dr · Georgetown, GA
Flood risk 1/10 · Minimal
- FEMA flood zone
- X (unshaded)
- Chance of flooding over 30 yrs
- 0.0%
- Est. flood insurance / yr
- $507 – $1,088
Fire risk 4/10 · Minor
- Est. fire insurance / yr
- $963 – $1,789
Heat risk 9/10 · Severe
- Hot days now (above 107°F)
- 7 days/yr
- Hot days in 30 yrs
- 18 days/yr
Wind risk 8/10 · Major
- Chance of severe wind over 30 yrs
- 99.0%
Air-quality risk 2/10 · Minimal
- Unhealthy air days now
- 2 days/yr
- Unhealthy air days in 30 yrs
- 2 days/yr
Risk factors via First Street. Map © Google.
Why this score? — see what drove the B- grade
The composite is a weighted blend of 9 inputs, each scored 0–100. Each bar is that input's sub-score; the figure is the points it added to the 100-point composite (weight × sub-score).
- Cash flow +26.4/30.0
- ARV discount +15.0/15.0
- DSCR +9.0/10.0
- 1% rule +7.2/10.0
- Livability +3.4/5.0
- Condition / age +2.5/5.0
- Rent growth +2.1/5.0
- Schools +2.0/10.0
- Appreciation +0.0/10.0
$175,000
🖨 Deal sheet 📄 Offer letter ✓ Due diligence
Listing remarks
HIGHEST AND BEST OFFERS DUE BY 6PM FRIDAY MAY 8TH. Priced to move and ready for your vision, this 3-bed/2-bath Georgetown home is a blank canvas with solid bones, reliable systems, and the structure to support a full open-concept transformation. At 1,652 sq ft, the layout offers real flexibility for investors looking to maximize resale value or rental returns. Georgetown's central Savannah location puts you minutes from major employers, shopping, dining, and commuter routes, making this a high-demand corridor for buyers and renters alike. The fenced lot adds curb appeal potential, and the fundamentals are sound, meaning your budget goes toward building equity, not fixing surprises. Whether
Key facts
- Fenced lot
- 0.27 acre lot
- Garage
Tags
Property features AI
Finance
- Other: Publicly maintained asphalt road
- Financial info: No additional financial details provided
- HOA & community: Homeowners association with $48 monthly fee
Exterior
- Parking: Attached garage with garage door opener; Off-street parking; 1 garage space
- Security: No security details provided
- Utilities: Public water; Public sewer; Underground utilities
- Home design: Single-family residence; Single-story; PUDC zoning (single family)
- Construction: Cedar exterior; Composition roof; Slab foundation; Built year not provided
- Exterior features: Front porch; Patio; Private backyard; Wood fencing / fenced yard; Outbuilding
Interior
- Kitchen: Oven; Range; Refrigerator
- Bedrooms: No bedroom level details provided
- Flooring: No flooring details provided
- Bathrooms: 2 full bathrooms
- Heating & cooling: Central heating (electric); Central air conditioning (electric)
- Interior features: Pantry; Gas fireplace in family room
- Laundry & utility: Dedicated laundry room; Gas water heater
Neighborhood map
What this means for you Summary
Snapshot
- This is a 3-bed/2.0-bath single-family listed at $175k.
Deal economics
- At list price, monthly cash flow is $460 ($6k/yr) — positive.
- The deal already cash-flows at list — no discount required.
- Meets the 1% rule at list price ($2k rent vs $175k).
- Cap rate 9.4% vs local median 4.0% in Georgetown — top-decile yield for the area; either an underpriced asset or a hidden risk that comps aren't pricing in. Stress-test before assuming the spread holds.
Location & tenants
- Location reads 68/100 on livability (#138 in GA) — a middle-class / working-renter tenant base. Strengths: cost of living A+, housing A+, health & safety A-; Watch: employment C-, schools F, amenities F.
- Savannah-Chatham County (urban): math 20% / reading 26% proficiency, ranked #134 of 174 in GA (top 77%) — low school quality limits family demand, transient renter base, plan for 1-2y turnover.
- Market conditions: Rents soft (-1.4%/yr); 405 active listings in the ZIP; 22 comparable units currently listed for rent nearby; rentals at typical pace (median 23d on market — plan ~3-4 weeks tenant-placement turnaround); 2,694 units permitted in Chatham County in 2024 (973 in 5+ unit buildings).
- This rent runs 37% of the median local income ($70k/yr) — at the standard rent-burdened threshold; future hikes will face affordability resistance.
Forward outlook
- Local home prices are declining (-3.0%/yr); year-one equity from $1k of loan paydown is wiped out by about $5k of value loss. Plan a longer hold.
- Chatham County population projected at +33% by 2050 — long-run rental-demand tailwind backs the buy-and-hold thesis.
Negotiation context
- Only 3 days on market — expect competitive offers; lowballing is unlikely to land.
Risks & watch-outs
- Climate carrying-cost: severe wind risk, 99% chance of damaging wind over 30y; extreme-heat days projected 7→18/yr by 2055 (HVAC capex compounding) — expect insurance premiums to compound above CPI over the hold.
Questions for the listing agent
- What does the HOA fee cover, when was the last increase, and are there any pending special assessments or reserve-fund shortfalls?
- Is there a deadline driving the sale (1031 exchange, divorce, estate, relocation)? That informs how much negotiation room exists.
- Schools are F-rated, which usually means shorter tenancies and higher turnover. Who's the typical renter profile here, and what's been the actual vacancy rate?
- What's the average days-on-market for RENTAL listings here right now (not sales)? A rising rental-DOM trend means longer vacancies and softer asking-rent achievability than the comps imply.
- What's the recent tenant-quality profile in this submarket — average credit score on applications, eviction rate, late-payment / NSF rate, and stable-employment percentage? A property-management company in the area should have these aggregated.
- How much new for-sale + rental construction is in the pipeline within 1–3 miles? Heavy new supply typically softens prices + rents 12–24 months out; constrained supply supports both.
Investment metrics
- 1% rule
- 1.22% ✓
- Cap rate
- 9.45%
- Cash-on-cash
- 11.26%
- DSCR
- 1.50
- GRM
- 6.8
CMA / ARV
- ARV (median comp)
- $291,951
- List price
- $175,000
- Delta
- -40.06%
- Verdict
- UNDERPRICED
- Comps
- 20 within 1.0 mi
Show comp detail 12 sales within ~0.75 mi
| Address | Dist | Beds/Ba | Sqft | Sold | Price | $/sf | Match |
|---|---|---|---|---|---|---|---|
| 98 Red Fox Dr | 0.00mi | 3/2.0 | 1,652 (0%) | 1mo | $203,630 | $123 | 99 |
| 106 Snowbell Ct | 0.16mi | 3/2.0 | 1,821 (+10%) | 3mo | $377,306 | $207 | 73 |
| 3 W Sagebrush Ln | 0.12mi | 3/2.0 | 1,432 (-13%) | 3mo | $289,000 | $202 | 70 |
| 102 E Sagebrush Ln | 0.17mi | 3/2.0 | 1,458 (-12%) | 4mo | $325,000 | $223 | 69 |
| 56 Red Fox Dr | 0.34mi | 3/2.0 | 1,791 (+8%) | 3mo | $314,990 | $176 | 68 |
| 270 Sessile Oak Dr | 0.25mi | 3/2.0 | 1,449 (-12%) | 2mo | $327,000 | $226 | 66 |
| 103 Snowbell Ct | 0.43mi | 3/2.0 | 1,821 (+10%) | 3mo | $370,120 | $203 | 61 |
| 20 Beaver Run Dr | 0.57mi | 3/2.0 | 1,782 (+8%) | 2mo | $339,500 | $191 | 59 |
| 120 Cormorant Way | 0.41mi | 3/2.0 | 1,439 (-13%) | 4mo | $315,000 | $219 | 56 |
| 104 Snowbell Ct | 0.41mi | 4/2.5 (+1) | 1,870 (+13%) | 3mo | $396,384 | $212 | 50 |
| 118 Trellis Way | 0.53mi | 3/2.5 | 1,862 (+13%) | 4mo | $274,500 | $147 | 49 |
| 2 St Ives Dr Dr | 0.75mi | 3/2.0 | 1,408 (-15%) | 1mo | $275,000 | $195 | 39 |
Match score weights: distance 35% · size 25% · config 20% · recency 20%. Top-matched comps best support the ARV.
Projected returns pro-forma
-3.0% appreciation · 0.0% rent growth · sell at horizon
- IRR
- -3.0%
- Equity multiple
- 0.89×
- Total profit
- $-5,282
- Equity at exit
- $26,093
- IRR
- 3.0%
- Equity multiple
- 1.19×
- Total profit
- $9,117
- Equity at exit
- $15,131
Cash invested: $49,000 (down + closing). Projections, not guarantees.
Landlord ↔ Tenant lean methodology
- Overall (STATE)
- 90 Strongly Landlord-Friendly
- State Georgia
- 90 Strongly Landlord-Friendly · R+3
- County
- — inherits STATE
- City
- — inherits STATE
ZIP-level market 31419
- Home prices YoY
- -25.9%
- Rents YoY
- -1.4%
- Active inventory
- 405
- Price-to-rent
- 6.8×
Monthly cashflow live
- Estimated rent
- $2,134 high interval (Pro) →
- Mortgage (P&I)
- −$918
- Tax from tax record
- −$187 /mo · $2,246/yr
- Insurance
- −$73
- HOA
- −$48
- Vacancy / Maint / Mgmt
- −$448
- Net cashflow
- $460
Break-even live
UW: 25.0% down · 7.5% · 30yr · 1.5% tax · 5.0% vac · 8.0% maint · 8.0% mgmt
Financing live
Cash to close
- Down payment
- $43,750
- Closing costs
- $5,250
- Reserves months
- —
- Total cash needed
- —
Loan-product check · same deal, 3 products live
Conventional
25% down · 7.5% · 30yr
- Down + closing
- —
- Monthly P&I
- —
- Monthly cashflow
- —
- DSCR
- —
- Eligible?
- —
Personal DTI + credit; lowest rate.
DSCR
20% down · 8.5% · 30yr
- Down + closing
- —
- Monthly P&I
- —
- Monthly cashflow
- —
- DSCR
- —
- Eligible?
- —
No personal income docs; deal must DSCR.
Hard money
10% down · 12.0% · 12mo
- Down + closing
- —
- Monthly P&I
- —
- Monthly cashflow
- —
- DSCR
- —
- Eligible?
- —
Short-term bridge; refi at stabilization.
Rent comps 22 comps
| Address | Beds | Baths | Sqft | Rent | $/sqft | DOM | Units | Dist |
|---|---|---|---|---|---|---|---|---|
| 116 W White Hawthorne Dr Savannah, GA | 3.0 | 2.0 | 1100 | $1,800 | $1.64 | 43d | 1 | 0.11mi |
| 152 Dovetail Xing Savannah, GA | 3.0 | 2.0 | 1398 | $2,100 | $1.50 | 13d | 1 | 0.23mi |
| 152 Dovetail Xing Savannah, GA | 3.0 | 2.0 | 1400 | $2,100 | $1.50 | 43d | 1 | 0.23mi |
| 213 Sessile Oak Dr Savannah, GA | 3.0 | 2.0 | 2080 | $2,520 | $1.21 | 43d | 1 | 0.32mi |
| 160 Lions Gate Rd Savannah, GA | 3.0 | 2.5 | 1976 | $2,500 | $1.27 | 43d | 1 | 0.43mi |
| 102 Cormorant Way Savannah, GA | 3.0 | 2.0 | 1806 | $2,150 | $1.19 | 13d | 1 | 0.49mi |
| 33 Beaver Run Dr Savannah, GA | 4.0 | 2.0 | 1519 | $2,400 | $1.58 | 43d | 1 | 0.54mi |
| 102 Trellis Way Savannah, GA | 3.0 | 2.0 | 1250 | $1,900 | $1.52 | 23d | 1 | 0.57mi |
| 120 Calm Oak Cir Savannah, GA | 3.0 | 2.5 | 1816 | $2,250 | $1.24 | 43d | 1 | 0.82mi |
| 1538 Bradley Blvd Savannah, GA | 3.0 | 2.5 | 1828 | $2,395 | $1.31 | 13d | 1 | 1.02mi |
| 1825 Grove Point Rd Savannah, GA | 1.0–3.0 | 1.0–2.0 | 1089 | $2,075 | $1.90 | 13d | 34 | 1.02mi |
| 2014 Grove Point Rd Savannah, GA | 3.0 | 2.0 | 2213 | $2,500 | $1.13 | 43d | 1 | 1.19mi |
| 1800 Grove Point Rd Savannah, GA | 1.0–3.0 | 1.0–2.0 | 1088 | $1,978 | $1.82 | 13d | 16 | 1.19mi |
| 1015 King George Blvd Savannah, GA | 1.0–2.0 | 1.0–2.0 | 1007 | $1,600 | $1.59 | 23d | 1 | 1.26mi |
| 34 Pomona Cir Savannah, GA | 4.0 | 2.5 | 1921 | $2,295 | $1.19 | 23d | 1 | 1.39mi |
| 98 Dunnoman Dr Savannah, GA | 4.0 | 2.5 | 2029 | $2,250 | $1.11 | 13d | 1 | 1.39mi |
| 83 Dunnoman Dr Savannah, GA | 4.0 | 2.5 | 2029 | $2,700 | $1.33 | 43d | 1 | 1.42mi |
| 107 Cockle Shell Rd Savannah, GA | 4.0 | 2.5 | 2004 | $2,600 | $1.30 | 13d | 1 | 1.44mi |
| 38 Flagler Dr Savannah, GA | 4.0 | 2.5 | 2005 | $2,550 | $1.27 | 23d | 1 | 1.45mi |
| 15 Brasseler Blvd Savannah, GA | 1.0–3.0 | 1.0–2.0 | 1077 | $1,900 | $1.76 | 13d | 16 | 1.46mi |
| 37 Stetson Dr Savannah, GA | 4.0 | 2.5 | 2005 | $2,600 | $1.30 | 23d | 1 | 1.50mi |
| 19 Stetson Dr Savannah, GA | 3.0 | 2.0 | 1544 | $2,750 | $1.78 | 13d | 1 | 1.50mi |
HOA detail
- Monthly dues
- $48 · $576/yr
Listing history 2 events
-
2026-05-09status Pending 837-char remark
-
2026-05-06$175,000 Active 837-char remark
ⓘ Source: listings_history table (triggers on properties + properties_extension) + one-shot
backfill from property_details.listing_events for pre-trigger history.
Tax reassessment forecast GA · Resets to sale price
- Current annual tax
- $2,246 · $187/mo
- Projected year-2 tax
- $2,246 · $187/mo
- Expected delta
- $0/yr ($0/mo · 0.0%)
ⓘ Screening estimate from a state-policy table — verify with the county assessor before closing.
Climate risk First Street
- Flood 1/10 Low FEMA zone X (unshaded) · 0% chance over 30 yrs
- Wildfire 4/10 Moderate
- Heat 9/10 Extreme 7 d/yr ≥107°F today · 18 d/yr by 30 yrs out
- Wind 8/10 Severe 99% chance of damaging wind over 30 yrs
- Air quality 2/10 Low 2 unhealthy d/yr today · 2 by 30 yrs out
Nearby sold comps map
Loading sold comps map…
Walkable amenities ~0.75 mi
Loading nearby amenities…
Taxation est. · year 1
- Rental income
- $25,604
- − Mortgage interest
- −$9,803
- − Property taxes
- −$2,246
- − Insurance
- −$875
- − Repairs & maintenance
- −$2,048
- − Management
- −$2,048
- − HOA
- −$576
- − Depreciation
- −$5,091
- Taxable income
- $2,917
- Est. tax owed @ 24.0%
- −$700
- After-tax cash flow
- $4,818/yr
For passive investors: Depreciation is non-cash, so a rental often shows a tax loss while cash-flowing — sheltering income. Rental losses are passive: they offset passive income freely, and up to $25,000/yr can offset ordinary (W-2) income if you actively participate and your MAGI is under $100k (phasing out to $0 by $150k); unused losses carry forward. On sale, claimed depreciation is recaptured at up to 25%, and gains may owe capital-gains tax (a 1031 exchange can defer both). Figures are a year-1 estimate at your 24.0% rate — not tax advice; consult a CPA.
Schools (NCES district)
- District
- Savannah-Chatham County
- NCES district ID
- 1301020
- Math proficiency
- 20% ▼ -11.00%
- Reading proficiency
- 26% ▼ -5.00%
- Median HH income
- $47,443
- Composite
- 20.14/100
- National rank
- #8639
- State rank
- #134 of 174 in GA
Livability — Georgetown
- Score
- 68/100
- State rank
- #138
- US rank
- #9395
Category grades
Schools grade is shown separately in the Schools card above.
Census & demographics
- Census place
- Georgetown, GA
- County
- Chatham County · 271,602 people
- Metro
- Savannah, GA
- Population (ZIP)
- 57,077
- Household income
- $69,635
- Rent vs Own
- Severe rent burden
- 2575.0
Population outlook (Chatham County) Hauer SSP2
- Today (2025)
- 332,584 people
- By 2030
- 355,508 · +6.9%
- By 2040
- 400,030 · +20.3%
- By 2050
- 443,019 · +33.2%
- By 2075
- 534,579 · +60.7%
- By 2100
- 583,863 · +75.6%
Race, ethnicity, and origin ACS 2023
- Neighborhood character
- Diverse neighborhood (Simpson 0.68)
- Race & ethnicity
- White 40% Black 38% Hispanic / Latino 12% Two or more races 7% Asian 5%
- Hispanic origin (detail)
- Mexican 4% Puerto Rican 3%
- Common ancestry
- Slovak 2% Lithuanian 1% Serbian 1%
- Foreign-born
- 12% · Canada, Vietnam, South Korea
- Languages at home
- 83% English-only · Spanish 9% Other Indo-European 2% Vietnamese 1%
Political lean MEDSL · Chatham
- 2024 margin
- D (+18.0) · D 58.6% · R 40.6%
- 2008→2024 swing
- +3.6pp toward D · 2008: 14.4pp · 2024: 18.0pp
- All cycles
- 2024: D+18.0 2020: D+18.8 2016: D+14.5 2012: D+12.0 2008: D+14.4
Not yet ingested
- Civics
- —
Market trends
- HPI YoY
- ▼ -92.38%
- Current HPI
- 264.8625
- Rent YoY
- ▼ -1.44%
- Metro
- Savannah, GA
- State GDP YoY
- ▲ 2.66%
- F500 in state
- 28
Industry mix (Fortune 500 HQ in GA)
| Industry | F500 HQs | Revenue |
|---|---|---|
| Paper / Packaging | 2 | $29B |
|
||
| Retail | 1 | $160B |
|
||
| Transportation / Logistics | 1 | $91B |
|
||
| Airlines | 1 | $62B |
|
||
| Consumer Goods | 1 | $47B |
|
||
| Utilities | 1 | $25B |
|
||
Price history
+16.4% since first listed3 events — show timeline
- 2026-05-28 Sold (MLS) $203,630 Hive MLS
- 2026-05-09 Pending — Hive MLS
- 2026-05-06 Listed $175,000 Hive MLS
Property tax history
+2.1%/yrLatest (2025): $2,246 · +84.1% YoY. Source: county tax records.
Cash-flow waterfall
monthlySold comps — $/sqft
last 12 mo · ≤1 miLoading sold comps…