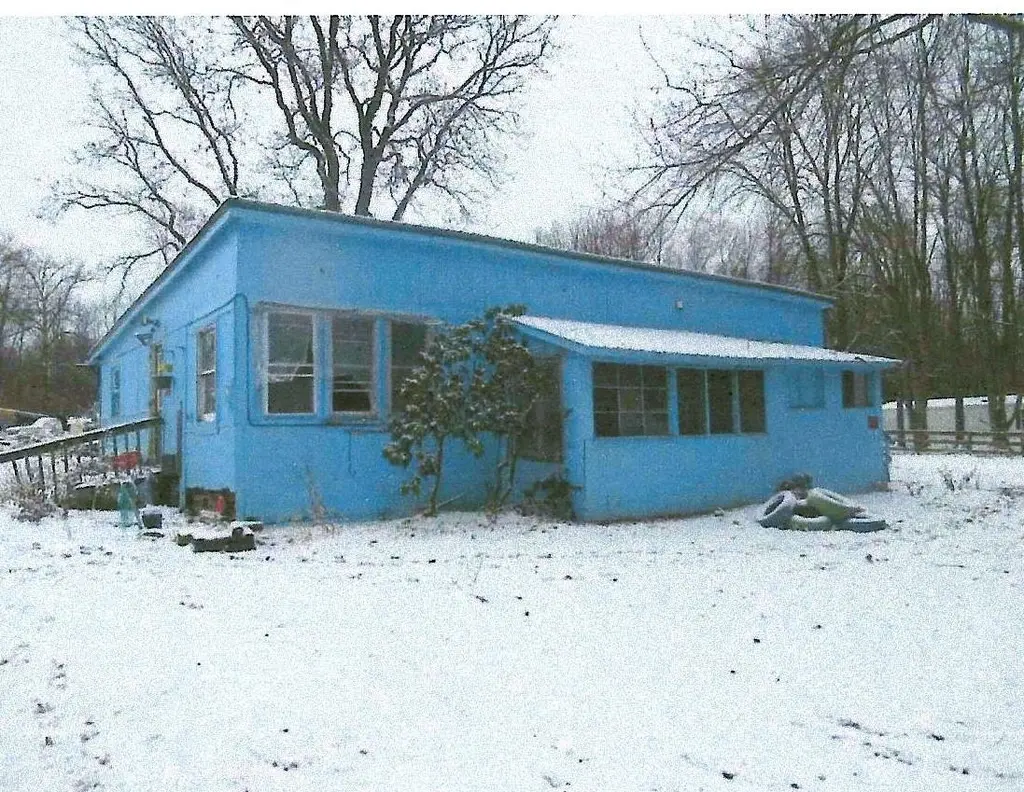
73 Corliss Rd · St. Albans, VT
Flood risk 1/10 · Minimal
- FEMA flood zone
- X
- Chance of flooding over 30 yrs
- 0.0%
- Est. flood insurance / yr
- $507 – $1,088
Fire risk 1/10 · Minimal
- Est. fire insurance / yr
- $480 – $892
Heat risk 2/10 · Minimal
- Hot days now (above 93°F)
- 7 days/yr
- Hot days in 30 yrs
- 15 days/yr
Wind risk 2/10 · Minimal
- Chance of severe wind over 30 yrs
- 1.0%
Air-quality risk 3/10 · Minor
- Unhealthy air days now
- 2 days/yr
- Unhealthy air days in 30 yrs
- 3 days/yr
Risk factors via First Street. Map © Google.
Why this score? — see what drove the B grade
The composite is a weighted blend of 9 inputs, each scored 0–100. Each bar is that input's sub-score; the figure is the points it added to the 100-point composite (weight × sub-score).
- Cash flow +30.0/30.0
- 1% rule +10.0/10.0
- DSCR +10.0/10.0
- ARV discount +7.5/15.0
- Schools +5.0/10.0
- Rent growth +2.5/5.0
- Livability +2.5/5.0
- Condition / age +2.5/5.0
- Appreciation +0.0/10.0
$80,000
🖨 Deal sheet 📄 Offer letter ✓ Due diligence
Listing remarks
Property is selling as is. Most likely will need a construction loan or a tear down. Has well and septic is not in use.
Key facts
- 0.55 acre lot
- Garage
- Built 1960
Property features AI
Exterior
- Parking: Attached or detached 1-car garage
- Utilities: Drilled well (shared); Private sewer; Electric service listed as other; No internet service reported
- Home design: Ranch-style single-family home; Existing construction; Facing direction not specified; Entry level not specified
- Construction: Built in 1960; Wood frame construction; Metal roof; Foundation: crawl space/dirt floor
- Exterior features: Level, neighborhood lot; Gravel driveway; Dead-end road frontage on a public maintained gravel road
Interior
- Bathrooms: One full bathroom
- Heating & cooling: Oil heating; Hot air heating
- Interior features: Six total rooms; Crawl space basement with dirt floor; Interior access to basement
Neighborhood map
What this means for you Summary
Snapshot
- This is a 4-bed/1.0-bath other listed at $80k.
Deal economics
- At list price, monthly cash flow is $837 ($10k/yr) — positive.
- The deal already cash-flows at list — no discount required.
- Meets the 1% rule at list price ($2k rent vs $80k).
- Cap rate 18.9% vs local median 2.4% in St. Albans — top-decile yield for the area; either an underpriced asset or a hidden risk that comps aren't pricing in. Stress-test before assuming the spread holds.
Location & tenants
- Location reads: area grade B — affects rentability + tenant quality, not the cash-flow math above.
- Zoned schools: St. Albans City Elementary School (math 24% / reading 38%, grade F, #135 of 192 statewide, top 70%, 718 students, 56% FRL).
- Market conditions: 123 active listings in the ZIP; 200 units permitted in Franklin County in 2024 (25 in 5+ unit buildings).
Forward outlook
- Local home prices are declining (-3.0%/yr); year-one equity from $553 of loan paydown is wiped out by about $2k of value loss. Plan a longer hold.
- Franklin County population projected to shrink 3% by 2050 — rents likely to lag national; underwrite the cash flow, not the appreciation.
- At projected returns (-3.0% appreciation + 3.0% rent growth), your $22k cash investment doubles in ~3 years — after that, you're playing with house money.
Negotiation context
- Only 14 days on market — expect competitive offers; lowballing is unlikely to land.
Risks & watch-outs
- Watch-outs: property tax is 2.8% of price.
Questions for the listing agent
- Built in 1960 — when were the roof, HVAC, electrical panel, plumbing, and water heater last replaced?
- Property tax is high relative to price — has the assessment been appealed recently, and will the sale trigger a re-assessment?
- Is there a deadline driving the sale (1031 exchange, divorce, estate, relocation)? That informs how much negotiation room exists.
- What's the average days-on-market for RENTAL listings here right now (not sales)? A rising rental-DOM trend means longer vacancies and softer asking-rent achievability than the comps imply.
- What's the recent tenant-quality profile in this submarket — average credit score on applications, eviction rate, late-payment / NSF rate, and stable-employment percentage? A property-management company in the area should have these aggregated.
- How much new for-sale + rental construction is in the pipeline within 1–3 miles? Heavy new supply typically softens prices + rents 12–24 months out; constrained supply supports both.
Investment metrics
- 1% rule
- 2.34% ✓
- Cap rate
- 18.85%
- Cash-on-cash
- 44.85%
- DSCR
- 3.00
- GRM
- 3.6
CMA / ARV
- ARV (median comp)
- $459,489
- List price
- $80,000
- Delta
- -82.59%
- Verdict
- UNDERPRICED
- Comps
- 2 within 2.0 mi
Projected returns pro-forma
-3.0% appreciation · 3.0% rent growth · sell at horizon
- IRR
- 42.0%
- Equity multiple
- 2.81×
- Total profit
- $40,441
- Equity at exit
- $11,928
- IRR
- 48.1%
- Equity multiple
- 5.65×
- Total profit
- $104,206
- Equity at exit
- $6,917
Cash invested: $22,400 (down + closing). Projections, not guarantees.
Landlord ↔ Tenant lean methodology
- Overall (STATE)
- 41 Moderately Tenant-Leaning
- State Vermont
- 41 Moderately Tenant-Leaning · D+15
- County
- — inherits STATE
- City
- — inherits STATE
ZIP-level market 05478
- Home prices YoY
- -28.1%
- Active inventory
- 123
- Price-to-rent
- 3.6×
Monthly cashflow live
- Estimated rent
- $1,869 medium interval (Pro) →
- Mortgage (P&I)
- −$420
- Tax from tax record
- −$186 /mo · $2,232/yr
- Insurance
- −$33
- HOA
- −$0
- Vacancy / Maint / Mgmt
- −$392
- Net cashflow
- $837
Break-even live
UW: 25.0% down · 7.5% · 30yr · 1.5% tax · 5.0% vac · 8.0% maint · 8.0% mgmt
Financing live
Cash to close
- Down payment
- $20,000
- Closing costs
- $2,400
- Reserves months
- —
- Total cash needed
- —
Loan-product check · same deal, 3 products live
Conventional
25% down · 7.5% · 30yr
- Down + closing
- —
- Monthly P&I
- —
- Monthly cashflow
- —
- DSCR
- —
- Eligible?
- —
Personal DTI + credit; lowest rate.
DSCR
20% down · 8.5% · 30yr
- Down + closing
- —
- Monthly P&I
- —
- Monthly cashflow
- —
- DSCR
- —
- Eligible?
- —
No personal income docs; deal must DSCR.
Hard money
10% down · 12.0% · 12mo
- Down + closing
- —
- Monthly P&I
- —
- Monthly cashflow
- —
- DSCR
- —
- Eligible?
- —
Short-term bridge; refi at stabilization.
Listing history 2 events
-
2026-05-12status Pending 119-char remark
-
2026-04-28$80,000 Active 119-char remark
ⓘ Source: listings_history table (triggers on properties + properties_extension) + one-shot
backfill from property_details.listing_events for pre-trigger history.
Tax reassessment forecast VT · Partial reset (capped growth)
- Current annual tax
- $2,232 · $186/mo
- Projected year-2 tax
- $2,232 · $186/mo
- Expected delta
- $0/yr ($0/mo · 0.0%)
ⓘ Screening estimate from a state-policy table — verify with the county assessor before closing.
Climate risk First Street
- Flood 1/10 Low FEMA zone X · 0% chance over 30 yrs
- Wildfire 1/10 Low
- Heat 2/10 Low 7 d/yr ≥93°F today · 15 d/yr by 30 yrs out
- Wind 2/10 Low 100% chance of damaging wind over 30 yrs
- Air quality 3/10 Moderate 2 unhealthy d/yr today · 3 by 30 yrs out
Nearby sold comps map
Loading sold comps map…
Walkable amenities ~0.75 mi
Loading nearby amenities…
Taxation est. · year 1
- Rental income
- $22,422
- − Mortgage interest
- −$4,481
- − Property taxes
- −$2,232
- − Insurance
- −$400
- − Repairs & maintenance
- −$1,794
- − Management
- −$1,794
- − Depreciation
- −$2,327
- Taxable income
- $9,394
- Est. tax owed @ 24.0%
- −$2,254
- After-tax cash flow
- $7,792/yr
For passive investors: Depreciation is non-cash, so a rental often shows a tax loss while cash-flowing — sheltering income. Rental losses are passive: they offset passive income freely, and up to $25,000/yr can offset ordinary (W-2) income if you actively participate and your MAGI is under $100k (phasing out to $0 by $150k); unused losses carry forward. On sale, claimed depreciation is recaptured at up to 25%, and gains may owe capital-gains tax (a 1031 exchange can defer both). Figures are a year-1 estimate at your 24.0% rate — not tax advice; consult a CPA.
Schools (NCES district)
No district data.
Livability — St. Albans
No livability data for this city. (Only ~50 U.S. cities are tracked.)
Census & demographics
- Population (ZIP)
- 16,016
Population outlook (Franklin County) Hauer SSP2
- Today (2025)
- 50,374 people
- By 2030
- 50,718 · +0.7%
- By 2040
- 50,557 · +0.4%
- By 2050
- 48,832 · -3.1%
- By 2075
- 43,526 · -13.6%
- By 2100
- 33,970 · -32.6%
Race, ethnicity, and origin ACS 2023
- Neighborhood character
- Predominantly White (92%)
- Race & ethnicity
- White 92% Two or more races 5% Hispanic / Latino 3% Native American 1%
- Common ancestry
- Lithuanian 16% Slovak 3% Romanian 2%
- Foreign-born
- 3% · Canada
- Languages at home
- 95% English-only · French/Haitian/Cajun 3% Spanish 1%
Political lean MEDSL · Franklin
- 2024 margin
- Toss-up / Even · D 50.0% · R 47.0% · Other 3.0%
- 2008→2024 swing
- -21.8pp toward R · 2008: 24.8pp · 2024: 3.0pp
- All cycles
- 2024: D+3.0 2020: D+9.0 2016: D+3.1 2012: D+23.6 2008: D+24.8
Not yet ingested
- Civics
- —
Market trends
- HPI YoY
- ▼ -126.12%
- Current HPI
- 322.6117
- Rent YoY
- —
- Metro
- —
- State GDP YoY
- —
- F500 in state
- 0
Price history
+2.5% since first listed3 events — show timeline
- 2026-06-16 Sold (MLS) $82,000 PrimeMLS
- 2026-05-12 Pending — PrimeMLS
- 2026-04-28 Listed $80,000 PrimeMLS
Property tax history
-0.3%/yrLatest (2024): $2,232 · +9.0% YoY. Source: county tax records.
Cash-flow waterfall
monthlySold comps — $/sqft
last 12 mo · ≤1 miLoading sold comps…