 Duplex
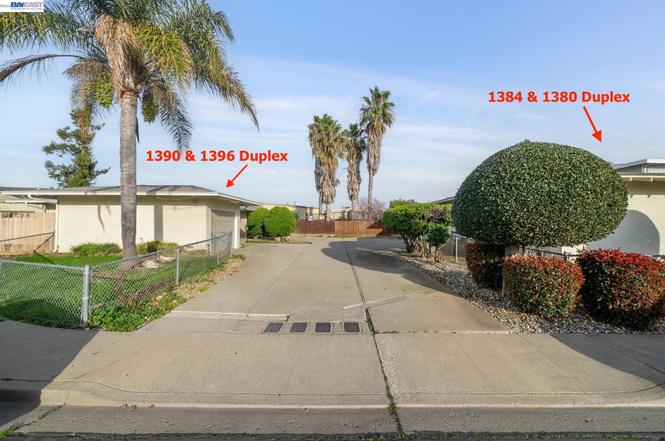
1396 Berry Ln · Brentwood, CA
Flood risk 7/10 · Major
- FEMA flood zone
- X (unshaded)
- Chance of flooding over 30 yrs
- 0.76%
- Est. flood insurance / yr
- $507 – $1,088
Fire risk 1/10 · Minimal
- Est. fire insurance / yr
- $659 – $1,223
Heat risk 6/10 · Moderate
- Hot days now (above 102°F)
- 7 days/yr
- Hot days in 30 yrs
- 14 days/yr
Wind risk 1/10 · Minimal
- Chance of severe wind over 30 yrs
- —
Air-quality risk 9/10 · Severe
- Unhealthy air days now
- 17 days/yr
- Unhealthy air days in 30 yrs
- 19 days/yr
Risk factors via First Street. Map © Google.
Why this score? — see what drove the B- grade
The composite is a weighted blend of 9 inputs, each scored 0–100. Each bar is that input's sub-score; the figure is the points it added to the 100-point composite (weight × sub-score).
- Cash flow +24.3/30.0
- ARV discount +12.3/15.0
- DSCR +7.8/10.0
- 1% rule +6.3/10.0
- Schools +5.3/10.0
- Rent growth +3.8/5.0
- Livability +3.1/5.0
- Condition / age +2.5/5.0
- Appreciation +0.0/10.0
$549,900
🖨 Deal sheet 📄 Offer letter ✓ Due diligence
Multi-family units
County records classify this as Multi-Family (2-4 Unit). Listing-text estimate: 2 units. confirmed
Listing remarks
Rare opportunity to own a Brentwood duplex with strong income potential in a desirable residential neighborhood. Opportunities like this are seldom available in Brentwood. Each unit offers 2 bedrooms, 1 bathroom, and approximately 795 sq ft of comfortable living space. Each unit precedes a cozy yet traditionally designed layout that includes a small private yard, a separate one-car garage, and dedicated laundry, providing convenience and privacy for tenants or owner-occupants alike. Located at the end of a quiet cul-de-sac in a safe and established neighborhood within the highly regarded Brentwood School District. The property also benefits from close proximity to local retail, shopping cen
Key facts
- Income potential
- One-car garage
- Quiet cul-de-sac
Tags
Property features AI
Finance
- Financial info: Property type: Residential income (duplex)
Exterior
- Parking: Total of 5 parking spaces; Attached garage; Guest parking; Off-street parking; Unit 1: 2 parking spaces; Unit 2: 2 parking spaces
- Utilities: Separate meters for electric, gas, and water
- Home design: Duplex (residential income); Built in 1968
- Construction: Stucco construction
- Exterior features: Two houses on one lot; Cul-de-sac location; Level lot
Interior
- Flooring: Laminate flooring; Partial carpeting
- Bathrooms: Unit 1: 1 bathroom; Unit 2: 1 bathroom
- Heating & cooling: Forced air heating; Wall/window air conditioning units; Heating present in units
- Interior features: Gas water heater; Back yard
- Laundry & utility: Washer and dryer in garage; Separate electric, gas, and water meters
Neighborhood map
What this means for you Summary
Snapshot
- This is a 2 × 2-bed/1.0-bath units multifamily listed at $550k.
Deal economics
- At list price, monthly cash flow is $1k ($12k/yr) — positive. Per door: $518/mo.
- The deal already cash-flows at list — no discount required.
- Meets the 1% rule at list price ($6k rent vs $550k).
- Recommended offer: $517k (6.0% below list) — sets the bar for market timing.
- Cap rate 8.7% vs local median 2.7% in Brentwood — top-decile yield for the area; either an underpriced asset or a hidden risk that comps aren't pricing in. Stress-test before assuming the spread holds.
Location & tenants
- Location reads 61/100 on livability (#525 in CA) — a middle-class / working-renter tenant base. Strengths: employment A+, housing A+; Watch: amenities F, commute F, cost of living F.
- Brentwood Union Elementary (suburban): math 51% / reading 59% proficiency, ranked #268 of 1,400 in CA (top 19%) — acceptable for families but not a draw, mixed tenant base, ~2y average lease.
- Market conditions: Rents rising fast (+5.2%/yr); 353 active listings in the ZIP; 14 comparable units currently listed for rent nearby; rentals leasing fast (median 10d on market — plan ~1-2 weeks tenant-placement turnaround); high-income renter base; 2,169 units permitted in Contra Costa County in 2024 (896 in 5+ unit buildings).
- At $6,207/mo this rent would consume 52% of the median local household income ($142k/yr) (locally 1056% of renters already pay >50% of income on rent) — very limited rent-growth headroom before tenants either downsize or default.
Forward outlook
- Local home prices are declining (-3.0%/yr); year-one equity from $4k of loan paydown is wiped out by about $16k of value loss. Plan a longer hold.
- Contra Costa County population projected at +26% by 2050 — long-run rental-demand tailwind backs the buy-and-hold thesis.
- At projected returns (-3.0% appreciation + 5.2% rent growth), your $154k cash investment doubles in ~10 years — after that, you're playing with house money.
Negotiation context
- It's been on market 83 days — a 6% lower offer ($517k) is reasonable based on typical stale-listing flexibility.
- 2 sale attempts; this cycle's ask has dropped $65k (11%) from the opening price — seller is motivated, your offer sets the floor, not the list.
Risks & watch-outs
- Watch-outs: flood insurance adds $66/mo.
- Climate carrying-cost: major flood risk; extreme-heat days projected 7→14/yr by 2055 (HVAC capex compounding) — expect insurance premiums to compound above CPI over the hold.
Questions for the listing agent
- It's been on market 83 days. Have you received any prior offers? Is the seller open to a 6% concession, seller financing, or rate buy-down credit?
- Can we see the unit-by-unit rent roll, current vacancy, and any below-market leases? What's the average tenancy length?
- What capital expenditures (roof, boiler, parking lot, exteriors) have been made in the last 5 years, and what's planned in the next 2?
- Built in 1968 — when were the roof, HVAC, electrical panel, plumbing, and water heater last replaced?
- What's the actual annual flood-insurance premium (NFIP or private), and is the property in a SFHA with mandatory coverage?
- Why hasn't it sold? Are there any deal-killer items the seller is aware of (foundation, flood, title, zoning, code violations)?
- Is there a deadline driving the sale (1031 exchange, divorce, estate, relocation)? That informs how much negotiation room exists.
- What's the average days-on-market for RENTAL listings here right now (not sales)? A rising rental-DOM trend means longer vacancies and softer asking-rent achievability than the comps imply.
- What's the recent tenant-quality profile in this submarket — average credit score on applications, eviction rate, late-payment / NSF rate, and stable-employment percentage? A property-management company in the area should have these aggregated.
- How much new apartment / multifamily construction is in the pipeline within 1–3 miles? Heavy new supply (>2% of stock underway) typically softens rents 12–24 months out; light construction supports rent growth.
Investment metrics
- 1% rule
- 1.13% ✓
- Cap rate
- 8.70%
- Cash-on-cash
- 8.60%
- DSCR
- 1.38
- GRM
- 7.4
CMA / ARV
- ARV (on-the-fly)
- $615,330
- Comps found
- 1
Show comp detail 1 sale within ~0.75 mi
| Address | Dist | Beds/Ba | Sqft | Sold | Price | $/sf | Match |
|---|---|---|---|---|---|---|---|
| 1384 Berry Ln | 0.01mi | 4/2.0 | 1,590 (0%) | 2mo | $615,000 | $387 | 98 |
Match score weights: distance 35% · size 25% · config 20% · recency 20%. Top-matched comps best support the ARV.
Projected returns pro-forma
-3.0% appreciation · 5.22% rent growth · sell at horizon
- IRR
- -1.5%
- Equity multiple
- 0.94×
- Total profit
- $-8,765
- Equity at exit
- $81,992
- IRR
- 10.5%
- Equity multiple
- 1.90×
- Total profit
- $138,802
- Equity at exit
- $47,545
Cash invested: $153,972 (down + closing). Projections, not guarantees.
Landlord ↔ Tenant lean methodology
- Overall (STATE)
- 18 Strongly Tenant-Friendly
- State California
- 18 Strongly Tenant-Friendly · D+13
- County
- — inherits STATE
- City
- — inherits STATE
ZIP-level market 94513
- Rents YoY
- 5.2%
- Active inventory
- 353
- Price-to-rent
- 14.8×
Monthly cashflow live
- Estimated rent
- $6,207 medium interval (Pro) →
- Mortgage (P&I)
- −$2,884
- Tax est. 1.5%
- −$687 /mo · $8,248/yr
- Insurance
- −$229
- Flood insurance flood zone
- −$66 /mo · $798/yr
- HOA
- −$0
- Vacancy / Maint / Mgmt
- −$1,303
- Net cashflow
- $1,037
Break-even live
2-unit breakdown (identical units grouped — click to expand)
| Units | Beds | Baths | Est. rent |
|---|---|---|---|
| 2× units | 2 | 1 | $6,206 |
| #1 | 2 | 1 | $3,103 |
| #2 | 2 | 1 | $3,103 |
| Total (2 units) | $6,207 | ||
UW: 25.0% down · 7.5% · 30yr · 1.5% tax · 5.0% vac · 8.0% maint · 8.0% mgmt
Financing live
Cash to close
- Down payment
- $137,475
- Closing costs
- $16,497
- Reserves months
- —
- Total cash needed
- —
Loan-product check · same deal, 3 products live
Conventional
25% down · 7.5% · 30yr
- Down + closing
- —
- Monthly P&I
- —
- Monthly cashflow
- —
- DSCR
- —
- Eligible?
- —
Personal DTI + credit; lowest rate.
DSCR
20% down · 8.5% · 30yr
- Down + closing
- —
- Monthly P&I
- —
- Monthly cashflow
- —
- DSCR
- —
- Eligible?
- —
No personal income docs; deal must DSCR.
Hard money
10% down · 12.0% · 12mo
- Down + closing
- —
- Monthly P&I
- —
- Monthly cashflow
- —
- DSCR
- —
- Eligible?
- —
Short-term bridge; refi at stabilization.
Rent comps 14 comps
| Address | Beds | Baths | Sqft | Rent | $/sqft | DOM | Units | Dist |
|---|---|---|---|---|---|---|---|---|
| 1275 Central Blvd Brentwood, CA | 3.0 | 2.0 | 1050 | $3,650 | $3.48 | 10d | 1 | 0.18mi |
| 128 Kingfisher St Brentwood, CA | 3.0 | 2.5 | 1667 | $2,990 | $1.79 | 10d | 1 | 0.20mi |
| 1377 Reagan Way Brentwood, CA | 3.0 | 2.5 | 1573 | $3,100 | $1.97 | 1d | 1 | 0.39mi |
| 7251 Brentwood Blvd Brentwood, CA | 1.0–4.0 | 1.0–2.0 | 980 | $2,570 | $2.62 | 1d | 1 | 0.65mi |
| 18 Canterbury Ct Brentwood, CA | 3.0 | 2.0 | 1480 | $3,200 | $2.16 | 1d | 1 | 0.74mi |
| 720 Winding Creek Ter Brentwood, CA | 3.0 | 2.5 | 1531 | $2,900 | $1.89 | 10d | 1 | 0.82mi |
| 103 Dunedin Dr Brentwood, CA | 4.0 | 2.0 | 1260 | $3,269 | $2.59 | 16d | 1 | 0.89mi |
| 936 Yardley Pl Brentwood, CA | 3.0 | 2.5 | 1704 | $3,300 | $1.94 | 3d | 1 | 0.94mi |
| 955 Bighorn Ter Brentwood, CA | 3.0 | 2.5 | 1531 | $3,400 | $2.22 | 19d | 1 | 1.04mi |
| 541 Jacaranda St Brentwood, CA | 4.0 | 2.5 | 1966 | $3,500 | $1.78 | 16d | 1 | 1.06mi |
| 1015 Dellwood Ct Brentwood, CA | 3.0 | 3.0 | 1645 | $3,200 | $1.95 | 23d | 1 | 1.12mi |
| 1100 Twinbridge Ct Brentwood, CA | 3.0 | 2.5 | 1158 | $3,250 | $2.81 | 1d | 1 | 1.17mi |
| 3237 Hudson Dr Brentwood, CA | 4.0 | 3.0 | 2013 | $3,300 | $1.64 | 1d | 1 | 1.18mi |
| 1067 Somersby Way Brentwood, CA | 3.0 | 2.0 | 1973 | $3,695 | $1.87 | 1d | 1 | 1.20mi |
Listing history 11 events
-
2026-06-07status $549,900 Pending 83 DOM
-
2026-06-04days on market $549,900 Active 83 DOM
-
2026-06-03days on market $549,900 Active 82 DOM
-
2026-06-02days on market $549,900 Active 81 DOM
-
2026-06-01days on market $549,900 Active 80 DOM
-
2026-05-31days on market $549,900 Active 79 DOM
-
2026-05-19price $549,900
-
2026-04-30price $585,000
-
2026-03-26status Active
-
2026-03-23status Pending
-
2026-03-10$615,000 Active
ⓘ Source: listings_history table (triggers on properties + properties_extension) + one-shot
backfill from property_details.listing_events for pre-trigger history.
Climate risk First Street
- Flood 7/10 Severe FEMA zone X (unshaded) · 76% chance over 30 yrs
- Wildfire 1/10 Low
- Heat 6/10 Major 7 d/yr ≥102°F today · 14 d/yr by 30 yrs out
- Wind 1/10 Low
- Air quality 9/10 Extreme 17 unhealthy d/yr today · 19 by 30 yrs out
Nearby sold comps map
Loading sold comps map…
Walkable amenities ~0.75 mi
Loading nearby amenities…
Taxation est. · year 1
- Rental income
- $74,484
- − Mortgage interest
- −$30,803
- − Property taxes
- −$8,248
- − Insurance
- −$3,547
- − Repairs & maintenance
- −$5,959
- − Management
- −$5,959
- − Depreciation
- −$15,997
- Taxable income
- $3,971
- Est. tax owed @ 24.0%
- −$953
- After-tax cash flow
- $11,489/yr
For passive investors: Depreciation is non-cash, so a rental often shows a tax loss while cash-flowing — sheltering income. Rental losses are passive: they offset passive income freely, and up to $25,000/yr can offset ordinary (W-2) income if you actively participate and your MAGI is under $100k (phasing out to $0 by $150k); unused losses carry forward. On sale, claimed depreciation is recaptured at up to 25%, and gains may owe capital-gains tax (a 1031 exchange can defer both). Figures are a year-1 estimate at your 24.0% rate — not tax advice; consult a CPA.
Schools (NCES district)
- District
- Brentwood Union Elementary
- NCES district ID
- 0605910
- Math proficiency
- 51% ▲ 1.00%
- Reading proficiency
- 59% ▬ 0.00%
- Median HH income
- $91,644
- Composite
- 52.7/100
- National rank
- #3320
- State rank
- #268 of 1400 in CA
Livability — Brentwood
- Score
- 61/100
- State rank
- #525
- US rank
- #17696
Category grades
Schools grade is shown separately in the Schools card above.
Census & demographics
- Census place
- Brentwood, CA
- County
- Contra Costa County · 1,059,880 people
- City population
- 69,755
- Metro
- San Francisco-Oakland-Berkeley, CA
- Population (ZIP)
- 69,755
- Household income
- $142,223
- Rent vs Own
- Severe rent burden
- 1056.0
Population outlook (Contra Costa County) Hauer SSP2
- Today (2025)
- 1,287,720 people
- By 2030
- 1,364,937 · +6.0%
- By 2040
- 1,506,209 · +17.0%
- By 2050
- 1,624,373 · +26.1%
- By 2075
- 1,853,193 · +43.9%
- By 2100
- 1,901,231 · +47.6%
Race, ethnicity, and origin ACS 2023
- Neighborhood character
- Highly diverse neighborhood (Simpson 0.71)
- Race & ethnicity
- White 43% Hispanic / Latino 25% Asian 16% Two or more races 14% Black 9%
- Hispanic origin (detail)
- Mexican 17%
- Common ancestry
- Italian 3% Russian 2% Romanian 2%
- Foreign-born
- 19% · Canada, China, South Korea
- Languages at home
- 71% English-only · Spanish 13% Other Indo-European 5% Tagalog/Filipino 4%
Political lean MEDSL · Contra Costa
- 2024 margin
- Solid D (+38.0) · D 67.3% · R 29.4% · Other 3.3%
- 2008→2024 swing
- +0.2pp no change · 2008: 37.8pp · 2024: 38.0pp
- All cycles
- 2024: D+38.0 2020: D+45.3 2016: D+43.5 2012: D+33.7 2008: D+37.8
Not yet ingested
- Civics
- —
Market trends
- HPI YoY
- ▼ -245.60%
- Current HPI
- 249.5513
- Rent YoY
- ▲ 5.22%
- Metro
- San Francisco-Oakland-Berkeley, CA
- State GDP YoY
- ▲ 3.21%
- F500 in state
- 116
Industry mix (Fortune 500 HQ in CA)
| Industry | F500 HQs | Revenue |
|---|---|---|
| Technology | 27 | $1,492B |
|
||
| Financial Services | 3 | $174B |
|
||
| Retail | 3 | $44B |
|
||
| Insurance | 3 | $26B |
|
||
| Media / Entertainment | 2 | $115B |
|
||
| Pharmaceuticals / Biotech | 2 | $62B |
|
||
Price history
-10.6% since first listed5 events — show timeline
- 2026-05-19 Price Changed $549,900 bridgeMLS, Bay East AOR, or Contra Costa AOR
- 2026-04-30 Price Changed $585,000 bridgeMLS, Bay East AOR, or Contra Costa AOR
- 2026-03-26 Relisted — bridgeMLS, Bay East AOR, or Contra Costa AOR
- 2026-03-23 Pending — bridgeMLS, Bay East AOR, or Contra Costa AOR
- 2026-03-10 Listed $615,000 bridgeMLS, Bay East AOR, or Contra Costa AOR
Cash-flow waterfall
monthlySold comps — $/sqft
last 12 mo · ≤1 miLoading sold comps…