503 E Main St · Van Buren, IN
Flood risk 1/10 · Minimal
- FEMA flood zone
- X (unshaded)
- Chance of flooding over 30 yrs
- 0.0%
- Est. flood insurance / yr
- $507 – $1,088
Fire risk 1/10 · Minimal
- Est. fire insurance / yr
- $717 – $1,331
Heat risk 3/10 · Minor
- Hot days now (above 100°F)
- 7 days/yr
- Hot days in 30 yrs
- 18 days/yr
Wind risk 2/10 · Minimal
- Chance of severe wind over 30 yrs
- 1.0%
Air-quality risk 3/10 · Minor
- Unhealthy air days now
- 2 days/yr
- Unhealthy air days in 30 yrs
- 3 days/yr
Risk factors via First Street. Map © Google.
Why this score? — see what drove the B+ grade
The composite is a weighted blend of 9 inputs, each scored 0–100. Each bar is that input's sub-score; the figure is the points it added to the 100-point composite (weight × sub-score).
- Cash flow +30.0/30.0
- 1% rule +10.0/10.0
- DSCR +10.0/10.0
- ARV discount +7.5/15.0
- Appreciation +7.3/10.0
- Schools +3.8/10.0
- Livability +3.0/5.0
- Rent growth +2.5/5.0
- Condition / age +2.5/5.0
$31,200
🖨 Deal sheet 📄 Offer letter ✓ Due diligence
Listing remarks
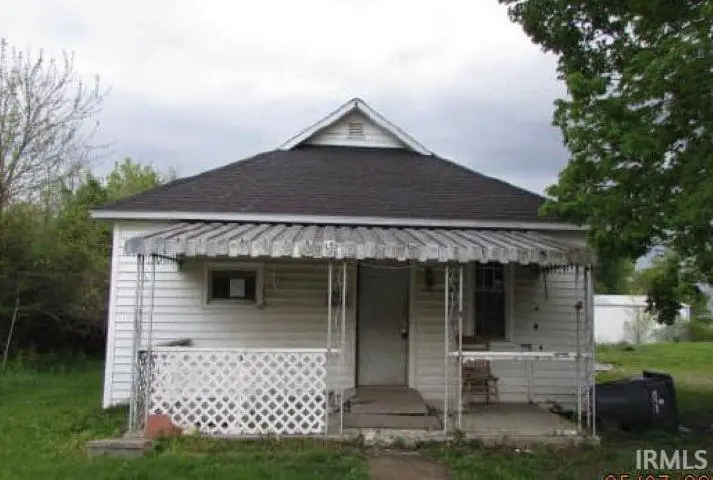
Great opportunity to buy this one story home built in 1940, located in Van Buren, IN and coming with an acre of land with an attached 2 car garage and a polebarn. The interior has 1186 sq. ft. with 2 bedrooms and 1 bathroom.
Key facts
- Acre of land
- One story home
- Interior 1186 sq ft
Tags
Property features AI
Finance
- Other: Property type: Residential
Exterior
- Parking: Attached 2-car garage
- Utilities: Public water; Public sewer
- Home design: Single-story single family home; Site-built residence
- Construction: Wood siding exterior
- Exterior features: Level lot; Lot dimensions approximately 132 x 132 and 198 x 132; Approximately 1 acre parcel; Subdivision: Van Buren
Interior
- Bathrooms: 1 full bathroom (main level)
- Heating & cooling: Natural gas heating; No cooling
- Interior features: Crawl space basement; 5 total rooms
Neighborhood map
What this means for you Summary
Snapshot
- This is a 2-bed/1.0-bath single-family listed at $31k.
Deal economics
- At list price, monthly cash flow is $591 ($7k/yr) — positive.
- The deal already cash-flows at list — no discount required.
- Meets the 1% rule at list price ($1k rent vs $31k).
- Recommended offer: $31k (1.5% below list) — sets the bar for market timing.
Location & tenants
- Location reads 60/100 on livability (#529 in IN) — a middle-class / working-renter tenant base. Strengths: cost of living A+, housing A-; Watch: health & safety C-, crime D, amenities F.
- Eastbrook Community School Corporation (rural): math 42% / reading 46% proficiency, ranked #98 of 301 in IN (top 33%) — families likely to look elsewhere, expect single-tenant / working-renter base with shorter leases.
- Zoned schools: Eastbrook North Elementary (math 43% / reading 34%, grade F, #535 of 994 statewide, top 54%, 307 students, 52% FRL); Eastbrook Middle School (math 30% / reading 45%, grade F, #146 of 330 statewide, top 46%, 399 students, 48% FRL); Eastbrook High School (math 52% / reading 72%, grade B-, #41 of 369 statewide, top 12%, 509 students, 38% FRL).
- Market conditions: 9 active listings in the ZIP; 52 units permitted in Grant County in 2024 (8 in 5+ unit buildings).
Forward outlook
- In year one you build about $2k of equity ($216 loan paydown + $1k appreciation (4.6% local appreciation)).
- Grant County population projected at -18% by 2050 — secular population decline; favor cash flow + early exit over multi-decade hold.
- At projected returns (4.6% appreciation + 3.0% rent growth), your $9k cash investment doubles in ~1 year — after that, you're playing with house money.
Negotiation context
- It's been on market 27 days — a 2% lower offer ($31k) is reasonable based on typical stale-listing flexibility.
- 6 sale attempts with the ask held roughly flat each time — persistent listings suggest the price (not the market) is what's stuck; bring a comps-based counter.
Risks & watch-outs
- Watch-outs: built in 1940 — expect roof / HVAC / electrical / plumbing capex.
Questions for the listing agent
- Built in 1940 — when were the roof, HVAC, electrical panel, plumbing, and water heater last replaced?
- Is there a deadline driving the sale (1031 exchange, divorce, estate, relocation)? That informs how much negotiation room exists.
- Schools are D-rated, which usually means shorter tenancies and higher turnover. Who's the typical renter profile here, and what's been the actual vacancy rate?
- Crime grade is D in this area — have there been break-ins, vandalism, or insurance claims at this property in the last 3 years? What carrier currently insures it and at what premium?
- What's the average days-on-market for RENTAL listings here right now (not sales)? A rising rental-DOM trend means longer vacancies and softer asking-rent achievability than the comps imply.
- What's the recent tenant-quality profile in this submarket — average credit score on applications, eviction rate, late-payment / NSF rate, and stable-employment percentage? A property-management company in the area should have these aggregated.
- How much new for-sale + rental construction is in the pipeline within 1–3 miles? Heavy new supply typically softens prices + rents 12–24 months out; constrained supply supports both.
Investment metrics
- 1% rule
- 3.27% ✓
- Cap rate
- 29.01%
- Cash-on-cash
- 81.13%
- DSCR
- 4.61
- GRM
- 2.5
CMA / ARV
- ARV (on-the-fly)
- $91,322
- Comps found
- 4
Show comp detail 4 sales within ~0.75 mi
| Address | Dist | Beds/Ba | Sqft | Sold | Price | $/sf | Match |
|---|---|---|---|---|---|---|---|
| 603 W Main St | 0.65mi | 3/1.0 (+1) | 1,261 (+6%) | 1mo | $79,900 | $63 | 54 |
| 310 E Jefferson Ct | 0.24mi | 3/1.0 (+1) | 1,040 (-12%) | 21mo | $131,500 | $126 | 45 |
| 202 S Second St | 0.40mi | 2/1.0 | 1,038 (-12%) | 23mo | $80,000 | $77 | 42 |
| 9419 E 400 N | 0.54mi | 3/1.0 (+1) | 1,067 (-10%) | 21mo | $65,000 | $61 | 36 |
Match score weights: distance 35% · size 25% · config 20% · recency 20%. Top-matched comps best support the ARV.
Projected returns pro-forma
4.61% appreciation · 3.0% rent growth · sell at horizon
- IRR
- 86.8%
- Equity multiple
- 6.05×
- Total profit
- $44,143
- Equity at exit
- $16,954
- IRR
- 85.2%
- Equity multiple
- 12.59×
- Total profit
- $101,294
- Equity at exit
- $28,678
Cash invested: $8,736 (down + closing). Projections, not guarantees.
Landlord ↔ Tenant lean methodology
- Overall (STATE)
- 90 Strongly Landlord-Friendly
- State Indiana
- 90 Strongly Landlord-Friendly · R+11
- County
- — inherits STATE
- City
- — inherits STATE
ZIP-level market 46991
- Home prices YoY
- 2.4%
- Active inventory
- 9
- Price-to-rent
- 2.5×
Monthly cashflow live
- Estimated rent
- $1,021 medium interval (Pro) →
- Mortgage (P&I)
- −$164
- Tax est. 1.5%
- −$39 /mo · $468/yr
- Insurance
- −$13
- HOA
- −$0
- Vacancy / Maint / Mgmt
- −$214
- Net cashflow
- $591
Break-even live
UW: 25.0% down · 7.5% · 30yr · 1.5% tax · 5.0% vac · 8.0% maint · 8.0% mgmt
Financing live
Cash to close
- Down payment
- $7,800
- Closing costs
- $936
- Reserves months
- —
- Total cash needed
- —
Loan-product check · same deal, 3 products live
Conventional
25% down · 7.5% · 30yr
- Down + closing
- —
- Monthly P&I
- —
- Monthly cashflow
- —
- DSCR
- —
- Eligible?
- —
Personal DTI + credit; lowest rate.
DSCR
20% down · 8.5% · 30yr
- Down + closing
- —
- Monthly P&I
- —
- Monthly cashflow
- —
- DSCR
- —
- Eligible?
- —
No personal income docs; deal must DSCR.
Hard money
10% down · 12.0% · 12mo
- Down + closing
- —
- Monthly P&I
- —
- Monthly cashflow
- —
- DSCR
- —
- Eligible?
- —
Short-term bridge; refi at stabilization.
Listing history 26 events
-
2026-06-19status $31,200 Pending 27 DOM
-
2026-06-18days on market $31,200 Active 27 DOM
-
2026-06-17days on market $31,200 Active 26 DOM
-
2026-06-16days on market $31,200 Active 25 DOM
-
2026-06-15days on market $31,200 Active 24 DOM
-
2026-06-14days on market $31,200 Active 22 DOM
-
2026-06-12days on market $31,200 Active 21 DOM
-
2026-06-09days on market $31,200 Active 18 DOM
-
2026-06-08days on market $31,200 Active 17 DOM
-
2026-06-07days on market $31,200 Active 16 DOM
-
2026-06-05days on market $31,200 Active 13 DOM
-
2026-06-03days on market $31,200 Active 12 DOM
-
2026-06-02days on market $31,200 Active 11 DOM
-
2026-06-01days on market $31,200 Active 10 DOM
-
2026-05-31days on market $31,200 Active 9 DOM
-
2026-05-30days on market $31,200 Active 8 DOM
-
2026-05-22$31,200 Active
-
2025-12-10status Active
-
2025-10-02status Pending
-
2025-10-02status Active
-
2025-08-23status Active
-
2025-08-23historical
-
2025-08-13price $70,000
-
2025-08-06price $100,000
-
2025-07-28status Active
-
2025-07-26$120,000 Active
ⓘ Source: listings_history table (triggers on properties + properties_extension) + one-shot
backfill from property_details.listing_events for pre-trigger history.
Climate risk First Street
- Flood 1/10 Low FEMA zone X (unshaded) · 0% chance over 30 yrs
- Wildfire 1/10 Low
- Heat 3/10 Moderate 7 d/yr ≥100°F today · 18 d/yr by 30 yrs out
- Wind 2/10 Low 100% chance of damaging wind over 30 yrs
- Air quality 3/10 Moderate 2 unhealthy d/yr today · 3 by 30 yrs out
Nearby sold comps map
Loading sold comps map…
Walkable amenities ~0.75 mi
Loading nearby amenities…
Taxation est. · year 1
- Rental income
- $12,247
- − Mortgage interest
- −$1,748
- − Property taxes
- −$468
- − Insurance
- −$156
- − Repairs & maintenance
- −$980
- − Management
- −$980
- − Depreciation
- −$908
- Taxable income
- $7,008
- Est. tax owed @ 24.0%
- −$1,682
- After-tax cash flow
- $5,406/yr
For passive investors: Depreciation is non-cash, so a rental often shows a tax loss while cash-flowing — sheltering income. Rental losses are passive: they offset passive income freely, and up to $25,000/yr can offset ordinary (W-2) income if you actively participate and your MAGI is under $100k (phasing out to $0 by $150k); unused losses carry forward. On sale, claimed depreciation is recaptured at up to 25%, and gains may owe capital-gains tax (a 1031 exchange can defer both). Figures are a year-1 estimate at your 24.0% rate — not tax advice; consult a CPA.
Schools (NCES district)
- District
- Eastbrook Community School Corporation
- NCES district ID
- 1803030
- Math proficiency
- 42% ▬ 0.00%
- Reading proficiency
- 46% ▼ -1.00%
- Median HH income
- $55,030
- Composite
- 38.28/100
- National rank
- #4234
- State rank
- #98 of 301 in IN
Livability — Van Buren
- Score
- 60/100
- State rank
- #529
- US rank
- #19010
Category grades
Schools grade is shown separately in the Schools card above.
Census & demographics
- Census place
- Van Buren, IN
- Population (ZIP)
- 1,657
Population outlook (Grant County) Hauer SSP2
- Today (2025)
- 64,394 people
- By 2030
- 62,145 · -3.5%
- By 2040
- 57,252 · -11.1%
- By 2050
- 52,968 · -17.7%
- By 2075
- 45,986 · -28.6%
- By 2100
- 39,400 · -38.8%
Race, ethnicity, and origin ACS 2023
- Neighborhood character
- Predominantly White (90%)
- Race & ethnicity
- White 90% Two or more races 7% Hispanic / Latino 3%
- Common ancestry
- Serbian 2% Slovak 1% Lithuanian 1%
- Foreign-born
- 1% · Canada
- Languages at home
- 98% English-only · Spanish 1%
Political lean MEDSL · Grant
- 2024 margin
- Solid R (+41.8) · D 28.2% · R 70.0% · Other 1.9%
- 2008→2024 swing
- -28.7pp toward R · 2008: -13.1pp · 2024: -41.8pp
- All cycles
- 2024: R+41.8 2020: R+38.8 2016: R+39.5 2012: R+22.0 2008: R+13.1
Not yet ingested
- Civics
- —
Market trends
- HPI YoY
- ▲ 4.61%
- Current HPI
- 193.7506
- Rent YoY
- —
- Metro
- —
- State GDP YoY
- ▲ 2.90%
- F500 in state
- 18
Industry mix (Fortune 500 HQ in IN)
| Industry | F500 HQs | Revenue |
|---|---|---|
| Industrial Machinery | 2 | $37B |
|
||
| Healthcare | 1 | $177B |
|
||
| Pharmaceuticals | 1 | $45B |
|
||
| Metals / Steel | 1 | $18B |
|
||
| Agriculture | 1 | $17B |
|
||
| Packaging | 1 | $12B |
|
||
Price history
-74.0% since first listed10 events — show timeline
- 2026-05-22 Listed $31,200 IRMLS
- 2025-12-10 Relisted — IRMLS
- 2025-10-02 Pending — IRMLS
- 2025-10-02 Relisted — IRMLS
- 2025-08-23 Relisted — IRMLS
- 2025-08-23 Delisted — IRMLS
- 2025-08-13 Price Changed $70,000 IRMLS
- 2025-08-06 Price Changed $100,000 IRMLS
- 2025-07-28 Relisted — IRMLS
- 2025-07-26 Listed $120,000 IRMLS
Property tax history
+10.6%/yrLatest (2025): $1,715 · +10.6% YoY. Source: county tax records.
Cash-flow waterfall
monthlySold comps — $/sqft
last 12 mo · ≤1 miLoading sold comps…