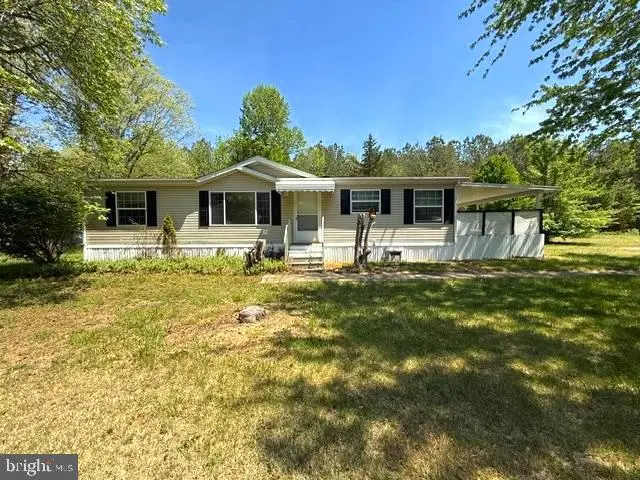
49 Nevada Ave · Harrington, DE
Flood risk 1/10 · Minimal
- FEMA flood zone
- X (unshaded)
- Chance of flooding over 30 yrs
- 0.0%
- Est. flood insurance / yr
- $507 – $1,088
Fire risk 2/10 · Minimal
- Est. fire insurance / yr
- $476 – $884
Heat risk 8/10 · Major
- Hot days now (above 102°F)
- 7 days/yr
- Hot days in 30 yrs
- 16 days/yr
Wind risk 6/10 · Moderate
- Chance of severe wind over 30 yrs
- 60.0%
Air-quality risk 2/10 · Minimal
- Unhealthy air days now
- 1 days/yr
- Unhealthy air days in 30 yrs
- 1 days/yr
Risk factors via First Street. Map © Google.
Why this score? — see what drove the C grade
The composite is a weighted blend of 9 inputs, each scored 0–100. Each bar is that input's sub-score; the figure is the points it added to the 100-point composite (weight × sub-score).
- Cash flow +20.2/30.0
- 1% rule +10.0/10.0
- ARV discount +7.5/15.0
- DSCR +6.4/10.0
- Appreciation +4.0/10.0
- Livability +3.7/5.0
- Schools +3.0/10.0
- Rent growth +2.5/5.0
- Condition / age +2.5/5.0
$119,900
🖨 Deal sheet (PDF) 📄 Offer letter ✓ Due diligence
Listing remarks
Turnkey 3 Bd 2 Full Bath Home sitting a private cul de sac of 4 Homes on a . 7 acre Premium Homesite backing to woodlands. This 2005 Skyline Manufactured Home with 1428 Sq Ft of Living space has been recently upgraded with all new LVP flooring, carpet and pad throughout the Home. You enter the Home and it features a vast Great room with a Picture window, Vaulted ceiling and an Entertainment nook. The Center Island eat in Kitchen features all wood Cabinets, updated appliances, with a New Whirlpool Refrigerator/freezer, ceramic top range with a vented range hood, a Samsung D/W & Microwave, plus a full sized Pantry. There is a well sized Breakfast room with a BOW window with floor to
Key facts
- 0.7 acre lot
- 3 parking spots
- Built 2005
Property features AI
Finance
- Other: Property manager present; Not in a federal flood zone; Pets allowed with breed restrictions; Located in a rural setting; commuter lots and bus stop nearby
- Financial info: Land lease with approximately 1 year remaining
- HOA & community: HOA fee $451 monthly; HOA includes water, sewer, trash, snow removal, and road maintenance; Ground rent exists ($450 monthly)
Exterior
- Parking: Driveway parking; Three total driveway/parking spaces; Paved parking
- Utilities: Well water; Public septic; 200+ amp electrical service with circuit breakers; Propane community service; Cable TV available
- Home design: Manufactured double-wide home (Skyline Greenbriar 5628-CTH); Estimated year of major remodel 2025; Main entrance faces south; Entry level on main floor; Land lease ownership
- Construction: Aluminum siding; Asbestos shingle roof; Double-pane, energy-efficient windows; Shed and shed shop on site; No basement
- Exterior features: Patio(s); Porch(es); Exterior lighting; Street lights; Backs to trees; Level lot; Partly wooded; Secluded setting; No thru street; Premium lot
Interior
- Kitchen: ENERGY STAR refrigerator; ENERGY STAR dishwasher; Built-in microwave; Microwave; Electric oven/range; Range hood; Pantry
- Bedrooms: Master Bedroom (main level); Bedroom 2 (main level); Bedroom 3 (main level); Three bedrooms on the main level
- Flooring: Carpet
- Bathrooms: Two full bathrooms (both on the main level)
- Heating & cooling: Forced air heating with propane (metered); Programmable thermostat; Central air conditioning; Ceiling fans; Electric hot water
- Interior features: Open floor plan; Breakfast area; Kitchen eat-in with island and table space; Butler's pantry; Built-ins; Walk-in closet(s); Master bath(s); Bathroom with walk-in shower; Stall shower; Tub/shower; Family room off kitchen; Window treatments; Ceiling fan(s); Entry-level bedroom
- Laundry & utility: Washer in unit (main floor); Dryer in unit, electric (main floor)
Neighborhood map
What this means for you Summary
Snapshot
- This is a 3-bed/2.0-bath manufactured listed at $120k.
Deal economics
- At list price, monthly cash flow is $151 ($2k/yr) — positive.
- The deal already cash-flows at list — no discount required.
- Meets the 1% rule at list price ($2k rent vs $120k).
- Recommended offer: $116k (3.0% below list) — sets the bar for market timing.
- Cap rate 7.8% vs local median 3.5% in Harrington — top-decile yield for the area; either an underpriced asset or a hidden risk that comps aren't pricing in. Stress-test before assuming the spread holds.
Location & tenants
- Location reads 73/100 on livability (#9 in DE) — a middle-class / working-renter tenant base. Strengths: cost of living A+, housing A+, health & safety A+; Watch: schools C-, crime D+, amenities F.
- Lake Forest School District (rural): math 26% / reading 44% proficiency, ranked #13 of 26 in DE (top 50%) — families likely to look elsewhere, expect single-tenant / working-renter base with shorter leases.
- Market conditions: 75 active listings in the ZIP; 2 comparable units currently listed for rent nearby; 1,201 units permitted in Kent County in 2024 (116 in 5+ unit buildings).
Forward outlook
- Local home prices are declining (-2.1%/yr); year-one equity from $829 of loan paydown is wiped out by about $2k of value loss. Plan a longer hold.
- Kent County population projected at +22% by 2050 — long-run rental-demand tailwind backs the buy-and-hold thesis.
Negotiation context
- It's been on market 39 days — a 3% lower offer ($116k) is reasonable based on typical stale-listing flexibility.
Risks & watch-outs
- Watch-outs: HOA is 25% of rent.
- Climate carrying-cost: major wind risk, 60% chance of damaging wind over 30y; extreme-heat days projected 7→16/yr by 2055 (HVAC capex compounding) — expect insurance premiums to compound above CPI over the hold.
Questions for the listing agent
- It's been on market 39 days. Have you received any prior offers? Is the seller open to a 3% concession, seller financing, or rate buy-down credit?
- What does the HOA fee cover, when was the last increase, and are there any pending special assessments or reserve-fund shortfalls?
- Is there a deadline driving the sale (1031 exchange, divorce, estate, relocation)? That informs how much negotiation room exists.
- Crime grade is D in this area — have there been break-ins, vandalism, or insurance claims at this property in the last 3 years? What carrier currently insures it and at what premium?
- What's the average days-on-market for RENTAL listings here right now (not sales)? A rising rental-DOM trend means longer vacancies and softer asking-rent achievability than the comps imply.
- What's the recent tenant-quality profile in this submarket — average credit score on applications, eviction rate, late-payment / NSF rate, and stable-employment percentage? A property-management company in the area should have these aggregated.
- How much new for-sale + rental construction is in the pipeline within 1–3 miles? Heavy new supply typically softens prices + rents 12–24 months out; constrained supply supports both.
Investment metrics
- 1% rule
- 1.51% ✓
- Cap rate
- 7.81%
- Cash-on-cash
- 5.41%
- DSCR
- 1.24
- GRM
- 5.5
CMA / ARV
- ARV (median comp)
- $287,433
- List price
- $119,900
- Delta
- -58.29%
- Verdict
- UNDERPRICED
- Comps
- 20 within 1.0 mi
Projected returns pro-forma
-2.07% appreciation · 3.0% rent growth · sell at horizon
- IRR
- -3.5%
- Equity multiple
- 0.86×
- Total profit
- $-4,750
- Equity at exit
- $22,909
- IRR
- 4.9%
- Equity multiple
- 1.41×
- Total profit
- $13,723
- Equity at exit
- $19,219
Cash invested: $33,572 (down + closing). Projections, not guarantees.
Landlord ↔ Tenant lean methodology
- Overall (STATE)
- 70 Landlord-Friendly
- State Delaware
- 70 Landlord-Friendly · D+7
- County
- — inherits STATE
- City
- — inherits STATE
ZIP-level market 19952
- Home prices YoY
- -0.8%
- Active inventory
- 75
- Price-to-rent
- 5.5×
Monthly cashflow live
- Estimated rent
- $1,811 medium interval (Pro) →
- Mortgage (P&I)
- −$629
- Tax est. 1.5%
- −$150 /mo · $1,798/yr
- Insurance
- −$50
- HOA
- −$451
- Vacancy / Maint / Mgmt
- −$380
- Net cashflow
- $151
Break-even live
Sensitivity live
| Price | -10% $234 | -5% $193 | +0% $151 | +5% $110 | +10% $69 |
|---|---|---|---|---|---|
| Rent | -10% $8 | -5% $80 | +0% $151 | +5% $223 | +10% $295 |
| Rate | -1.0pp $212 | -0.5pp $182 | base $151 | +0.5pp $120 | +1.0pp $89 |
UW: 25.0% down · 7.5% · 30yr · 1.5% tax · 5.0% vac · 8.0% maint · 8.0% mgmt
Financing live
Cash to close
- Down payment
- $29,975
- Closing costs
- $3,597
- Reserves months
- —
- Total cash needed
- —
Loan-product check · same deal, 3 products live
Conventional
25% down · 7.5% · 30yr
- Down + closing
- —
- Monthly P&I
- —
- Monthly cashflow
- —
- DSCR
- —
- Eligible?
- —
Personal DTI + credit; lowest rate.
DSCR
20% down · 8.5% · 30yr
- Down + closing
- —
- Monthly P&I
- —
- Monthly cashflow
- —
- DSCR
- —
- Eligible?
- —
No personal income docs; deal must DSCR.
Hard money
10% down · 12.0% · 12mo
- Down + closing
- —
- Monthly P&I
- —
- Monthly cashflow
- —
- DSCR
- —
- Eligible?
- —
Short-term bridge; refi at stabilization.
Rent comps 2 comps
| Address | Beds | Baths | Sqft | Rent | $/sqft | DOM | Units | Dist |
|---|---|---|---|---|---|---|---|---|
| 2A E Milby St Harrington, DE | 2.0 | 1.0 | 1500 | $1,600 | $1.07 | 45d | 1 | 0.97mi |
| 219 S West St Harrington, DE | 3.0 | 2.0 | 1848 | $2,100 | $1.14 | 45d | 1 | 1.08mi |
HOA detail
- Monthly dues
- $451 · $5,412/yr
- Likely covers
- pool
Listing history 20 events
-
2026-06-21days on market $119,900 Active 39 DOM
-
2026-06-19days on market $119,900 Active 37 DOM
-
2026-06-18days on market $119,900 Active 36 DOM
-
2026-06-17days on market $119,900 Active 35 DOM
-
2026-06-16days on market $119,900 Active 34 DOM
-
2026-06-15days on market $119,900 Active 33 DOM
-
2026-06-14days on market $119,900 Active 31 DOM
-
2026-06-13days on market $119,900 Active 30 DOM
-
2026-06-10days on market $119,900 Active 28 DOM
-
2026-06-09days on market $119,900 Active 27 DOM
-
2026-06-08days on market $119,900 Active 26 DOM
-
2026-06-07days on market $119,900 Active 25 DOM
-
2026-06-05days on market $119,900 Active 22 DOM
-
2026-06-03days on market $119,900 Active 21 DOM
-
2026-06-02days on market $119,900 Active 20 DOM
-
2026-06-01days on market $119,900 Active 19 DOM
-
2026-05-31days on market $119,900 Active 18 DOM
-
2026-05-30days on market $119,900 Active 17 DOM
-
2026-05-13$119,900 Active 1393-char remark
-
2026-05-12historical $119,900 1393-char remark
ⓘ Source: listings_history table (triggers on properties + properties_extension) + one-shot
backfill from property_details.listing_events for pre-trigger history.
Climate risk First Street
- Flood 1/10 Low FEMA zone X (unshaded) · 0% chance over 30 yrs
- Wildfire 2/10 Low
- Heat 8/10 Severe 7 d/yr ≥102°F today · 16 d/yr by 30 yrs out
- Wind 6/10 Major 60% chance of damaging wind over 30 yrs
- Air quality 2/10 Low 1 unhealthy d/yr today · 1 by 30 yrs out
Nearby sold comps map
Loading sold comps map…
Walkable amenities ~0.75 mi
Loading nearby amenities…
Taxation est. · year 1
- Rental income
- $21,737
- − Mortgage interest
- −$6,716
- − Property taxes
- −$1,798
- − Insurance
- −$600
- − Repairs & maintenance
- −$1,739
- − Management
- −$1,739
- − HOA
- −$5,412
- − Depreciation
- −$3,488
- Taxable income
- $245
- Est. tax owed @ 24.0%
- −$59
- After-tax cash flow
- $1,758/yr
For passive investors: Depreciation is non-cash, so a rental often shows a tax loss while cash-flowing — sheltering income. Rental losses are passive: they offset passive income freely, and up to $25,000/yr can offset ordinary (W-2) income if you actively participate and your MAGI is under $100k (phasing out to $0 by $150k); unused losses carry forward. On sale, claimed depreciation is recaptured at up to 25%, and gains may owe capital-gains tax (a 1031 exchange can defer both). Figures are a year-1 estimate at your 24.0% rate — not tax advice; consult a CPA.
Schools (NCES district)
- District
- Lake Forest School District
- NCES district ID
- 1000790
- Math proficiency
- 26% ▼ -23.00%
- Reading proficiency
- 44% ▼ -14.00%
- Median HH income
- $52,034
- Composite
- 30.47/100
- National rank
- #6225
- State rank
- #13 of 26 in DE
Livability — Harrington
- Score
- 73/100
- State rank
- #9
- US rank
- #5270
Category grades
Schools grade is shown separately in the Schools card above.
Census & demographics
- Census place
- Harrington, DE
- Population (ZIP)
- 10,730
Population outlook (Kent County) Hauer SSP2
- Today (2025)
- 194,477 people
- By 2030
- 204,351 · +5.1%
- By 2040
- 222,135 · +14.2%
- By 2050
- 236,483 · +21.6%
- By 2075
- 266,327 · +36.9%
- By 2100
- 275,335 · +41.6%
Race, ethnicity, and origin ACS 2023
- Neighborhood character
- Predominantly White (84%)
- Race & ethnicity
- White 84% Black 8% Hispanic / Latino 5% Two or more races 4% Asian 1%
- Hispanic origin (detail)
- Mexican 2% Puerto Rican 3%
- Common ancestry
- Slovak 2% Romanian 1% Portuguese 1%
- Foreign-born
- 3% · Canada, Vietnam, South Korea
- Languages at home
- 93% English-only · Spanish 4% Vietnamese 1% German/W. Germanic 1%
Political lean MEDSL · Kent
- 2024 margin
- Toss-up / Even · D 50.2% · R 48.2% · Other 1.7%
- 2008→2024 swing
- -7.8pp toward R · 2008: 9.8pp · 2024: 2.0pp
- All cycles
- 2024: D+2.0 2020: D+4.1 2016: R+4.9 2012: D+4.9 2008: D+9.8
Not yet ingested
- Civics
- —
Market trends
- HPI YoY
- ▼ -2.07%
- Current HPI
- 268.56
- Rent YoY
- —
- Metro
- —
- State GDP YoY
- —
- F500 in state
- 0
Price history
+0.0% since first listed2 events — show timeline
- 2026-05-13 Listed $119,900 BRIGHT MLS
- 2026-05-12 Coming Soon $119,900 BRIGHT MLS
Property tax history
-6.9%/yrLatest (2025): $235 · +0.4% YoY. Source: county tax records.
Cash-flow waterfall
monthlySold comps — $/sqft
last 12 mo · ≤1 miLoading sold comps…