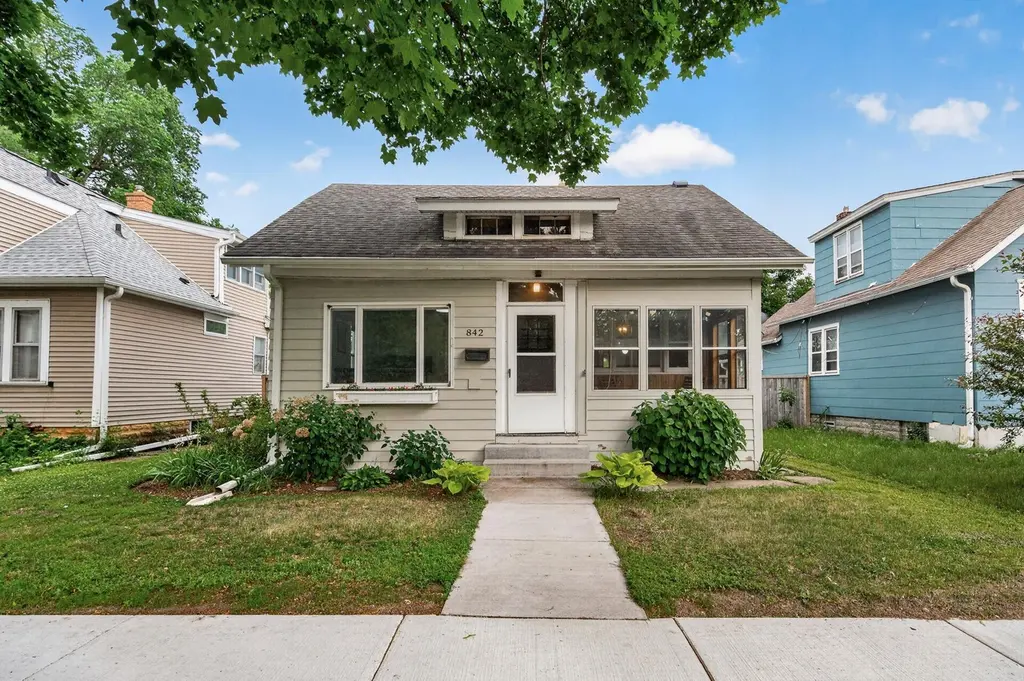
842 Randolph Ave · St. Paul, MN
Flood risk 5/10 · Moderate
- FEMA flood zone
- X (unshaded)
- Chance of flooding over 30 yrs
- 0.66%
- Est. flood insurance / yr
- $473 – $860
Fire risk 1/10 · Minimal
- Est. fire insurance / yr
- $888 – $1,650
Heat risk 2/10 · Minimal
- Hot days now (above 100°F)
- 7 days/yr
- Hot days in 30 yrs
- 14 days/yr
Wind risk 2/10 · Minimal
- Chance of severe wind over 30 yrs
- —
Air-quality risk 2/10 · Minimal
- Unhealthy air days now
- 1 days/yr
- Unhealthy air days in 30 yrs
- 1 days/yr
Risk factors via First Street. Map © Google.
Why this score? — see what drove the D grade
The composite is a weighted blend of 9 inputs, each scored 0–100. Each bar is that input's sub-score; the figure is the points it added to the 100-point composite (weight × sub-score).
- Cash flow +17.0/30.0
- ARV discount +7.5/15.0
- DSCR +5.3/10.0
- 1% rule +4.6/10.0
- Rent growth +2.9/5.0
- Livability +2.5/5.0
- Condition / age +2.5/5.0
- Schools +2.4/10.0
- Appreciation +0.0/10.0
$274,900
🖨 Deal sheet (PDF) 📄 Offer letter ✓ Due diligence
Listing remarks MLS
This darling 2 BR has immense old world charm & numerous updates. Gorgeous maple floors on the main level, new carpet up & fresh paint throughout! New kitchen with stainless appliances, range hood, cabinets, sink, walnut butcher block counters & new cork floor. New bath with subway tile, vanity, dual-flush toilet and new tile floor. Garage was taken down to the studs and re-done – new roof, HardiPanel siding, overhead door & opener, and electrical wiring was brought up to code. Front porch, back deck, privacy fenced deep backyard. Main floor BR in non-conforming. Please see supplements for all updates.
Key facts
- 5,967 sq ft lot
- Garage
- Built 1913
Property features AI
Finance
- Other: Above-grade finished area approximately 1,127; Below-grade area approximately 443; Total building area about 1,570; Lot dimensions about 40 x 150 (approximately 0.137 acre); Publicly maintained road frontage
Exterior
- Parking: Gravel parking; Detached 1-car garage (22 x 16)
- Utilities: City water connected; City sewer connected; Natural gas; 100 Amp electrical service with circuit breakers
- Home design: Residential property; One and one-half levels; Front-facing entry
- Construction: Block construction; Block foundation; Asphalt shingle roof (over 8 years old); Built with a foundation area of approximately 773 and foundation dimensions 36 x 24
- Exterior features: Covered deck and front porch; Patio; Full fencing; Tree coverage (light); Public transit within about 6 blocks; Sidewalks and paved city streets
Interior
- Kitchen: Range; Refrigerator; Freezer
- Bedrooms: Two bedrooms (one on main floor, one upper-level)
- Flooring: Hardwood floors
- Bathrooms: One full bathroom on the main floor
- Heating & cooling: Boiler heating; Window air conditioning units
- Interior features: Hardwood floors; Paneled doors; Informal dining room; Kitchen window; City view
- Laundry & utility: Washer and dryer (washer hookup and gas dryer hookup in basement); Washer/Dryer hookup
Neighborhood map
What this means for you Summary
Snapshot
- This is a 2-bed/1.0-bath single-family listed at $275k.
Deal economics
- At list price, monthly cash flow is $187 ($2k/yr) — positive.
- The deal already cash-flows at list — no discount required.
- To meet the 1% rule (rent ≥ 1% of price), the offer needs to be $264k (3.9% below list).
- Recommended offer: $264k (3.9% below list) — sets the bar for 1% rule.
Location & tenants
- Location reads: area grade D — affects rentability + tenant quality, not the cash-flow math above.
- St. Paul Public School District (urban): math 21% / reading 33% proficiency, ranked #270 of 301 in MN (top 90%) — low school quality limits family demand, transient renter base, plan for 1-2y turnover; 64% free/reduced lunch — lower-income household profile, screen leases tightly.
- Zoned schools: Adams Magnet Elementary (math 32% / reading 42%, grade F, #636 of 857 statewide, top 76%, 496 students, 43% FRL); Highland Park Middle School (math 27% / reading 44%, grade F, #172 of 258 statewide, top 68%, 805 students, 53% FRL); Highland Park Senior High (math 44% / reading 62%, grade C-, #107 of 471 statewide, top 23%, 1,390 students, 47% FRL) — zoned schools average 48% FRL vs 64% district-wide (16 pts lower); this property's tenant base skews higher-income than the district average.
- Zoned-school proficiency averages 42% at this address vs 27% district-wide (+15 pts) — the actual schools serving this property are materially stronger than the St. Paul Public School District average implies; a family-tenant draw the district grade alone would hide.
- Market conditions: Rents rising (+1.6%/yr); 148 active listings in the ZIP; 5 comparable units currently listed for rent nearby; rentals leasing fast (median 1d on market — plan ~1-2 weeks tenant-placement turnaround); solid renter incomes; 1,202 units permitted in Ramsey County in 2024 (880 in 5+ unit buildings).
- This rent runs 42% of the median local income ($76k/yr) — at the standard rent-burdened threshold; future hikes will face affordability resistance.
Forward outlook
- Local home prices are declining (-3.0%/yr); year-one equity from $2k of loan paydown is wiped out by about $8k of value loss. Plan a longer hold.
- Ramsey County population projected at +27% by 2050 — long-run rental-demand tailwind backs the buy-and-hold thesis.
Negotiation context
- Only 10 days on market — expect competitive offers; lowballing is unlikely to land.
- 3 sale attempts since 13y ago; this cycle's ask is 25% above the opening price — seller raised mid-cycle; expect resistance to lowballs.
Risks & watch-outs
- Watch-outs: built in 1913 — expect roof / HVAC / electrical / plumbing capex.
- Climate carrying-cost: moderate flood risk — expect insurance premiums to compound above CPI over the hold.
Questions for the listing agent
- Built in 1913 — when were the roof, HVAC, electrical panel, plumbing, and water heater last replaced?
- Is there a deadline driving the sale (1031 exchange, divorce, estate, relocation)? That informs how much negotiation room exists.
- The area grade is low — what's the realistic commute time and amenity access for the typical tenant pool here? Any planned neighborhood developments (good or bad) we should know about?
- What's the average days-on-market for RENTAL listings here right now (not sales)? A rising rental-DOM trend means longer vacancies and softer asking-rent achievability than the comps imply.
- What's the recent tenant-quality profile in this submarket — average credit score on applications, eviction rate, late-payment / NSF rate, and stable-employment percentage? A property-management company in the area should have these aggregated.
- How much new for-sale + rental construction is in the pipeline within 1–3 miles? Heavy new supply typically softens prices + rents 12–24 months out; constrained supply supports both.
Investment metrics
- 1% rule
- 0.96% ✗
- Cap rate
- 7.11%
- Cash-on-cash
- 2.92%
- DSCR
- 1.13
- GRM
- 8.7
CMA / ARV
No comps found within radius.
Projected returns pro-forma
-3.0% appreciation · 1.6% rent growth · sell at horizon
- IRR
- -13.3%
- Equity multiple
- 0.53×
- Total profit
- $-36,237
- Equity at exit
- $40,988
- IRR
- -6.6%
- Equity multiple
- 0.60×
- Total profit
- $-30,664
- Equity at exit
- $23,768
Cash invested: $76,972 (down + closing). Projections, not guarantees.
Landlord ↔ Tenant lean methodology
- Overall (STATE)
- 46 Balanced
- State Minnesota
- 46 Balanced · D+2
- County
- — inherits STATE
- City
- — inherits STATE
ZIP-level market 55102
- Rents YoY
- 1.6%
- Active inventory
- 148
- Price-to-rent
- 8.7×
Monthly cashflow live
- Estimated rent
- $2,643 high interval (Pro) →
- Mortgage (P&I)
- −$1,442
- Tax from tax record
- −$344 /mo · $4,128/yr
- Insurance
- −$115
- HOA
- −$0
- Vacancy / Maint / Mgmt
- −$555
- Net cashflow
- $187
Break-even live
Sensitivity live
| Price | -10% $343 | -5% $265 | +0% $187 | +5% $110 | +10% $32 |
|---|---|---|---|---|---|
| Rent | -10% $-21 | -5% $83 | +0% $187 | +5% $292 | +10% $396 |
| Rate | -1.0pp $326 | -0.5pp $257 | base $187 | +0.5pp $116 | +1.0pp $44 |
UW: 25.0% down · 7.5% · 30yr · 1.5% tax · 5.0% vac · 8.0% maint · 8.0% mgmt
Financing live
Cash to close
- Down payment
- $68,725
- Closing costs
- $8,247
- Reserves months
- —
- Total cash needed
- —
Loan-product check · same deal, 3 products live
Conventional
25% down · 7.5% · 30yr
- Down + closing
- —
- Monthly P&I
- —
- Monthly cashflow
- —
- DSCR
- —
- Eligible?
- —
Personal DTI + credit; lowest rate.
DSCR
20% down · 8.5% · 30yr
- Down + closing
- —
- Monthly P&I
- —
- Monthly cashflow
- —
- DSCR
- —
- Eligible?
- —
No personal income docs; deal must DSCR.
Hard money
10% down · 12.0% · 12mo
- Down + closing
- —
- Monthly P&I
- —
- Monthly cashflow
- —
- DSCR
- —
- Eligible?
- —
Short-term bridge; refi at stabilization.
Rent comps 5 comps
| Address | Beds | Baths | Sqft | Rent | $/sqft | DOM | Units | Dist |
|---|---|---|---|---|---|---|---|---|
| 470 Lexington Pkwy S Saint Paul, MN | 2.0 | 1.0–2.0 | 1175 | $3,500 | $2.98 | 3d | 19 | 0.49mi |
| 740 Victoria St S Saint Paul, MN | 3.0 | 1.0–2.0 | 1076 | $2,785 | $2.59 | 0d | 38 | 0.57mi |
| 380 Randolph Ave Saint Paul, MN | 2.0 | 1.0–2.0 | 753 | $2,946 | $3.91 | 1d | 18 | 0.96mi |
| 695 Grand Ave Saint Paul, MN | 1.0 | 1.0 | 755 | $2,195 | $2.91 | 1d | 6 | 0.96mi |
| 871 Sibley Memorial Hwy Saint Paul, MN | 1.0–3.0 | 1.0–2.0 | 1207 | $3,900 | $3.23 | 0d | 10 | 1.46mi |
Listing history 8 events
-
2026-06-21statusdays on market $274,900 Pending 10 DOM
-
2026-06-18days on market $274,900 Contingent - Inspection 8 DOM
-
2026-06-17days on market $274,900 Contingent - Inspection 7 DOM
-
2026-06-16days on market $274,900 Contingent - Inspection 6 DOM
-
2026-06-15statusdays on market $274,900 Contingent - Inspection 5 DOM
-
2026-06-13statusdays on market $274,900 Active 3 DOM
-
2026-06-08remarks 681-char remark
-
2026-06-08$274,900 Coming Soon 1 DOM
ⓘ Source: listings_history table (triggers on properties + properties_extension) + one-shot
backfill from property_details.listing_events for pre-trigger history.
Tax reassessment forecast MN · Partial reset (capped growth)
- Current annual tax
- $4,128 · $344/mo
- Projected year-2 tax
- $4,128 · $344/mo
- Expected delta
- $0/yr ($0/mo · 0.0%)
ⓘ Screening estimate from a state-policy table — verify with the county assessor before closing.
Climate risk First Street
- Flood 5/10 Major FEMA zone X (unshaded) · 66% chance over 30 yrs
- Wildfire 1/10 Low
- Heat 2/10 Low 7 d/yr ≥100°F today · 14 d/yr by 30 yrs out
- Wind 2/10 Low
- Air quality 2/10 Low 1 unhealthy d/yr today · 1 by 30 yrs out
Nearby sold comps map
Loading sold comps map…
Walkable amenities ~0.75 mi
Loading nearby amenities…
Taxation est. · year 1
- Rental income
- $31,711
- − Mortgage interest
- −$15,399
- − Property taxes
- −$4,128
- − Insurance
- −$1,374
- − Repairs & maintenance
- −$2,537
- − Management
- −$2,537
- − Depreciation
- −$7,997
- Taxable loss
- −$2,261
- Est. tax savings @ 24.0%
- +$543
- After-tax cash flow
- $2,792/yr
For passive investors: Depreciation is non-cash, so a rental often shows a tax loss while cash-flowing — sheltering income. Rental losses are passive: they offset passive income freely, and up to $25,000/yr can offset ordinary (W-2) income if you actively participate and your MAGI is under $100k (phasing out to $0 by $150k); unused losses carry forward. On sale, claimed depreciation is recaptured at up to 25%, and gains may owe capital-gains tax (a 1031 exchange can defer both). Figures are a year-1 estimate at your 24.0% rate — not tax advice; consult a CPA.
Schools (NCES district)
- District
- St. Paul Public School District
- NCES district ID
- 2733840
- Math proficiency
- 21% ▼ -11.00%
- Reading proficiency
- 33% ▼ -7.00%
- Median HH income
- $48,316
- Composite
- 23.51/100
- National rank
- #7868
- State rank
- #270 of 301 in MN
Livability — St. Paul
No livability data for this city. (Only ~50 U.S. cities are tracked.)
Census & demographics
- Census place
- St. Paul, MN
- County
- Ramsey County · 542,837 people
- City population
- 280,599
- Metro
- Minneapolis-St. Paul-Bloomington, MN-WI
- Population (ZIP)
- 19,630
- Household income
- $76,406
- Rent vs Own
- Severe rent burden
- 1116.0
Population outlook (Ramsey County) Hauer SSP2
- Today (2025)
- 603,431 people
- By 2030
- 636,459 · +5.5%
- By 2040
- 700,596 · +16.1%
- By 2050
- 765,819 · +26.9%
- By 2075
- 929,297 · +54.0%
- By 2100
- 1,053,924 · +74.7%
Race, ethnicity, and origin ACS 2023
- Neighborhood character
- Predominantly White (77%)
- Race & ethnicity
- White 77% Black 10% Two or more races 6% Hispanic / Latino 5% Asian 3%
- Hispanic origin (detail)
- Mexican 4%
- Common ancestry
- Portuguese 10% Lithuanian 5% Romanian 3%
- Foreign-born
- 9% · Canada, South Korea
- Languages at home
- 87% English-only · Spanish 4% Other Indo-European 1% German/W. Germanic 1%
Political lean MEDSL · Ramsey
- 2024 margin
- Solid D (+43.3) · D 70.5% · R 27.2% · Other 2.3%
- 2008→2024 swing
- +9.4pp toward D · 2008: 33.9pp · 2024: 43.3pp
- All cycles
- 2024: D+43.3 2020: D+45.4 2016: D+39.4 2012: D+35.3 2008: D+33.9
Not yet ingested
- Civics
- —
Market trends
- HPI YoY
- ▼ -217.83%
- Current HPI
- 241.7112
- Rent YoY
- ▲ 1.60%
- Metro
- Minneapolis-St. Paul-Bloomington, MN-WI
- State GDP YoY
- ▲ 2.41%
- F500 in state
- 34
Industry mix (Fortune 500 HQ in MN)
| Industry | F500 HQs | Revenue |
|---|---|---|
| Healthcare | 2 | $407B |
|
||
| Retail | 2 | $150B |
|
||
| Consumer Goods | 2 | $32B |
|
||
| Industrial Machinery | 2 | $6B |
|
||
| Agriculture | 1 | $40B |
|
||
| Healthcare / Medical Devices | 1 | $32B |
|
||
Price history
+277.1% since first listed16 events — show timeline
- 2026-06-08 Coming Soon $274,900 NORTHSTARMLS as Distributed by MLS Grid
- 2021-08-30 Sold (Public Records) $241,000 Public Records
- 2021-08-23 Sold (MLS) $241,000 NORTHSTARMLS as Distributed by MLS Grid
- 2021-07-18 Pending — NORTHSTARMLS as Distributed by MLS Grid
- 2021-07-14 Listed $219,900 NORTHSTARMLS as Distributed by MLS Grid
- 2021-07-12 Coming Soon $219,900 NORTHSTARMLS as Distributed by MLS Grid
- 2014-05-19 Sold (Public Records) $109,800 Public Records
- 2014-04-29 Sold (MLS) $109,800 NORTHSTARMLS as Distributed by MLS Grid
- 2014-03-31 Pending — NORTHSTARMLS as Distributed by MLS Grid
- 2014-03-23 Contingent — NORTHSTARMLS as Distributed by MLS Grid
- 2014-03-08 Price Changed $109,900 NORTHSTARMLS as Distributed by MLS Grid
- 2014-03-07 Listed $109,000 NORTHSTARMLS as Distributed by MLS Grid
- 2013-08-08 Sold (Public Records) $61,000 Public Records
- 2013-06-28 Sold (MLS) $61,000 NORTHSTARMLS as Distributed by MLS Grid
- 2013-05-20 Listing Removed — NORTHSTARMLS as Distributed by MLS Grid
- 2013-05-03 Listed $72,900 NORTHSTARMLS as Distributed by MLS Grid
Property tax history
+12.6%/yrLatest (2025): $4,128 · +2.6% YoY. Source: county tax records.
Cash-flow waterfall
monthlySold comps — $/sqft
last 12 mo · ≤1 miLoading sold comps…