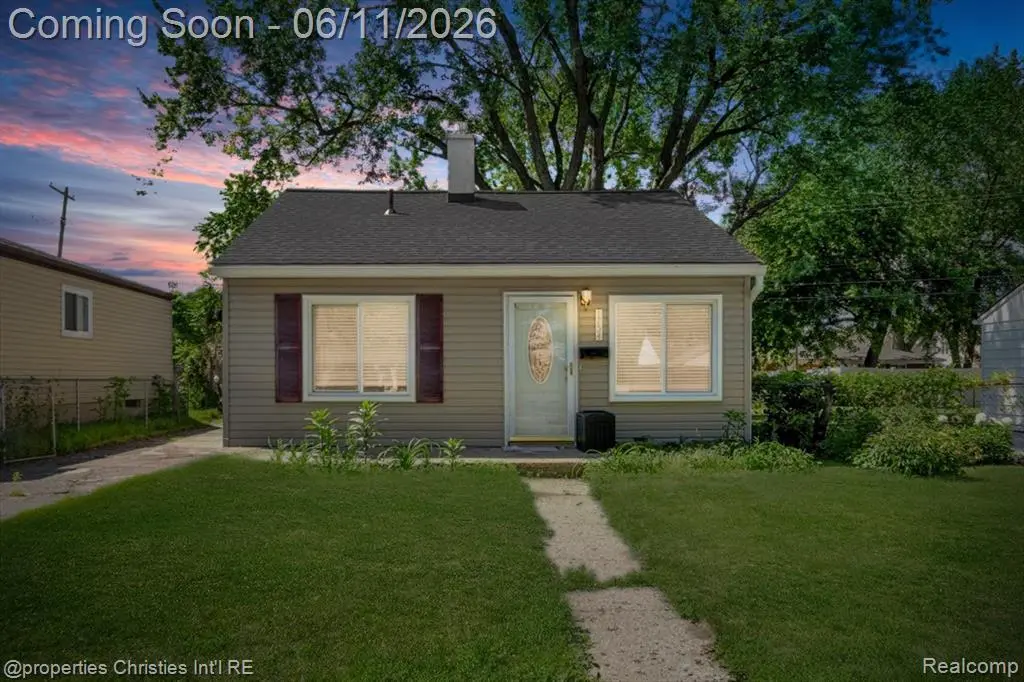
1754 E Harry Ave · Hazel Park, MI
Flood risk 1/10 · Minimal
- FEMA flood zone
- X (unshaded)
- Chance of flooding over 30 yrs
- 0.0%
- Est. flood insurance / yr
- $473 – $860
Fire risk 1/10 · Minimal
- Est. fire insurance / yr
- $784 – $1,456
Heat risk 3/10 · Minor
- Hot days now (above 97°F)
- 7 days/yr
- Hot days in 30 yrs
- 15 days/yr
Wind risk 2/10 · Minimal
- Chance of severe wind over 30 yrs
- —
Air-quality risk 3/10 · Minor
- Unhealthy air days now
- 3 days/yr
- Unhealthy air days in 30 yrs
- 5 days/yr
Risk factors via First Street. Map © Google.
Why this score? — see what drove the F grade
The composite is a weighted blend of 9 inputs, each scored 0–100. Each bar is that input's sub-score; the figure is the points it added to the 100-point composite (weight × sub-score).
- Cash flow +13.8/30.0
- 1% rule +4.5/10.0
- DSCR +4.2/10.0
- Livability +4.0/5.0
- Rent growth +3.2/5.0
- Condition / age +2.5/5.0
- Schools +1.4/10.0
- ARV discount +0.0/15.0
- Appreciation +0.0/10.0
$139,990
🖨 Deal sheet 📄 Offer letter ✓ Due diligence
Listing remarks MLS
Charming updated ranch in Hazel Park features a fresh interior with new carpet and lots of natural light. Bright entry living room with built-in shelving. Roomy updated kitchen with vinyl wood flooring, stainless steel appliances, and ample cabinet space. Utility/laundry room off the kitchen with access to the driveway. Two nice sized bedrooms share a full bath down the hallway. Newer roof and a lovely fenced backyard with a detached garage. Walking distance to local parks and easy freeway access. Welcome Home!
Key facts
- 4,356 sq ft lot
- Garage
- Built 1952
Property features AI
Exterior
- Parking: Detached garage (garage noted; 1.5 parking spaces listed)
- Utilities: Public water; Public sewer (implied); Electric service available
- Home design: Single-story residential home; Built in 1952
- Construction: Vinyl siding; Crawl foundation
- Exterior features: Fenced yard; Paved street access; Frontage approximately 40 feet
Interior
- Kitchen: Entry-level kitchen (about 11 x 8); Range/Oven
- Bedrooms: Two bedrooms on the entry level (approx. 11 x 9 and 11 x 8)
- Bathrooms: One full bathroom on the entry level (approximately 8 x 5)
- Heating & cooling: Forced air heating; Central A/C; Natural gas heat
- Interior features: Total of 6 rooms; Entry-level layout
- Laundry & utility: Entry-level laundry room (about 11 x 7); Washer, Dryer
Neighborhood map
What this means for you Summary
Snapshot
- This is a 2-bed/1.0-bath single-family listed at $140k.
Deal economics
- At list price, monthly cash flow is $13 ($154/yr) — positive.
- The deal already cash-flows at list — no discount required.
- To meet the 1% rule (rent ≥ 1% of price), the offer needs to be $133k (4.7% below list).
- Recommended offer: $133k (4.7% below list) — sets the bar for 1% rule.
Location & tenants
- Location reads 81/100 on livability (#65 in MI, #1,385 nationally) — a professional / high-income tenant draw. Strengths: commute A+, cost of living A+, housing A+; Watch: employment D+, schools D.
- Hazel Park School District (suburban): math 10% / reading 24% proficiency, ranked #490 of 540 in MI (top 91%) — low school quality limits family demand, transient renter base, plan for 1-2y turnover; 70% free/reduced lunch — lower-income household profile, screen leases tightly.
- Market conditions: Rents rising (+2.9%/yr); 135 active listings in the ZIP; 12 comparable units currently listed for rent nearby; rentals at typical pace (median 25d on market — plan ~3-4 weeks tenant-placement turnaround); 2,614 units permitted in Oakland County in 2024 (721 in 5+ unit buildings).
Forward outlook
- Local home prices are declining (-3.0%/yr); year-one equity from $968 of loan paydown is wiped out by about $4k of value loss. Plan a longer hold.
- Oakland County population projected at +10% by 2050 — modest demand growth; plan on rents tracking national, not racing it.
Negotiation context
- Only 8 days on market — expect competitive offers; lowballing is unlikely to land.
- 13 sale attempts since 24y ago; this cycle's ask is 22% above the opening price — seller raised mid-cycle; expect resistance to lowballs.
- Current owner paid $121k; 16% above their basis — modest negotiation headroom, anchor on the comps not their cost.
Risks & watch-outs
- Watch-outs: built in 1952 — expect roof / HVAC / electrical / plumbing capex.
Questions for the listing agent
- Built in 1952 — when were the roof, HVAC, electrical panel, plumbing, and water heater last replaced?
- Is there a deadline driving the sale (1031 exchange, divorce, estate, relocation)? That informs how much negotiation room exists.
- Schools are D-rated, which usually means shorter tenancies and higher turnover. Who's the typical renter profile here, and what's been the actual vacancy rate?
- The area grade is low — what's the realistic commute time and amenity access for the typical tenant pool here? Any planned neighborhood developments (good or bad) we should know about?
- What's the average days-on-market for RENTAL listings here right now (not sales)? A rising rental-DOM trend means longer vacancies and softer asking-rent achievability than the comps imply.
- What's the recent tenant-quality profile in this submarket — average credit score on applications, eviction rate, late-payment / NSF rate, and stable-employment percentage? A property-management company in the area should have these aggregated.
- How much new for-sale + rental construction is in the pipeline within 1–3 miles? Heavy new supply typically softens prices + rents 12–24 months out; constrained supply supports both.
Investment metrics
- 1% rule
- 0.95% ✗
- Cap rate
- 6.40%
- Cash-on-cash
- 0.39%
- DSCR
- 1.02
- GRM
- 8.7
CMA / ARV
- ARV (on-the-fly)
- $114,912
- Comps found
- 12
Show comp detail 12 sales within ~0.75 mi
| Address | Dist | Beds/Ba | Sqft | Sold | Price | $/sf | Match |
|---|---|---|---|---|---|---|---|
| 1474 E Milton Ave | 0.47mi | 2/1.0 | 682 (+2%) | 2mo | $155,000 | $227 | 74 |
| 1706 E Pearl Ave | 0.12mi | 3/1.0 (+1) | 728 (+8%) | 3mo | $165,000 | $227 | 73 |
| 1424 E Harry Ave | 0.25mi | 1/1.0 (-1) | 643 (-4%) | 10mo | $65,000 | $101 | 68 |
| 1403 E Bernhard Ave | 0.43mi | 2/1.0 | 695 (+3%) | 8mo | $139,600 | $201 | 68 |
| 2120 Pearl Ave | 0.25mi | 2/1.0 | 756 (+12%) | 1mo | $113,000 | $149 | 66 |
| 1721 E Milton Ave E | 0.40mi | 2/1.0 | 732 (+9%) | 5mo | $125,000 | $171 | 62 |
| 1320 E Goulson Ave | 0.40mi | 2/1.0 | 726 (+8%) | 7mo | $136,000 | $187 | 62 |
| 1929 Michael Ave | 0.15mi | 1/1.0 (-1) | 598 (-11%) | 11mo | $69,500 | $116 | 61 |
| 1149 E Milton Ave | 0.54mi | 2/1.0 | 702 (+4%) | 11mo | $79,000 | $113 | 58 |
| 1771 E George Ave | 0.50mi | 2/1.0 | 724 (+8%) | 8mo | $93,000 | $128 | 57 |
| 23442 Melville Ave | 0.69mi | 2/1.0 | 729 (+8%) | 0mo | $90,000 | $123 | 54 |
| 1443 E George Ave | 0.55mi | 2/1.0 | 760 (+13%) | 8mo | $159,300 | $210 | 46 |
Match score weights: distance 35% · size 25% · config 20% · recency 20%. Top-matched comps best support the ARV.
Projected returns pro-forma
-3.0% appreciation · 2.9% rent growth · sell at horizon
- IRR
- -15.7%
- Equity multiple
- 0.44×
- Total profit
- $-21,937
- Equity at exit
- $20,873
- IRR
- -7.4%
- Equity multiple
- 0.53×
- Total profit
- $-18,335
- Equity at exit
- $12,104
Cash invested: $39,197 (down + closing). Projections, not guarantees.
Landlord ↔ Tenant lean methodology
- Overall (STATE)
- 62 Landlord-Friendly
- State Michigan
- 62 Landlord-Friendly · EVEN
- County
- — inherits STATE
- City
- — inherits STATE
ZIP-level market 48030
- Rents YoY
- 2.9%
- Active inventory
- 135
- Price-to-rent
- 8.7×
Monthly cashflow live
- Estimated rent
- $1,334 high interval (Pro) →
- Mortgage (P&I)
- −$734
- Tax from tax record
- −$248 /mo · $2,979/yr
- Insurance
- −$58
- HOA
- −$0
- Vacancy / Maint / Mgmt
- −$280
- Net cashflow
- $13
Break-even live
UW: 25.0% down · 7.5% · 30yr · 1.5% tax · 5.0% vac · 8.0% maint · 8.0% mgmt
Financing live
Cash to close
- Down payment
- $34,998
- Closing costs
- $4,200
- Reserves months
- —
- Total cash needed
- —
Loan-product check · same deal, 3 products live
Conventional
25% down · 7.5% · 30yr
- Down + closing
- —
- Monthly P&I
- —
- Monthly cashflow
- —
- DSCR
- —
- Eligible?
- —
Personal DTI + credit; lowest rate.
DSCR
20% down · 8.5% · 30yr
- Down + closing
- —
- Monthly P&I
- —
- Monthly cashflow
- —
- DSCR
- —
- Eligible?
- —
No personal income docs; deal must DSCR.
Hard money
10% down · 12.0% · 12mo
- Down + closing
- —
- Monthly P&I
- —
- Monthly cashflow
- —
- DSCR
- —
- Eligible?
- —
Short-term bridge; refi at stabilization.
Rent comps 12 comps
| Address | Beds | Baths | Sqft | Rent | $/sqft | DOM | Units | Dist |
|---|---|---|---|---|---|---|---|---|
| 1621 E Evelyn Ave Hazel Park, MI | 2.0 | 1.0 | 749 | $1,295 | $1.73 | 18d | 1 | 0.20mi |
| 21516 Dequindre Rd Warren, MI | 1.0–2.0 | 1.0 | 837 | $1,375 | $1.64 | 22d | 1 | 0.24mi |
| 1211 E Bernhard Ave Hazel Park, MI | 2.0 | 1.0 | 721 | $1,500 | $2.08 | 24d | 1 | 0.49mi |
| 21155 Warner Ave Warren, MI | 2.0 | 1.0 | 756 | $1,029 | $1.36 | 24d | 1 | 0.54mi |
| 23115 Tawas Ave Hazel Park, MI | 2.0 | 1.0 | 706 | $1,375 | $1.95 | 24d | 1 | 0.83mi |
| 1770 E Woodward Heights Blvd Hazel Park, MI | 1.0–2.0 | 1.0 | 712 | $1,400 | $1.96 | 5d | 1 | 0.88mi |
| 1770 E Woodward Heights Blvd Unit C6 Hazel Park, MI | 1.0 | 1.0 | 550 | $1,100 | $2.00 | 24d | 1 | 0.88mi |
| 1770 E Woodward Heights Blvd Unit C1 Hazel Park, MI | 1.0 | 1.0 | 550 | $1,350 | $2.45 | 24d | 1 | 0.88mi |
| 27 E Milton Ave Hazel Park, MI | 1.0 | 1.0 | 568 | $1,050 | $1.85 | 15d | 1 | 0.98mi |
| 1045 E Woodward Heights Blvd Hazel Park, MI | 1.0–2.0 | 1.0 | 715 | $1,209 | $1.69 | 24d | 3 | 1.04mi |
| 23773 Hazelwood Ave Hazel Park, MI | 2.0 | 1.0 | 671 | $1,400 | $2.09 | 12d | 1 | 1.08mi |
| 155 W George Ave Hazel Park, MI | 2.0 | 1.0 | 725 | $1,000 | $1.38 | 24d | 1 | 1.20mi |
Listing history 8 events
-
2026-06-18days on market $139,990 Active 8 DOM
-
2026-06-17days on market $139,990 Active 7 DOM
-
2026-06-16days on market $139,990 Active 6 DOM
-
2026-06-15days on market $139,990 Active 5 DOM
-
2026-06-13days on market $139,990 Active 3 DOM
-
2026-06-13statusdays on market $139,990 Active 2 DOM
-
2026-06-10remarks 699-char remark
-
2026-06-10$139,990 Coming Soon 1 DOM
ⓘ Source: listings_history table (triggers on properties + properties_extension) + one-shot
backfill from property_details.listing_events for pre-trigger history.
Tax reassessment forecast MI · Partial reset (capped growth)
- Current annual tax
- $2,979 · $248/mo
- Projected year-2 tax
- $2,979 · $248/mo
- Expected delta
- $0/yr ($0/mo · 0.0%)
ⓘ Screening estimate from a state-policy table — verify with the county assessor before closing.
Climate risk First Street
- Flood 1/10 Low FEMA zone X (unshaded) · 0% chance over 30 yrs
- Wildfire 1/10 Low
- Heat 3/10 Moderate 7 d/yr ≥97°F today · 15 d/yr by 30 yrs out
- Wind 2/10 Low
- Air quality 3/10 Moderate 3 unhealthy d/yr today · 5 by 30 yrs out
Nearby sold comps map
Loading sold comps map…
Walkable amenities ~0.75 mi
Loading nearby amenities…
Taxation est. · year 1
- Rental income
- $16,002
- − Mortgage interest
- −$7,842
- − Property taxes
- −$2,979
- − Insurance
- −$700
- − Repairs & maintenance
- −$1,280
- − Management
- −$1,280
- − Depreciation
- −$4,072
- Taxable loss
- −$2,151
- Est. tax savings @ 24.0%
- +$516
- After-tax cash flow
- $670/yr
For passive investors: Depreciation is non-cash, so a rental often shows a tax loss while cash-flowing — sheltering income. Rental losses are passive: they offset passive income freely, and up to $25,000/yr can offset ordinary (W-2) income if you actively participate and your MAGI is under $100k (phasing out to $0 by $150k); unused losses carry forward. On sale, claimed depreciation is recaptured at up to 25%, and gains may owe capital-gains tax (a 1031 exchange can defer both). Figures are a year-1 estimate at your 24.0% rate — not tax advice; consult a CPA.
Schools (NCES district)
- District
- Hazel Park School District
- NCES district ID
- 2618030
- Math proficiency
- 10% ▼ -2.00%
- Reading proficiency
- 24% ▲ 1.00%
- Median HH income
- $36,181
- Composite
- 14.05/100
- National rank
- #9466
- State rank
- #490 of 540 in MI
Livability — Hazel Park
- Score
- 81/100
- State rank
- #65
- US rank
- #1385
Category grades
Schools grade is shown separately in the Schools card above.
Census & demographics
- Census place
- Hazel Park, MI
- County
- Oakland County · 1,009,092 people
- City population
- 14,963
- Metro
- Detroit-Warren-Dearborn, MI
- Population (ZIP)
- 14,963
- Household income
- $67,073
- Rent vs Own
- Severe rent burden
- 432.0
Population outlook (Oakland County) Hauer SSP2
- Today (2025)
- 1,335,747 people
- By 2030
- 1,375,100 · +2.9%
- By 2040
- 1,435,385 · +7.5%
- By 2050
- 1,469,250 · +10.0%
- By 2075
- 1,531,946 · +14.7%
- By 2100
- 1,450,485 · +8.6%
Race, ethnicity, and origin ACS 2023
- Neighborhood character
- Predominantly White (74%)
- Race & ethnicity
- White 74% Two or more races 10% Black 10% Hispanic / Latino 6% Asian 1%
- Hispanic origin (detail)
- Mexican 3% Puerto Rican 2%
- Common ancestry
- Romanian 11% Slovak 3% Lithuanian 2%
- Foreign-born
- 5% · Canada
- Languages at home
- 92% English-only · Spanish 5% Arabic 1% Russian/Polish/Slavic 1%
Political lean MEDSL · Oakland
- 2024 margin
- D (+10.6) · D 54.4% · R 43.8% · Other 1.9%
- 2008→2024 swing
- -3.9pp toward R · 2008: 14.5pp · 2024: 10.6pp
- All cycles
- 2024: D+10.6 2020: D+14.1 2016: D+8.1 2012: D+8.1 2008: D+14.5
Not yet ingested
- Civics
- —
Market trends
- HPI YoY
- ▼ -184.32%
- Current HPI
- 285.5923
- Rent YoY
- ▲ 2.90%
- Metro
- Detroit-Warren-Dearborn, MI
- State GDP YoY
- ▲ 1.37%
- F500 in state
- 28
Industry mix (Fortune 500 HQ in MI)
| Industry | F500 HQs | Revenue |
|---|---|---|
| Automotive Parts | 3 | $48B |
|
||
| Automotive | 2 | $372B |
|
||
| Chemicals | 1 | $45B |
|
||
| Automotive Retail | 1 | $29B |
|
||
| Healthcare / Medical Devices | 1 | $23B |
|
||
| Automotive Technology | 1 | $20B |
|
||
Price history
+508.7% since first listed40 events — show timeline
- 2026-06-09 Coming Soon $139,990 MiRealSource-MiMLS
- 2023-05-15 Sold (MLS) $121,000 MiRealSource-MiMLS
- 2023-05-15 Sold (MLS) $121,000 REALCOMP
- 2023-05-01 Listing Removed — MiRealSource-MiMLS
- 2023-05-01 Listed $115,000 MiRealSource-MiMLS
- 2023-05-01 Listed $115,000 REALCOMP
- 2023-05-01 Listing Removed — REALCOMP
- 2018-11-06 Sold (Public Records) $80,000 Public Records
- 2018-10-31 Sold (MLS) $80,000 MiRealSource-MiMLS
- 2018-10-31 Sold (MLS) $80,000 REALCOMP
- 2018-10-03 Pending — MiRealSource-MiMLS
- 2018-10-03 Pending — REALCOMP
- 2018-09-17 Listing Removed — REALCOMP
- 2018-09-17 Listing Removed — MiRealSource-MiMLS
- 2018-09-17 Listed $83,900 MiRealSource-MiMLS
- 2018-09-17 Listed $83,900 REALCOMP
- 2018-09-13 Price Changed $83,900 MiRealSource-MiMLS
- 2018-09-13 Price Changed $83,900 REALCOMP
- 2018-08-17 Listed $89,900 MiRealSource-MiMLS
- 2018-08-17 Listed $89,900 REALCOMP
- 2014-06-10 Listing Removed — MiRealSource-MiMLS
- 2014-06-10 Listing Removed — MiRealSource-MiMLS
- 2014-06-10 Listing Removed — REALCOMP
- 2014-04-07 Listed $42,900 MiRealSource-MiMLS
- 2014-04-07 Listed $42,900 MiRealSource-MiMLS
- 2014-04-07 Listed $42,900 REALCOMP
- 2006-05-31 Listing Removed — MiRealSource-MiMLS
- 2006-05-31 Listing Removed — REALCOMP
- 2006-04-05 Listed $73,900 MiRealSource-MiMLS
- 2006-04-05 Listed $73,900 REALCOMP
- 2004-02-18 Sold (Public Records) $69,500 Public Records
- 2003-12-16 Sold (MLS) $69,500 MiRealSource-MiMLS
- 2003-12-06 Listing Removed — MiRealSource-MiMLS
- 2003-09-10 Listed $69,900 MiRealSource-MiMLS
- 2003-01-10 Listing Removed — REALCOMP
- 2002-10-28 Listed $75,000 REALCOMP
- 2002-07-16 Sold (Public Records) $59,093 Public Records
- 1995-11-16 Sold (Public Records) $37,900 Public Records
- 1993-09-16 Sold (Public Records) $22,000 Public Records
- 1986-12-01 Sold (Public Records) $23,000 Public Records
Property tax history
+8.3%/yrLatest (2025): $2,979 · +1.9% YoY. Source: county tax records.
Cash-flow waterfall
monthlySold comps — $/sqft
last 12 mo · ≤1 miLoading sold comps…