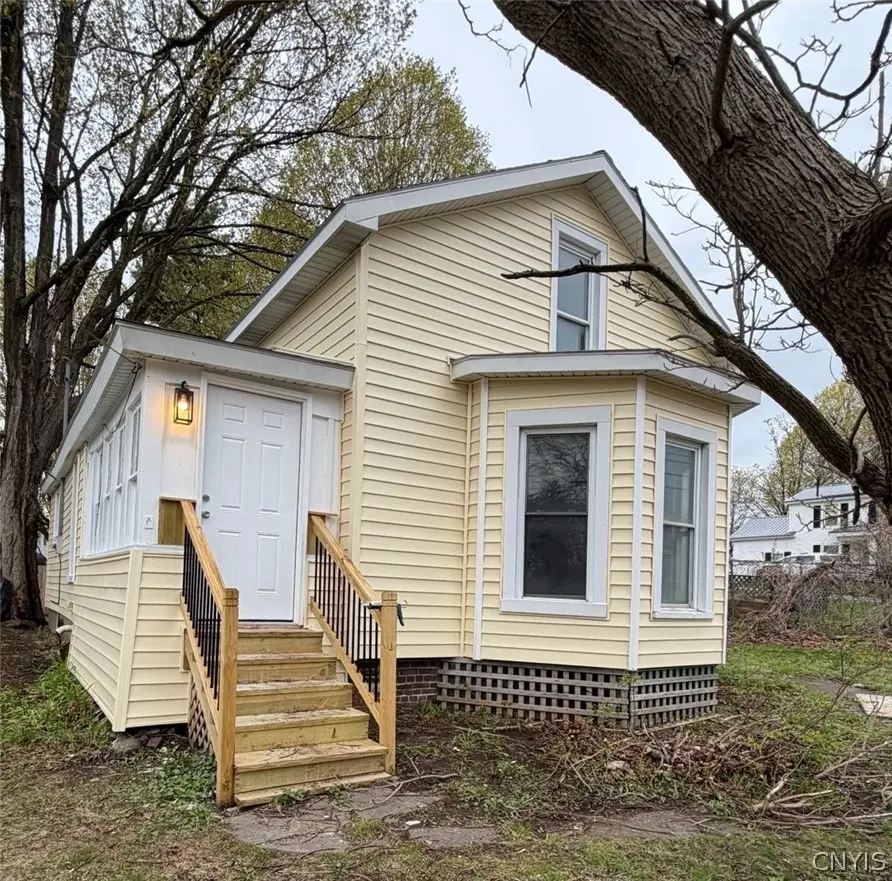
42 Bridge St · West Carthage, NY
Flood risk 1/10 · Minimal
- FEMA flood zone
- X
- Chance of flooding over 30 yrs
- 0.0%
- Est. flood insurance / yr
- $473 – $860
Fire risk 1/10 · Minimal
- Est. fire insurance / yr
- $691 – $1,283
Heat risk 1/10 · Minimal
- Hot days now (above 92°F)
- 7 days/yr
- Hot days in 30 yrs
- 16 days/yr
Wind risk 1/10 · Minimal
- Chance of severe wind over 30 yrs
- —
Air-quality risk 2/10 · Minimal
- Unhealthy air days now
- 0 days/yr
- Unhealthy air days in 30 yrs
- 1 days/yr
Risk factors via First Street. Map © Google.
Why this score? — see what drove the D+ grade
The composite is a weighted blend of 9 inputs, each scored 0–100. Each bar is that input's sub-score; the figure is the points it added to the 100-point composite (weight × sub-score).
- ARV discount +12.0/15.0
- Appreciation +10.0/10.0
- Cash flow +9.9/30.0
- Schools +3.3/10.0
- Livability +3.1/5.0
- DSCR +2.8/10.0
- Rent growth +2.5/5.0
- Condition / age +2.5/5.0
- 1% rule +2.1/10.0
$189,900
🖨 Deal sheet (PDF) 📄 Offer letter ✓ Due diligence
Listing remarks MLS
Welcome to the heart of the Village of West Carthage, where charm meets modern convenience in this beautifully remodeled 2-3 bedroom, 1-bath home! Situated on a desirable corner lot, this move-in ready property has been completely updated from top to bottom, offering peace of mind and stylish living. Step inside to find a bright, refreshed interior featuring all-new finishes and brand-new appliances that make everyday living both comfortable and efficient. The thoughtfully designed layout includes first-floor laundry for added convenience and an additional flexible space—perfect for a home office, playroom, or cozy den to suit your lifestyle needs plus enclosed front porch to enjoy the seasons in comfort. A full basement provides excellent storage or potential for future expansion, while the partially fenced yard offers just the right amount of outdoor space for pets, gardening, or relaxing evenings. Whether you're starting out, downsizing, or looking for a turnkey investment, Don ’t miss your chance to own a beautifully updated home in a great location. Seller offering 2000 cash at closing.
Key facts
- Remodeled
- Flexible space
- Full basement
Tags
Neighborhood map
What this means for you Summary
Snapshot
- This is a 3-bed/1.0-bath single-family listed at $190k.
Deal economics
- At list price, monthly cash flow is $-119 ($-1k/yr) — negative.
- To cash-flow at today's rent, offer at most $169k (11.1% below list).
- To meet the 1% rule (rent ≥ 1% of price), the offer needs to be $135k (28.7% below list).
- Recommended offer: $135k (28.7% below list) — sets the bar for 1% rule.
- Cap rate 5.5% vs local median 4.3% in West Carthage — top-decile yield for the area; either an underpriced asset or a hidden risk that comps aren't pricing in. Stress-test before assuming the spread holds.
Location & tenants
- Location reads 61/100 on livability (#912 in NY) — a middle-class / working-renter tenant base. Strengths: crime A, cost of living A-, housing B+; Watch: employment D+, health & safety D, amenities F.
- Carthage Central School District (rural): math 30% / reading 46% proficiency, ranked #539 of 590 in NY (top 91%) — families likely to look elsewhere, expect single-tenant / working-renter base with shorter leases.
- Zoned schools: West Carthage Elementary School (math 22% / reading 42%, grade F, #1,646 of 2,108 statewide, top 80%, 348 students, 51% FRL); Carthage Middle School (math 19% / reading 41%, grade F, #539 of 729 statewide, top 74%, 899 students, 51% FRL); Carthage Senior High School (math 92% / reading 72%, grade A, #452 of 1,100 statewide, top 44%, 815 students, 52% FRL) — zoned schools average 51% FRL vs 31% district-wide (20 pts higher); higher-poverty schools than district average — tighter screening recommended.
- Market conditions: 78 active listings in the ZIP; 1 comparable units currently listed for rent nearby; 196 units permitted in Jefferson County in 2024 (0 in 5+ unit buildings).
Forward outlook
- In year one you build about $20k of equity ($1k loan paydown + $19k appreciation (10.0% local appreciation)).
- Jefferson County population projected at -12% by 2050 — secular population decline; favor cash flow + early exit over multi-decade hold.
- By year 2, paydown + projected appreciation supports a ~$33k cash-out refi (75% LTV) — recoverable capital for the next deal without selling this one.
Negotiation context
- It's been on market 87 days — a 6% lower offer ($179k) is reasonable based on typical stale-listing flexibility.
- Current owner paid $1; list at $190k implies a 18989900% gain — meaningful room to come down on a strong offer.
Risks & watch-outs
- Watch-outs: built in 1925 — expect roof / HVAC / electrical / plumbing capex.
Questions for the listing agent
- What do current leases actually rent for vs. the listed asking? Can we see a recent rent roll and the last 12 months of T-12 income?
- It's been on market 87 days. Have you received any prior offers? Is the seller open to a 29% concession, seller financing, or rate buy-down credit?
- Built in 1925 — when were the roof, HVAC, electrical panel, plumbing, and water heater last replaced?
- Why hasn't it sold? Are there any deal-killer items the seller is aware of (foundation, flood, title, zoning, code violations)?
- Is there a deadline driving the sale (1031 exchange, divorce, estate, relocation)? That informs how much negotiation room exists.
- Schools are F-rated, which usually means shorter tenancies and higher turnover. Who's the typical renter profile here, and what's been the actual vacancy rate?
- The area grade is low — what's the realistic commute time and amenity access for the typical tenant pool here? Any planned neighborhood developments (good or bad) we should know about?
- What's the average days-on-market for RENTAL listings here right now (not sales)? A rising rental-DOM trend means longer vacancies and softer asking-rent achievability than the comps imply.
- What's the recent tenant-quality profile in this submarket — average credit score on applications, eviction rate, late-payment / NSF rate, and stable-employment percentage? A property-management company in the area should have these aggregated.
- How much new for-sale + rental construction is in the pipeline within 1–3 miles? Heavy new supply typically softens prices + rents 12–24 months out; constrained supply supports both.
Investment metrics
- 1% rule
- 0.71% ✗
- Cap rate
- 5.54%
- Cash-on-cash
- -2.69%
- DSCR
- 0.88
- GRM
- 11.7
CMA / ARV
- ARV (median comp)
- $211,003
- List price
- $189,900
- Delta
- -10.00%
- Verdict
- FAIR
- Comps
- 20 within 1.0 mi
Show comp detail 10 sales within ~0.75 mi
| Address | Dist | Beds/Ba | Sqft | Sold | Price | $/sf | Match |
|---|---|---|---|---|---|---|---|
| 46 Liberty St | 0.22mi | 3/1.0 | 1,200 (+3%) | 8mo | $214,900 | $179 | 79 |
| 33 N Broad St | 0.41mi | 3/1.0 | 1,105 (-5%) | 4mo | $305,000 | $276 | 69 |
| 29 Stone St | 0.25mi | 3/1.5 | 1,320 (+13%) | 2mo | $222,900 | $169 | 62 |
| 11 unite 6 Liberty St | 0.16mi | 2/2.0 (-1) | 1,056 (-9%) | 9mo | $75,000 | $71 | 60 |
| 35 Franklin St | 0.27mi | 3/1.0 | 1,316 (+13%) | 13mo | $128,640 | $98 | 55 |
| 86 1/2 Champion St | 0.52mi | 3/1.5 | 1,056 (-9%) | 8mo | $141,800 | $134 | 51 |
| 71 Champion St | 0.41mi | 3/2.0 | 1,317 (+13%) | 8mo | $143,000 | $109 | 48 |
| 43 N Broad St | 0.59mi | 2/1.5 (-1) | 1,248 (+7%) | 8mo | $100,000 | $80 | 47 |
| 110 Bridge St | 0.54mi | 3/1.5 | 1,248 (+7%) | 18mo | $185,000 | $148 | 46 |
| 74 Champion St | 0.46mi | 3/2.0 | 1,312 (+12%) | 12mo | $229,900 | $175 | 44 |
Match score weights: distance 35% · size 25% · config 20% · recency 20%. Top-matched comps best support the ARV.
Projected returns pro-forma
10.0% appreciation · 3.0% rent growth · sell at horizon
- IRR
- 22.3%
- Equity multiple
- 2.80×
- Total profit
- $95,765
- Equity at exit
- $171,077
- IRR
- 20.0%
- Equity multiple
- 6.41×
- Total profit
- $287,882
- Equity at exit
- $368,934
Cash invested: $53,172 (down + closing). Projections, not guarantees.
Landlord ↔ Tenant lean methodology
- Overall (STATE)
- 15 Strongly Tenant-Friendly
- State New York
- 15 Strongly Tenant-Friendly · D+10
- County
- — inherits STATE
- City
- — inherits STATE
ZIP-level market 13619
- Home prices YoY
- 26.0%
- Active inventory
- 78
- Price-to-rent
- 11.7×
Monthly cashflow live
- Estimated rent
- $1,353 medium interval (Pro) →
- Mortgage (P&I)
- −$996
- Tax from tax record
- −$114 /mo · $1,362/yr
- Insurance
- −$79
- HOA
- −$0
- Vacancy / Maint / Mgmt
- −$284
- Net cashflow
- $-119
Break-even live
Sensitivity live
| Price | -10% $-12 | -5% $-66 | +0% $-119 | +5% $-173 | +10% $-227 |
|---|---|---|---|---|---|
| Rent | -10% $-226 | -5% $-173 | +0% $-119 | +5% $-66 | +10% $-12 |
| Rate | -1.0pp $-24 | -0.5pp $-71 | base $-119 | +0.5pp $-169 | +1.0pp $-219 |
UW: 25.0% down · 7.5% · 30yr · 1.5% tax · 5.0% vac · 8.0% maint · 8.0% mgmt
Financing live
Cash to close
- Down payment
- $47,475
- Closing costs
- $5,697
- Reserves months
- —
- Total cash needed
- —
Loan-product check · same deal, 3 products live
Conventional
25% down · 7.5% · 30yr
- Down + closing
- —
- Monthly P&I
- —
- Monthly cashflow
- —
- DSCR
- —
- Eligible?
- —
Personal DTI + credit; lowest rate.
DSCR
20% down · 8.5% · 30yr
- Down + closing
- —
- Monthly P&I
- —
- Monthly cashflow
- —
- DSCR
- —
- Eligible?
- —
No personal income docs; deal must DSCR.
Hard money
10% down · 12.0% · 12mo
- Down + closing
- —
- Monthly P&I
- —
- Monthly cashflow
- —
- DSCR
- —
- Eligible?
- —
Short-term bridge; refi at stabilization.
Rent comps 1 comps
| Address | Beds | Baths | Sqft | Rent | $/sqft | DOM | Units | Dist |
|---|---|---|---|---|---|---|---|---|
| 719 Alexandria St Unit 719 Carthage, NY | 3.0 | 1.0 | 1100 | $995 | $0.90 | 45d | 1 | 0.89mi |
Listing history 20 events
-
2026-06-21days on market $189,900 Active 87 DOM
-
2026-06-19days on market $189,900 Active 85 DOM
-
2026-06-18days on market $189,900 Active 84 DOM
-
2026-06-17days on market $189,900 Active 83 DOM
-
2026-06-16days on market $189,900 Active 82 DOM
-
2026-06-15days on market $189,900 Active 81 DOM
-
2026-06-14days on market $189,900 Active 79 DOM
-
2026-06-12days on market $189,900 Active 78 DOM
-
2026-06-09pricedays on market $189,900 Active 75 DOM
-
2026-06-08days on market $199,900 Active 74 DOM
-
2026-06-07days on market $199,900 Active 73 DOM
-
2026-06-05days on market $199,900 Active 70 DOM
-
2026-06-03days on market $199,900 Active 69 DOM
-
2026-06-02days on market $199,900 Active 68 DOM
-
2026-06-01days on market $199,900 Active 67 DOM
-
2026-05-31days on market $199,900 Active 66 DOM
-
2026-05-30days on market $199,900 Active 65 DOM
-
2026-05-06price $221,900 1121-char remark
Show marketing remark (1121 chars)
Welcome to the heart of the Village of West Carthage, where charm meets modern convenience in this beautifully remodeled 2-3 bedroom, 1-bath home! Situated on a desirable corner lot, this move-in ready property has been completely updated from top to bottom, offering peace of mind and stylish living. Step inside to find a bright, refreshed interior featuring all-new finishes and brand-new appliances that make everyday living both comfortable and efficient. The thoughtfully designed layout includes first-floor laundry for added convenience and an additional flexible space—perfect for a home office, playroom, or cozy den to suit your lifestyle needs plus enclosed front porch to enjoy the seasons in comfort. A full basement provides excellent storage or potential for future expansion, while the partially fenced yard offers just the right amount of outdoor space for pets, gardening, or relaxing evenings. Whether you're starting out, downsizing, or looking for a turnkey investment, Don ’t miss your chance to own a beautifully updated home in a great location. Seller offering 2000 cash at closing.
-
2026-03-26$224,000 Active 1121-char remark
Show marketing remark (1121 chars)
Welcome to the heart of the Village of West Carthage, where charm meets modern convenience in this beautifully remodeled 2-3 bedroom, 1-bath home! Situated on a desirable corner lot, this move-in ready property has been completely updated from top to bottom, offering peace of mind and stylish living. Step inside to find a bright, refreshed interior featuring all-new finishes and brand-new appliances that make everyday living both comfortable and efficient. The thoughtfully designed layout includes first-floor laundry for added convenience and an additional flexible space—perfect for a home office, playroom, or cozy den to suit your lifestyle needs plus enclosed front porch to enjoy the seasons in comfort. A full basement provides excellent storage or potential for future expansion, while the partially fenced yard offers just the right amount of outdoor space for pets, gardening, or relaxing evenings. Whether you're starting out, downsizing, or looking for a turnkey investment, Don ’t miss your chance to own a beautifully updated home in a great location. Seller offering 2000 cash at closing.
-
2025-06-13soldstatus $1
ⓘ Source: listings_history table (triggers on properties + properties_extension) + one-shot
backfill from property_details.listing_events for pre-trigger history.
Tax reassessment forecast NY · Partial reset (capped growth)
- Current annual tax
- $1,362 · $114/mo
- Projected year-2 tax
- $2,286 · $190/mo
- Expected delta
- +$923/yr (+$77/mo · 67.8%)
ⓘ Screening estimate from a state-policy table — verify with the county assessor before closing.
Climate risk First Street
- Flood 1/10 Low FEMA zone X · 0% chance over 30 yrs
- Wildfire 1/10 Low
- Heat 1/10 Low 7 d/yr ≥92°F today · 16 d/yr by 30 yrs out
- Wind 1/10 Low
- Air quality 2/10 Low 0 unhealthy d/yr today · 1 by 30 yrs out
Nearby sold comps map
Loading sold comps map…
Walkable amenities ~0.75 mi
Loading nearby amenities…
Taxation est. · year 1
- Rental income
- $16,240
- − Mortgage interest
- −$10,637
- − Property taxes
- −$1,362
- − Insurance
- −$950
- − Repairs & maintenance
- −$1,299
- − Management
- −$1,299
- − Depreciation
- −$5,524
- Taxable loss
- −$4,832
- Est. tax savings @ 24.0%
- +$1,160
- After-tax cash flow
- $-273/yr
For passive investors: Depreciation is non-cash, so a rental often shows a tax loss while cash-flowing — sheltering income. Rental losses are passive: they offset passive income freely, and up to $25,000/yr can offset ordinary (W-2) income if you actively participate and your MAGI is under $100k (phasing out to $0 by $150k); unused losses carry forward. On sale, claimed depreciation is recaptured at up to 25%, and gains may owe capital-gains tax (a 1031 exchange can defer both). Figures are a year-1 estimate at your 24.0% rate — not tax advice; consult a CPA.
Schools (NCES district)
- District
- Carthage Central School District
- NCES district ID
- 3606630
- Math proficiency
- 30% ▼ -18.00%
- Reading proficiency
- 46% ▲ 2.00%
- Median HH income
- $48,450
- Composite
- 32.63/100
- National rank
- #5668
- State rank
- #539 of 590 in NY
Livability — West Carthage
- Score
- 61/100
- State rank
- #912
- US rank
- #17830
Category grades
Schools grade is shown separately in the Schools card above.
Census & demographics
- Census place
- West Carthage, NY
- County
- Jefferson County · 47,417 people
- Metro
- Watertown-Fort Drum, NY
- Population (ZIP)
- 10,578
- Household income
- $63,120
- Rent vs Own
- Severe rent burden
- 379.0
Population outlook (Jefferson County) Hauer SSP2
- Today (2025)
- 111,748 people
- By 2030
- 109,370 · -2.1%
- By 2040
- 103,828 · -7.1%
- By 2050
- 98,523 · -11.8%
- By 2075
- 91,422 · -18.2%
- By 2100
- 78,214 · -30.0%
Race, ethnicity, and origin ACS 2023
- Neighborhood character
- Predominantly White (83%)
- Race & ethnicity
- White 83% Two or more races 8% Hispanic / Latino 6% Black 2%
- Hispanic origin (detail)
- Mexican 1% Puerto Rican 2%
- Common ancestry
- Lithuanian 9% Romanian 3% Iranian 1%
- Foreign-born
- 4% · Canada
- Languages at home
- 95% English-only · Spanish 3% Tagalog/Filipino 1%
Political lean MEDSL · Jefferson
- 2024 margin
- Strong R (+23.6) · D 38.2% · R 61.8%
- 2008→2024 swing
- -18.3pp toward R · 2008: -5.3pp · 2024: -23.6pp
- All cycles
- 2024: R+23.6 2020: R+19.0 2016: R+22.4 2012: R+2.9 2008: R+5.3
Not yet ingested
- Civics
- —
Market trends
- HPI YoY
- ▲ 84.02%
- Current HPI
- 406.9439
- Rent YoY
- —
- Metro
- Watertown-Fort Drum, NY
- State GDP YoY
- ▲ 2.60%
- F500 in state
- 92
Industry mix (Fortune 500 HQ in NY)
| Industry | F500 HQs | Revenue |
|---|---|---|
| Financial Services | 10 | $950B |
|
||
| Consumer Goods | 9 | $162B |
|
||
| Insurance | 4 | $225B |
|
||
| Telecommunications | 2 | $144B |
|
||
| Pharmaceuticals | 2 | $112B |
|
||
| Media / Entertainment | 2 | $69B |
|
||
Price history
-0.9% since first listed3 events — show timeline
- 2026-05-06 Price Changed $221,900 CNYIS
- 2026-03-26 Listed $224,000 CNYIS
- 2025-06-13 Sold (Public Records) $1 Public Records
Property tax history
+0.2%/yrLatest (2025): $1,362 · -3.3% YoY. Source: county tax records.
Cash-flow waterfall
monthlySold comps — $/sqft
last 12 mo · ≤1 miLoading sold comps…