58 W Denis Ln · Coram, NY
Flood risk 9/10 · Severe
- FEMA flood zone
- X (unshaded)
- Chance of flooding over 30 yrs
- 0.99%
- Est. flood insurance / yr
- $507 – $1,088
Fire risk 2/10 · Minimal
- Est. fire insurance / yr
- $691 – $1,283
Heat risk 4/10 · Minor
- Hot days now (above 93°F)
- 7 days/yr
- Hot days in 30 yrs
- 18 days/yr
Wind risk 8/10 · Major
- Chance of severe wind over 30 yrs
- 80.0%
Air-quality risk 4/10 · Minor
- Unhealthy air days now
- 3 days/yr
- Unhealthy air days in 30 yrs
- 5 days/yr
Risk factors via First Street. Map © Google.
Why this score? — see what drove the D+ grade
The composite is a weighted blend of 9 inputs, each scored 0–100. Each bar is that input's sub-score; the figure is the points it added to the 100-point composite (weight × sub-score).
- Cash flow +16.0/30.0
- ARV discount +7.5/15.0
- 1% rule +6.9/10.0
- Schools +5.2/10.0
- DSCR +4.9/10.0
- Rent growth +3.7/5.0
- Livability +3.3/5.0
- Condition / age +2.5/5.0
- Appreciation +0.0/10.0
$350,000
🖨 Deal sheet 📄 Offer letter ✓ Due diligence
Listing remarks MLS
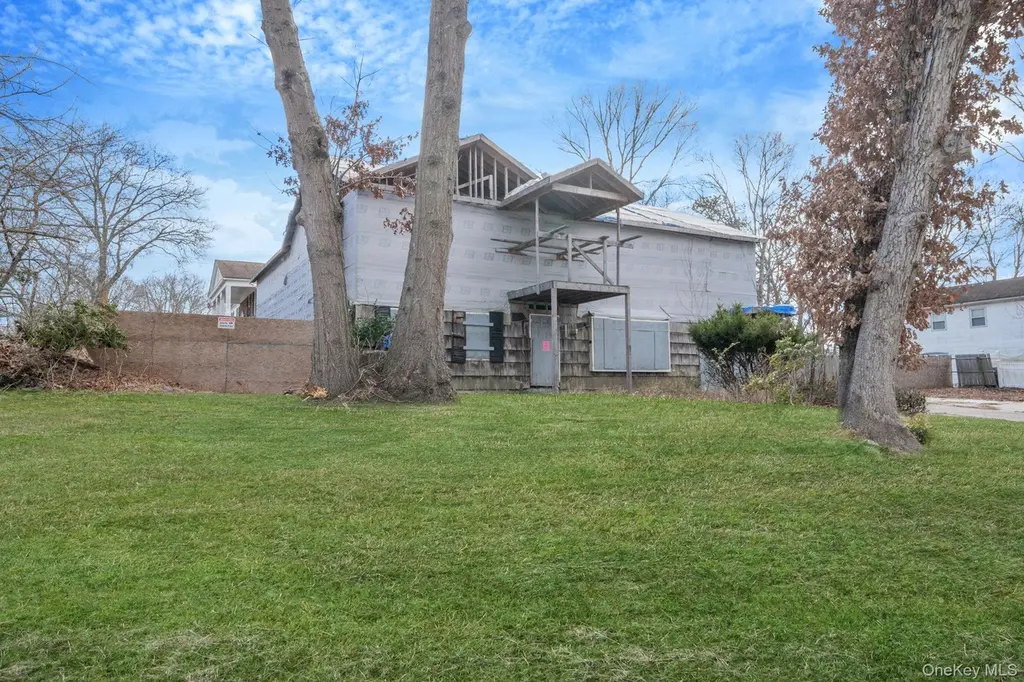
Amazing opportunity to complete an existing construction project. Property is being sold as is with approved plans and variances in place. The home is currently a shell, offering the next owner the chance to finish and customize to their vision. Situated on a desirable corner lot spanning approximately 0.34 acres. Call for additional details.
Key facts
- Corner lot
- 0.34 acre lot
- Pool
Tags
Neighborhood map
What this means for you Summary
Snapshot
- This is a 5-bed/3.0-bath single-family listed at $350k.
Deal economics
- At list price, monthly cash flow is $106 ($1k/yr) — positive.
- The deal already cash-flows at list — no discount required.
- Meets the 1% rule at list price ($4k rent vs $350k).
- Recommended offer: $308k (12.0% below list) — sets the bar for market timing.
- Cap rate 6.9% vs local median 3.5% in Coram — top-decile yield for the area; either an underpriced asset or a hidden risk that comps aren't pricing in. Stress-test before assuming the spread holds.
Location & tenants
- Location reads 66/100 on livability (#646 in NY) — a middle-class / working-renter tenant base. Strengths: employment A+, housing A+, schools B; Watch: amenities F, commute F, cost of living F.
- Longwood Central School District (rural): math 61% / reading 55% proficiency, ranked #235 of 590 in NY (top 40%) — acceptable for families but not a draw, mixed tenant base, ~2y average lease.
- Market conditions: Rents rising fast (+4.7%/yr); 232 active listings in the ZIP; 1 comparable units currently listed for rent nearby; solid renter incomes; 1,366 units permitted in Suffolk County in 2024 (216 in 5+ unit buildings).
- At $4,164/mo this rent would consume 48% of the median local household income ($103k/yr) (locally 994% of renters already pay >50% of income on rent) — very limited rent-growth headroom before tenants either downsize or default.
Forward outlook
- Local home prices are declining (-3.0%/yr); year-one equity from $2k of loan paydown is wiped out by about $10k of value loss. Plan a longer hold.
- Suffolk County population projected to shrink 5% by 2050 — rents likely to lag national; underwrite the cash flow, not the appreciation.
Negotiation context
- It's been on market 135 days — a 12% lower offer ($308k) is reasonable based on typical stale-listing flexibility.
- 3 sale attempts since 4y ago with the ask held roughly flat each time — persistent listings suggest the price (not the market) is what's stuck; bring a comps-based counter.
Risks & watch-outs
- Watch-outs: property tax is 3.9% of price; flood insurance adds $66/mo.
- Climate carrying-cost: severe flood risk; severe wind risk, 80% chance of damaging wind over 30y — expect insurance premiums to compound above CPI over the hold.
Questions for the listing agent
- It's been on market 135 days. Have you received any prior offers? Is the seller open to a 12% concession, seller financing, or rate buy-down credit?
- Built in 1974 — when were the roof, HVAC, electrical panel, plumbing, and water heater last replaced?
- Property tax is high relative to price — has the assessment been appealed recently, and will the sale trigger a re-assessment?
- What's the actual annual flood-insurance premium (NFIP or private), and is the property in a SFHA with mandatory coverage?
- Why hasn't it sold? Are there any deal-killer items the seller is aware of (foundation, flood, title, zoning, code violations)?
- Is there a deadline driving the sale (1031 exchange, divorce, estate, relocation)? That informs how much negotiation room exists.
- Schools are B-rated — typically a magnet for longer-tenancy family renters. What's the average tenant stay here, and is there a school-zone premium baked into asking?
- The area grade is low — what's the realistic commute time and amenity access for the typical tenant pool here? Any planned neighborhood developments (good or bad) we should know about?
- What's the average days-on-market for RENTAL listings here right now (not sales)? A rising rental-DOM trend means longer vacancies and softer asking-rent achievability than the comps imply.
- What's the recent tenant-quality profile in this submarket — average credit score on applications, eviction rate, late-payment / NSF rate, and stable-employment percentage? A property-management company in the area should have these aggregated.
- How much new for-sale + rental construction is in the pipeline within 1–3 miles? Heavy new supply typically softens prices + rents 12–24 months out; constrained supply supports both.
Investment metrics
- 1% rule
- 1.19% ✓
- Cap rate
- 6.88%
- Cash-on-cash
- 2.11%
- DSCR
- 1.09
- GRM
- 7.0
CMA / ARV
- ARV (median comp)
- $863,381
- List price
- $350,000
- Delta
- -59.46%
- Verdict
- UNDERPRICED
- Comps
- 6 within 1.0 mi
Show comp detail 3 sales within ~0.75 mi
| Address | Dist | Beds/Ba | Sqft | Sold | Price | $/sf | Match |
|---|---|---|---|---|---|---|---|
| 17 Erna Dr | 0.60mi | 4/3.0 (-1) | 1,593 (+6%) | 6mo | $530,000 | $333 | 53 |
| 12 Barberry Ln | 0.44mi | 4/2.0 (-1) | 1,300 (-14%) | 10mo | $480,000 | $369 | 39 |
| 29 Wilson Ave | 0.67mi | 4/2.0 (-1) | 1,716 (+14%) | 10mo | $575,000 | $335 | 28 |
Match score weights: distance 35% · size 25% · config 20% · recency 20%. Top-matched comps best support the ARV.
Projected returns pro-forma
-3.0% appreciation · 4.66% rent growth · sell at horizon
- IRR
- -11.7%
- Equity multiple
- 0.57×
- Total profit
- $-42,364
- Equity at exit
- $52,186
- IRR
- 0.5%
- Equity multiple
- 1.04×
- Total profit
- $3,977
- Equity at exit
- $30,262
Cash invested: $98,000 (down + closing). Projections, not guarantees.
Landlord ↔ Tenant lean methodology
- Overall (STATE)
- 15 Strongly Tenant-Friendly
- State New York
- 15 Strongly Tenant-Friendly · D+10
- County
- — inherits STATE
- City
- — inherits STATE
ZIP-level market 11727
- Rents YoY
- 4.7%
- Active inventory
- 232
- Price-to-rent
- 7.0×
Monthly cashflow live
- Estimated rent
- $4,164 medium interval (Pro) →
- Mortgage (P&I)
- −$1,835
- Tax from tax record
- −$1,136 /mo · $13,634/yr
- Insurance
- −$146
- Flood insurance flood zone
- −$66 /mo · $798/yr
- HOA
- −$0
- Vacancy / Maint / Mgmt
- −$875
- Net cashflow
- $106
Break-even live
UW: 25.0% down · 7.5% · 30yr · 1.5% tax · 5.0% vac · 8.0% maint · 8.0% mgmt
Financing live
Cash to close
- Down payment
- $87,500
- Closing costs
- $10,500
- Reserves months
- —
- Total cash needed
- —
Loan-product check · same deal, 3 products live
Conventional
25% down · 7.5% · 30yr
- Down + closing
- —
- Monthly P&I
- —
- Monthly cashflow
- —
- DSCR
- —
- Eligible?
- —
Personal DTI + credit; lowest rate.
DSCR
20% down · 8.5% · 30yr
- Down + closing
- —
- Monthly P&I
- —
- Monthly cashflow
- —
- DSCR
- —
- Eligible?
- —
No personal income docs; deal must DSCR.
Hard money
10% down · 12.0% · 12mo
- Down + closing
- —
- Monthly P&I
- —
- Monthly cashflow
- —
- DSCR
- —
- Eligible?
- —
Short-term bridge; refi at stabilization.
Rent comps 1 comps
| Address | Beds | Baths | Sqft | Rent | $/sqft | DOM | Units | Dist |
|---|---|---|---|---|---|---|---|---|
| 6 Turnberry Ct Middle Island, NY | 4.0 | 2.5 | 1772 | $4,000 | $2.26 | 19d | 1 | 1.44mi |
Listing history 13 events
-
2026-06-13status $350,000 Pending 135 DOM
-
2026-06-02days on market $350,000 Active 135 DOM
-
2026-06-01days on market $350,000 Active 134 DOM
-
2026-05-31days on market $350,000 Active 133 DOM
-
2026-01-18$350,000 Active 344-char remark
Show marketing remark (344 chars)
Amazing opportunity to complete an existing construction project. Property is being sold as is with approved plans and variances in place. The home is currently a shell, offering the next owner the chance to finish and customize to their vision. Situated on a desirable corner lot spanning approximately 0.34 acres. Call for additional details.
-
2025-10-01historical
-
2025-09-08price $420,000
-
2025-08-05price $425,000
-
2025-06-27$499,000 Active
-
2022-11-01soldstatus $365,000
-
2022-09-01soldstatus $365,000 Closed
-
2022-07-19status Pending
-
2022-07-01$379,000 Active
ⓘ Source: listings_history table (triggers on properties + properties_extension) + one-shot
backfill from property_details.listing_events for pre-trigger history.
Tax reassessment forecast NY · Partial reset (capped growth)
- Current annual tax
- $13,634 · $1,136/mo
- Projected year-2 tax
- $13,634 · $1,136/mo
- Expected delta
- $0/yr ($0/mo · 0.0%)
ⓘ Screening estimate from a state-policy table — verify with the county assessor before closing.
Climate risk First Street
- Flood 9/10 Extreme FEMA zone X (unshaded) · 99% chance over 30 yrs
- Wildfire 2/10 Low
- Heat 4/10 Moderate 7 d/yr ≥93°F today · 18 d/yr by 30 yrs out
- Wind 8/10 Severe 80% chance of damaging wind over 30 yrs
- Air quality 4/10 Moderate 3 unhealthy d/yr today · 5 by 30 yrs out
Nearby sold comps map
Loading sold comps map…
Walkable amenities ~0.75 mi
Loading nearby amenities…
Taxation est. · year 1
- Rental income
- $49,972
- − Mortgage interest
- −$19,605
- − Property taxes
- −$13,634
- − Insurance
- −$2,548
- − Repairs & maintenance
- −$3,998
- − Management
- −$3,998
- − Depreciation
- −$10,182
- Taxable loss
- −$3,992
- Est. tax savings @ 24.0%
- +$958
- After-tax cash flow
- $2,229/yr
For passive investors: Depreciation is non-cash, so a rental often shows a tax loss while cash-flowing — sheltering income. Rental losses are passive: they offset passive income freely, and up to $25,000/yr can offset ordinary (W-2) income if you actively participate and your MAGI is under $100k (phasing out to $0 by $150k); unused losses carry forward. On sale, claimed depreciation is recaptured at up to 25%, and gains may owe capital-gains tax (a 1031 exchange can defer both). Figures are a year-1 estimate at your 24.0% rate — not tax advice; consult a CPA.
Schools (NCES district)
- District
- Longwood Central School District
- NCES district ID
- 3619230
- Math proficiency
- 61% ▬ 0.00%
- Reading proficiency
- 55% ▼ -1.00%
- Median HH income
- $72,748
- Composite
- 51.63/100
- National rank
- #1703
- State rank
- #235 of 590 in NY
Livability — Coram
- Score
- 66/100
- State rank
- #646
- US rank
- #12097
Category grades
Schools grade is shown separately in the Schools card above.
Census & demographics
- Census place
- Coram, NY
- County
- Suffolk County · 679,920 people
- City population
- 28,495
- Metro
- New York-Newark-Jersey City, NY-NJ-PA
- Population (ZIP)
- 28,495
- Household income
- $103,287
- Rent vs Own
- Severe rent burden
- 994.0
Population outlook (Suffolk County) Hauer SSP2
- Today (2025)
- 1,505,262 people
- By 2030
- 1,498,318 · -0.5%
- By 2040
- 1,471,101 · -2.3%
- By 2050
- 1,424,848 · -5.3%
- By 2075
- 1,337,157 · -11.2%
- By 2100
- 1,217,720 · -19.1%
Race, ethnicity, and origin ACS 2023
- Neighborhood character
- Diverse neighborhood (Simpson 0.69)
- Race & ethnicity
- White 50% Hispanic / Latino 19% Two or more races 18% Black 15% Asian 6%
- Hispanic origin (detail)
- Mexican 1% Puerto Rican 8% Dominican 4%
- Common ancestry
- Romanian 4% Scotch-Irish 2% Lithuanian 1%
- Foreign-born
- 22% · Canada, South Korea, Jamaica
- Languages at home
- 72% English-only · Spanish 12% Other Indo-European 8% Arabic 2%
Political lean MEDSL · Suffolk
- 2024 margin
- Lean R (+10.0) · D 45.0% · R 55.0%
- 2008→2024 swing
- -16.0pp toward R · 2008: 6.0pp · 2024: -10.0pp
- All cycles
- 2024: R+10.0 2020: R+0.0 2016: R+8.2 2012: D+2.9 2008: D+6.0
Not yet ingested
- Civics
- —
Market trends
- HPI YoY
- ▼ -571.88%
- Current HPI
- 388.8297
- Rent YoY
- ▲ 4.66%
- Metro
- New York-Newark-Jersey City, NY-NJ-PA
- State GDP YoY
- ▲ 2.60%
- F500 in state
- 92
Industry mix (Fortune 500 HQ in NY)
| Industry | F500 HQs | Revenue |
|---|---|---|
| Financial Services | 10 | $950B |
|
||
| Consumer Goods | 9 | $162B |
|
||
| Insurance | 4 | $225B |
|
||
| Telecommunications | 2 | $144B |
|
||
| Pharmaceuticals | 2 | $112B |
|
||
| Media / Entertainment | 2 | $69B |
|
||
Price history
-7.7% since first listed9 events — show timeline
- 2026-01-18 Listed $350,000 OneKey® MLS as Distributed by MLS Grid
- 2025-10-01 Listing Removed — OneKey® MLS as Distributed by MLS Grid
- 2025-09-08 Price Changed $420,000 OneKey® MLS as Distributed by MLS Grid
- 2025-08-05 Price Changed $425,000 OneKey® MLS as Distributed by MLS Grid
- 2025-06-27 Listed $499,000 OneKey® MLS as Distributed by MLS Grid
- 2022-11-01 Sold (Public Records) $365,000 Public Records
- 2022-09-01 Sold (MLS) $365,000 OneKey® MLS as Distributed by MLS Grid
- 2022-07-19 Pending — OneKey® MLS as Distributed by MLS Grid
- 2022-07-01 Listed $379,000 OneKey® MLS as Distributed by MLS Grid
Property tax history
+9.2%/yrLatest (2025): $13,634 · +0.0% YoY. Source: county tax records.
Cash-flow waterfall
monthlySold comps — $/sqft
last 12 mo · ≤1 miLoading sold comps…