501 Lee St · Leesburg, FL
Flood risk 1/10 · Minimal
- FEMA flood zone
- X (unshaded)
- Chance of flooding over 30 yrs
- 0.0%
- Est. flood insurance / yr
- $507 – $1,088
Fire risk 2/10 · Minimal
- Est. fire insurance / yr
- $947 – $1,759
Heat risk 8/10 · Major
- Hot days now (above 107°F)
- 7 days/yr
- Hot days in 30 yrs
- 22 days/yr
Wind risk 9/10 · Severe
- Chance of severe wind over 30 yrs
- 99.0%
Air-quality risk 2/10 · Minimal
- Unhealthy air days now
- 1 days/yr
- Unhealthy air days in 30 yrs
- 1 days/yr
Risk factors via First Street. Map © Google.
Why this score? — see what drove the C+ grade
The composite is a weighted blend of 9 inputs, each scored 0–100. Each bar is that input's sub-score; the figure is the points it added to the 100-point composite (weight × sub-score).
- Cash flow +21.6/30.0
- ARV discount +15.0/15.0
- DSCR +6.9/10.0
- 1% rule +4.5/10.0
- Schools +4.2/10.0
- Livability +3.1/5.0
- Condition / age +2.5/5.0
- Rent growth +2.3/5.0
- Appreciation +0.0/10.0
$160,000
🖨 Deal sheet (PDF) 📄 Offer letter ✓ Due diligence
Listing remarks
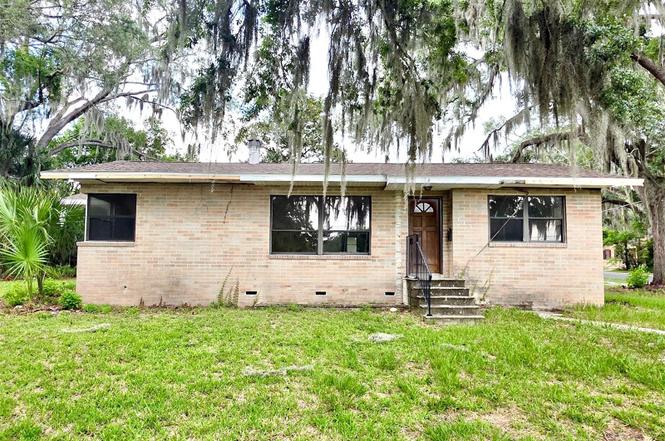
Under contract-accepting backup offers. INVESTOR SPECIAL! Great opportunity to transform this 3-bedroom, 2-bath home into a standout property. Situated on a spacious corner lot with mature shade trees, this home offers a solid start for your next renovation project. A brand-new roof was installed in 2026, providing a valuable head start on improvements. The interior has already been taken down to the studs in key areas, with demolition complete and the kitchen and bathrooms gutted, making it ready for your vision and design selections. Whether you're looking for a fix-and-flip, rental investment, or a custom renovation project, this property offers endless potential. Conveniently located in
Key facts
- Brand new roof
- Mature shade trees
- Corner lot
Tags
Property features AI
Finance
- Other: Zoned R-1; Lot size about 0.37 acres
- Financial info: No lease restrictions; Property taxed (tax details not included)
- HOA & community: No HOA
Exterior
- Parking: Covered driveway parking; One-car carport
- Security: No security features listed
- Utilities: Public water; Public sewer; Cable available; Broadband/high-speed internet available
- Home design: Single-family residence; One story; Faces south; Fixer condition
- Construction: Brick construction; Shingle roof; Crawlspace foundation; Built area approx. 1,440 total; living area approx. 1,200
- Exterior features: Corner lot; Asphalt road access; Lot dimensions about 135 x 121
Interior
- Kitchen: No appliances listed
- Bedrooms: Three bedrooms
- Flooring: Wood flooring
- Bathrooms: Two full bathrooms
- Heating & cooling: Electric heating; Wall/window air conditioning units
- Interior features: No interior features listed
- Laundry & utility: No laundry features listed
Neighborhood map
What this means for you Summary
Snapshot
- This is a 3-bed/2.0-bath single-family listed at $160k.
Deal economics
- At list price, monthly cash flow is $244 ($3k/yr) — positive.
- The deal already cash-flows at list — no discount required.
- To meet the 1% rule (rent ≥ 1% of price), the offer needs to be $152k (5.2% below list).
- Recommended offer: $152k (5.2% below list) — sets the bar for 1% rule.
- Cap rate 8.1% vs local median 4.4% in Leesburg — top-decile yield for the area; either an underpriced asset or a hidden risk that comps aren't pricing in. Stress-test before assuming the spread holds.
Location & tenants
- Location reads 62/100 on livability (#751 in FL) — a middle-class / working-renter tenant base. Strengths: cost of living A+, housing A+; Watch: crime D, amenities F, commute F.
- Lake (suburban): math 49% / reading 50% proficiency, ranked #37 of 73 in FL (top 51%) — families likely to look elsewhere, expect single-tenant / working-renter base with shorter leases.
- Zoned schools: Leesburg Elementary School (math 31% / reading 32%, grade F, #1,841 of 2,144 statewide, top 86%, 822 students, 71% FRL); Carver Middle School (math 41% / reading 41%, grade F, #353 of 571 statewide, top 63%, 837 students, 65% FRL); Leesburg High School (math 24% / reading 32%, grade F, #464 of 667 statewide, top 70%, 1,641 students, 58% FRL) — zoned schools average 65% FRL vs 49% district-wide (15 pts higher); higher-poverty schools than district average — tighter screening recommended.
- Zoned-school proficiency averages 34% at this address vs 50% district-wide (-16 pts) — the specific schools serving this property underperform the Lake average; the district grade overstates school quality for this exact location.
- Market conditions: Rents soft (-0.9%/yr); 798 active listings in the ZIP; 36 comparable units currently listed for rent nearby; rentals at typical pace (median 26d on market — plan ~3-4 weeks tenant-placement turnaround); 4,799 units permitted in Lake County in 2024 (814 in 5+ unit buildings).
- This rent runs 31% of the median local income ($58k/yr) — at the standard rent-burdened threshold; future hikes will face affordability resistance.
Forward outlook
- Local home prices are declining (-3.0%/yr); year-one equity from $1k of loan paydown is wiped out by about $5k of value loss. Plan a longer hold.
- Lake County population projected at +37% by 2050 — long-run rental-demand tailwind backs the buy-and-hold thesis.
Negotiation context
- Only 3 days on market — expect competitive offers; lowballing is unlikely to land.
- Current owner paid $57k; list at $160k implies a 181% gain — meaningful room to come down on a strong offer.
Risks & watch-outs
- Watch-outs: built in 1953 — expect roof / HVAC / electrical / plumbing capex.
- Climate carrying-cost: severe wind risk, 99% chance of damaging wind over 30y; extreme-heat days projected 7→22/yr by 2055 (HVAC capex compounding) — expect insurance premiums to compound above CPI over the hold.
Questions for the listing agent
- Built in 1953 — when were the roof, HVAC, electrical panel, plumbing, and water heater last replaced?
- Is there a deadline driving the sale (1031 exchange, divorce, estate, relocation)? That informs how much negotiation room exists.
- Schools are D-rated, which usually means shorter tenancies and higher turnover. Who's the typical renter profile here, and what's been the actual vacancy rate?
- Crime grade is D in this area — have there been break-ins, vandalism, or insurance claims at this property in the last 3 years? What carrier currently insures it and at what premium?
- What's the average days-on-market for RENTAL listings here right now (not sales)? A rising rental-DOM trend means longer vacancies and softer asking-rent achievability than the comps imply.
- What's the recent tenant-quality profile in this submarket — average credit score on applications, eviction rate, late-payment / NSF rate, and stable-employment percentage? A property-management company in the area should have these aggregated.
- How much new for-sale + rental construction is in the pipeline within 1–3 miles? Heavy new supply typically softens prices + rents 12–24 months out; constrained supply supports both.
Investment metrics
- 1% rule
- 0.95% ✗
- Cap rate
- 8.12%
- Cash-on-cash
- 6.54%
- DSCR
- 1.29
- GRM
- 8.8
CMA / ARV
- ARV (on-the-fly)
- $211,200
- Comps found
- 8
Show comp detail 8 sales within ~0.75 mi
| Address | Dist | Beds/Ba | Sqft | Sold | Price | $/sf | Match |
|---|---|---|---|---|---|---|---|
| 509 Lee St | 0.05mi | 3/1.0 | 1,265 (+5%) | 9mo | $265,000 | $209 | 78 |
| 911 Oak Dr | 0.40mi | 3/2.0 | 1,120 (-7%) | 14mo | $167,937 | $150 | 59 |
| 1016 Perkins St | 0.57mi | 3/1.5 | 1,137 (-5%) | 6mo | $175,000 | $154 | 58 |
| 1101 Mizell Rd | 0.60mi | 3/2.0 | 1,248 (+4%) | 12mo | $220,000 | $176 | 55 |
| 1200 Sunshine Ave | 0.22mi | 3/2.0 | 1,360 (+13%) | 16mo | $133,273 | $98 | 54 |
| 1404 High St | 0.54mi | 3/1.0 | 1,246 (+4%) | 14mo | $164,000 | $132 | 53 |
| 601 S 12th St | 0.74mi | 3/2.0 | 1,327 (+11%) | 10mo | $240,000 | $181 | 40 |
| 1110 Cedar St | 0.71mi | 2/1.5 (-1) | 1,046 (-13%) | 13mo | $235,000 | $225 | 28 |
Match score weights: distance 35% · size 25% · config 20% · recency 20%. Top-matched comps best support the ARV.
Projected returns pro-forma
-3.0% appreciation · 0.0% rent growth · sell at horizon
- IRR
- -9.3%
- Equity multiple
- 0.67×
- Total profit
- $-14,894
- Equity at exit
- $23,857
- IRR
- -4.0%
- Equity multiple
- 0.77×
- Total profit
- $-10,417
- Equity at exit
- $13,834
Cash invested: $44,800 (down + closing). Projections, not guarantees.
Landlord ↔ Tenant lean methodology
- Overall (STATE)
- 87 Strongly Landlord-Friendly
- State Florida
- 87 Strongly Landlord-Friendly · R+3
- County
- — inherits STATE
- City
- — inherits STATE
ZIP-level market 34748
- Home prices YoY
- -25.3%
- Rents YoY
- -0.9%
- Active inventory
- 798
- Price-to-rent
- 8.8×
Monthly cashflow live
- Estimated rent
- $1,518 high interval (Pro) →
- Mortgage (P&I)
- −$839
- Tax from tax record
- −$49 /mo · $587/yr
- Insurance
- −$67
- HOA
- −$0
- Vacancy / Maint / Mgmt
- −$319
- Net cashflow
- $244
Break-even live
Sensitivity live
| Price | -10% $335 | -5% $289 | +0% $244 | +5% $199 | +10% $154 |
|---|---|---|---|---|---|
| Rent | -10% $124 | -5% $184 | +0% $244 | +5% $304 | +10% $364 |
| Rate | -1.0pp $325 | -0.5pp $285 | base $244 | +0.5pp $203 | +1.0pp $161 |
UW: 25.0% down · 7.5% · 30yr · 1.5% tax · 5.0% vac · 8.0% maint · 8.0% mgmt
Financing live
Cash to close
- Down payment
- $40,000
- Closing costs
- $4,800
- Reserves months
- —
- Total cash needed
- —
Loan-product check · same deal, 3 products live
Conventional
25% down · 7.5% · 30yr
- Down + closing
- —
- Monthly P&I
- —
- Monthly cashflow
- —
- DSCR
- —
- Eligible?
- —
Personal DTI + credit; lowest rate.
DSCR
20% down · 8.5% · 30yr
- Down + closing
- —
- Monthly P&I
- —
- Monthly cashflow
- —
- DSCR
- —
- Eligible?
- —
No personal income docs; deal must DSCR.
Hard money
10% down · 12.0% · 12mo
- Down + closing
- —
- Monthly P&I
- —
- Monthly cashflow
- —
- DSCR
- —
- Eligible?
- —
Short-term bridge; refi at stabilization.
Rent comps 36 comps
| Address | Beds | Baths | Sqft | Rent | $/sqft | DOM | Units | Dist |
|---|---|---|---|---|---|---|---|---|
| 706 Lee St Apt B Leesburg, FL | 2.0 | 1.0 | 860 | $1,200 | $1.40 | 25d | 1 | 0.15mi |
| 643 W Oak Terrace Dr Unit B1 Leesburg, FL | 2.0 | 2.0 | 1089 | $1,300 | $1.19 | 25d | 1 | 0.18mi |
| 1112 W Main St Unit B-5 Leesburg, FL | 2.0 | 2.0 | 1000 | $1,450 | $1.45 | 0d | 1 | 0.41mi |
| 200 S 11th St Leesburg, FL | 2.0 | 2.0 | 1379 | $1,675 | $1.21 | 25d | 1 | 0.51mi |
| 200 S 11th St Unit 102 Leesburg, FL | 2.0 | 2.5 | 1379 | $1,675 | $1.21 | 25d | 1 | 0.51mi |
| 301 S 11th St Leesburg, FL | 2.0 | 1.0 | 816 | $1,450 | $1.78 | 25d | 1 | 0.55mi |
| 400 S 6th St Leesburg, FL | 2.0 | 1.0 | 700 | $1,250 | $1.79 | 25d | 1 | 0.64mi |
| 425 S 9th St Leesburg, FL | 2.0 | 1.0–2.0 | 911 | $1,449 | $1.59 | 0d | 6 | 0.66mi |
| 325 S 2nd St Unit 206 Leesburg, FL | 2.0 | 2.0 | 1000 | $1,700 | $1.70 | 6d | 1 | 0.69mi |
| 1801 Center St Unit 2 Leesburg, FL | 2.0 | 1.0 | 754 | $1,300 | $1.72 | 25d | 1 | 0.81mi |
| 913 Sumter St Unit 102 Leesburg, FL | 2.0 | 2.0 | 1080 | $1,395 | $1.29 | 19d | 1 | 0.82mi |
| 1411 Hill St Leesburg, FL | 2.0 | 1.0 | 1000 | $1,150 | $1.15 | 25d | 1 | 0.83mi |
| 1415 Hill St Leesburg, FL | 2.0 | 1.0 | 1000 | $1,150 | $1.15 | 25d | 1 | 0.83mi |
| 1419 Hill St Leesburg, FL | 2.0 | 1.0 | 840 | $1,120 | $1.33 | 25d | 1 | 0.83mi |
| 716 Marietta St Leesburg, FL | 3.0 | 2.0 | 1250 | $1,600 | $1.28 | 25d | 1 | 0.84mi |
| 200 S Moss St Leesburg, FL | 3.0 | 2.0 | 968 | $1,500 | $1.55 | 25d | 1 | 0.85mi |
| 1020 Birchwood Ct Unit 2 Leesburg, FL | 2.0 | 1.0 | 1230 | $1,250 | $1.02 | 19d | 1 | 0.90mi |
| 1711 Birchwood Cir Unit 2 Leesburg, FL | 2.0 | 1.0 | 770 | $900 | $1.17 | 25d | 1 | 0.90mi |
| 1220 W Dixie Ave Leesburg, FL | 3.0 | 2.0 | 1304 | $1,600 | $1.23 | 6d | 1 | 0.95mi |
| 813 S 9th St Leesburg, FL | 2.0 | 2.0 | 1400 | $2,000 | $1.43 | 25d | 1 | 1.02mi |
| 1009 McCormack St Leesburg, FL | 2.0 | 1.0 | 1400 | $1,025 | $0.73 | 25d | 1 | 1.02mi |
| 1 Herald Dr Leesburg, FL | 2.0 | 1.0–1.5 | 970 | $1,524 | $1.57 | 0d | 3 | 1.04mi |
| 1223 Pamela St Leesburg, FL | 2.0 | 1.0 | 894 | $1,399 | $1.56 | 25d | 1 | 1.05mi |
| 1013 Beecher St Unit 1 Leesburg, FL | 3.0 | 1.0 | 900 | $1,250 | $1.39 | 23d | 1 | 1.08mi |
| 1015 Beecher St Unit 1 Leesburg, FL | 2.0 | 1.0 | 853 | $1,100 | $1.29 | 25d | 1 | 1.10mi |
| 210 N Lone Oak Dr Unit 1 Leesburg, FL | 2.0 | 1.0 | 912 | $1,250 | $1.37 | 16d | 1 | 1.16mi |
| 1111 Tuskegee St Unit a Leesburg, FL | 2.0 | 1.0 | 754 | $1,095 | $1.45 | 0d | 1 | 1.26mi |
| 1009 Nebraska St Leesburg, FL | 3.0 | 1.0 | 864 | $1,850 | $2.14 | 14d | 1 | 1.29mi |
| 1175 Bentley Rd Leesburg, FL | 2.0–3.0 | 1.0–1.5 | 938 | $1,459 | $1.56 | 4d | 3 | 1.30mi |
| 1197 Bentley Rd Leesburg, FL | 2.0 | 1.5 | 938 | $1,379 | $1.47 | 25d | 1 | 1.31mi |
| 1187 Bentley Rd Unit 1 Leesburg, FL | 3.0 | 1.0 | 909 | $1,459 | $1.61 | 5d | 1 | 1.32mi |
| 1604 Woodlyn Dr Leesburg, FL | 3.0 | 1.5 | 1088 | $1,500 | $1.38 | 25d | 1 | 1.39mi |
| 904 S Lake St Leesburg, FL | 1.0–3.0 | 1.0–2.0 | 1140 | $2,239 | $1.96 | 0d | 41 | 1.39mi |
| 1401 Floradel Ave Leesburg, FL | 2.0 | 1.0 | 1190 | $1,495 | $1.26 | 5d | 1 | 1.44mi |
| 1001 Crawford St Leesburg, FL | 3.0 | 1.0 | 800 | $1,100 | $1.38 | 13d | 1 | 1.44mi |
| 1001 Crawford St Unit 1 Leesburg, FL | 3.0 | 1.0 | 800 | $1,100 | $1.38 | 16d | 1 | 1.44mi |
Listing history 5 events
-
2026-06-17status $160,000 Pending 3 DOM
-
2026-06-17days on market $160,000 Active 3 DOM
-
2026-06-16days on market $160,000 Active 2 DOM
-
2026-06-15remarks 699-char remark
-
2026-06-15$160,000 Active 1 DOM
ⓘ Source: listings_history table (triggers on properties + properties_extension) + one-shot
backfill from property_details.listing_events for pre-trigger history.
Tax reassessment forecast FL · Resets to sale price
- Current annual tax
- $587 · $49/mo
- Projected year-2 tax
- $1,328 · $111/mo
- Expected delta
- +$741/yr (+$62/mo · 126.1%)
ⓘ Screening estimate from a state-policy table — verify with the county assessor before closing.
Climate risk First Street
- Flood 1/10 Low FEMA zone X (unshaded) · 0% chance over 30 yrs
- Wildfire 2/10 Low
- Heat 8/10 Severe 7 d/yr ≥107°F today · 22 d/yr by 30 yrs out
- Wind 9/10 Extreme 99% chance of damaging wind over 30 yrs
- Air quality 2/10 Low 1 unhealthy d/yr today · 1 by 30 yrs out
Nearby sold comps map
Loading sold comps map…
Walkable amenities ~0.75 mi
Loading nearby amenities…
Taxation est. · year 1
- Rental income
- $18,210
- − Mortgage interest
- −$8,962
- − Property taxes
- −$587
- − Insurance
- −$800
- − Repairs & maintenance
- −$1,457
- − Management
- −$1,457
- − Depreciation
- −$4,655
- Taxable income
- $292
- Est. tax owed @ 24.0%
- −$70
- After-tax cash flow
- $2,860/yr
For passive investors: Depreciation is non-cash, so a rental often shows a tax loss while cash-flowing — sheltering income. Rental losses are passive: they offset passive income freely, and up to $25,000/yr can offset ordinary (W-2) income if you actively participate and your MAGI is under $100k (phasing out to $0 by $150k); unused losses carry forward. On sale, claimed depreciation is recaptured at up to 25%, and gains may owe capital-gains tax (a 1031 exchange can defer both). Figures are a year-1 estimate at your 24.0% rate — not tax advice; consult a CPA.
Schools (NCES district)
- District
- Lake
- NCES district ID
- 1201050
- Math proficiency
- 49% ▼ -7.00%
- Reading proficiency
- 50% ▼ -4.00%
- Median HH income
- $46,632
- Composite
- 42.05/100
- National rank
- #3327
- State rank
- #37 of 73 in FL
Livability — Leesburg
- Score
- 62/100
- State rank
- #751
- US rank
- #16429
Category grades
Schools grade is shown separately in the Schools card above.
Census & demographics
- Census place
- Leesburg, FL
- County
- Lake County · 364,602 people
- City population
- 70,232
- Metro
- Orlando-Kissimmee-Sanford, FL
- Population (ZIP)
- 48,095
- Household income
- $58,192
- Rent vs Own
- Severe rent burden
- 1745.0
Population outlook (Lake County) Hauer SSP2
- Today (2025)
- 386,640 people
- By 2030
- 417,107 · +7.9%
- By 2040
- 476,676 · +23.3%
- By 2050
- 531,296 · +37.4%
- By 2075
- 648,303 · +67.7%
- By 2100
- 698,530 · +80.7%
Race, ethnicity, and origin ACS 2023
- Neighborhood character
- Majority White (64%)
- Race & ethnicity
- White 64% Black 16% Hispanic / Latino 15% Two or more races 9% Asian 1%
- Hispanic origin (detail)
- Mexican 4% Puerto Rican 5% Cuban 3%
- Common ancestry
- Romanian 3% Lithuanian 3% Slovak 2%
- Foreign-born
- 9% · Canada, Vietnam, Jamaica
- Languages at home
- 88% English-only · Spanish 10% French/Haitian/Cajun 1%
Political lean MEDSL · Lake
- 2024 margin
- Strong R (+24.7) · D 37.3% · R 62.0%
- 2008→2024 swing
- -11.2pp toward R · 2008: -13.5pp · 2024: -24.7pp
- All cycles
- 2024: R+24.7 2020: R+20.0 2016: R+23.1 2012: R+17.1 2008: R+13.5
Not yet ingested
- Civics
- —
Market trends
- HPI YoY
- ▼ -88.97%
- Current HPI
- 262.1766
- Rent YoY
- ▼ -0.95%
- Metro
- Orlando-Kissimmee-Sanford, FL
- State GDP YoY
- ▲ 3.28%
- F500 in state
- 36
Industry mix (Fortune 500 HQ in FL)
| Industry | F500 HQs | Revenue |
|---|---|---|
| Industrial Technology | 2 | $29B |
|
||
| Insurance | 2 | $17B |
|
||
| Retail | 1 | $60B |
|
||
| Technology Distribution | 1 | $58B |
|
||
| Homebuilding | 1 | $35B |
|
||
| Technology Manufacturing | 1 | $35B |
|
||
Price history
+180.7% since first listed3 events — show timeline
- 2026-06-14 Listed $160,000 Stellar MLS as Distributed by MLS Grid
- 1998-04-07 Sold (Public Records) $56,900 Public Records
- 1989-08-01 Sold (Public Records) $57,000 Public Records
Property tax history
+5.1%/yrLatest (2025): $587 · +1.9% YoY. Source: county tax records.
Cash-flow waterfall
monthlySold comps — $/sqft
last 12 mo · ≤1 miLoading sold comps…