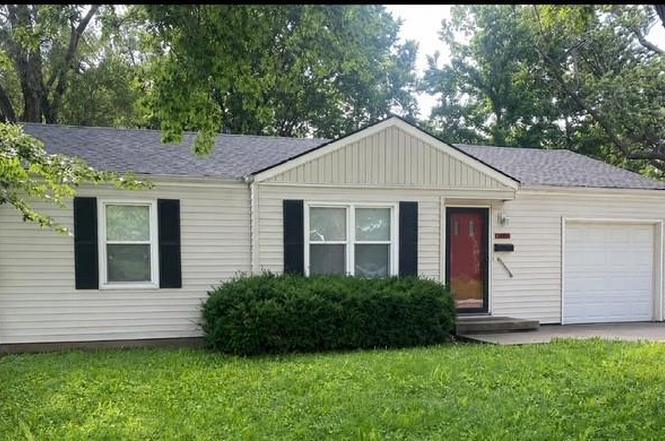
3020 S Norton Ave · Independence, MO
Flood risk 1/10 · Minimal
- FEMA flood zone
- X (unshaded)
- Chance of flooding over 30 yrs
- 0.0%
- Est. flood insurance / yr
- $473 – $860
Fire risk 1/10 · Minimal
- Est. fire insurance / yr
- $1,054 – $1,958
Heat risk 4/10 · Minor
- Hot days now (above 106°F)
- 7 days/yr
- Hot days in 30 yrs
- 17 days/yr
Wind risk 2/10 · Minimal
- Chance of severe wind over 30 yrs
- —
Air-quality risk 3/10 · Minor
- Unhealthy air days now
- 3 days/yr
- Unhealthy air days in 30 yrs
- 3 days/yr
Risk factors via First Street. Map © Google.
Why this score? — see what drove the D+ grade
The composite is a weighted blend of 9 inputs, each scored 0–100. Each bar is that input's sub-score; the figure is the points it added to the 100-point composite (weight × sub-score).
- ARV discount +15.0/15.0
- Cash flow +14.0/30.0
- DSCR +4.3/10.0
- Livability +4.1/5.0
- Rent growth +3.9/5.0
- 1% rule +2.9/10.0
- Schools +2.7/10.0
- Condition / age +2.5/5.0
- Appreciation +0.0/10.0
$139,500
🖨 Deal sheet (PDF) 📄 Offer letter ✓ Due diligence
Listing remarks
Charming 2 -bedroom, 1 bath home featuring newly refinished hardwood floors throughout the living room and bedrooms . Enjoy peace of mind with a new roof and air conditioner installed in 2025. The home offers all replacement windows for added efficiency and comfort. The spacious inside-entry basement includes newly painted floors, providing excellent additional living space for recreation, hobbies, or storage. A possibility for a non-conforming bedroom in the basement offers added flexibility for guests, office space, or a workout room. Step outside to a fenced backyard perfect for pets, gardening, or outdoor entertaining. This home is a good opportunity for first-time home buyers, down-s
Key facts
- New air conditioner
- Fenced backyard
- New roof
Tags
Property features AI
Finance
- HOA & community: No association fees
Exterior
- Parking: Attached garage with garage door opener; garage faces front (1 car)
- Security: Smoke detector(s)
- Utilities: Public water; Public sewer; Cable available, fiber available, high-speed internet available
- Home design: Single-family residence; Residential property; Ranch style; One story
- Construction: Frame construction with vinyl and wood siding; Composition roof; Basement (inside entrance, unfinished, partial)
- Exterior features: City lot in city limits; Level lot; Paved road with public maintenance
Interior
- Kitchen: Dishwasher; Disposal; Microwave; Refrigerator; Electric range; Kitchen/dining combo
- Bedrooms: 2 bedrooms on the main level
- Flooring: Vinyl flooring; Wood flooring
- Bathrooms: 1 full bathroom
- Heating & cooling: Natural gas heating; Electric cooling
- Interior features: Ceiling fan(s); Smoke detector(s); Ranch floor plan
- Laundry & utility: Laundry in basement; Sump pump in basement
Neighborhood map
What this means for you Summary
Snapshot
- This is a 2-bed/1.0-bath single-family listed at $140k.
Deal economics
- At list price, monthly cash flow is $19 ($227/yr) — positive.
- The deal already cash-flows at list — no discount required.
- To meet the 1% rule (rent ≥ 1% of price), the offer needs to be $110k (20.9% below list).
- Recommended offer: $110k (20.9% below list) — sets the bar for 1% rule.
- Cap rate 6.5% vs local median 5.0% in Independence — meaningfully above typical; check what's discounted (condition, days-on-market, listing class) to confirm the premium yield is real.
Location & tenants
- Location reads 82/100 on livability (#10 in MO, #1,296 nationally) — a professional / high-income tenant draw. Strengths: amenities A+, commute A+, cost of living A+; Watch: employment D+, crime F.
- Independence 30 (suburban): math 26% / reading 38% proficiency, ranked #252 of 324 in MO (top 78%) — families likely to look elsewhere, expect single-tenant / working-renter base with shorter leases.
- Zoned schools: Three Trails Elem. (math 37% / reading 32%, grade F, #676 of 1,115 statewide, top 66%, 317 students, 75% FRL); Clifford H. Nowlin Middle (math 13% / reading 29%, grade F, #342 of 391 statewide, top 88%, 875 students, 80% FRL); Van Horn High (math 13% / reading 27%, grade F, #472 of 521 statewide, top 91%, 1,047 students, 72% FRL) — zoned schools average 76% FRL vs 58% district-wide (17 pts higher); higher-poverty schools than district average — tighter screening recommended.
- Market conditions: Rents rising fast (+5.4%/yr); 135 active listings in the ZIP; 19 comparable units currently listed for rent nearby; rentals at typical pace (median 23d on market — plan ~3-4 weeks tenant-placement turnaround); 4,002 units permitted in Jackson County in 2024 (2,271 in 5+ unit buildings).
Forward outlook
- Local home prices are declining (-3.0%/yr); year-one equity from $964 of loan paydown is wiped out by about $4k of value loss. Plan a longer hold.
- Jackson County population projected at +4% by 2050 — modest demand growth; plan on rents tracking national, not racing it.
Negotiation context
- Only 7 days on market — expect competitive offers; lowballing is unlikely to land.
Risks & watch-outs
- Watch-outs: built in 1955 — expect roof / HVAC / electrical / plumbing capex.
Questions for the listing agent
- Built in 1955 — when were the roof, HVAC, electrical panel, plumbing, and water heater last replaced?
- Is there a deadline driving the sale (1031 exchange, divorce, estate, relocation)? That informs how much negotiation room exists.
- Crime grade is F in this area — have there been break-ins, vandalism, or insurance claims at this property in the last 3 years? What carrier currently insures it and at what premium?
- The area grade is low — what's the realistic commute time and amenity access for the typical tenant pool here? Any planned neighborhood developments (good or bad) we should know about?
- What's the average days-on-market for RENTAL listings here right now (not sales)? A rising rental-DOM trend means longer vacancies and softer asking-rent achievability than the comps imply.
- What's the recent tenant-quality profile in this submarket — average credit score on applications, eviction rate, late-payment / NSF rate, and stable-employment percentage? A property-management company in the area should have these aggregated.
- How much new for-sale + rental construction is in the pipeline within 1–3 miles? Heavy new supply typically softens prices + rents 12–24 months out; constrained supply supports both.
Investment metrics
- 1% rule
- 0.79% ✗
- Cap rate
- 6.46%
- Cash-on-cash
- 0.58%
- DSCR
- 1.03
- GRM
- 10.5
CMA / ARV
- ARV (on-the-fly)
- $171,189
- Comps found
- 12
Show comp detail 12 sales within ~0.75 mi
| Address | Dist | Beds/Ba | Sqft | Sold | Price | $/sf | Match |
|---|---|---|---|---|---|---|---|
| 3037 South Scott Ave | 0.11mi | 2/1.0 | 804 (-3%) | 2mo | $175,000 | $218 | 89 |
| 3207 S Vermont Ave | 0.27mi | 2/1.0 | 792 (-4%) | 0mo | $111,000 | $140 | 80 |
| 3112 S Claremont Ave | 0.30mi | 2/1.0 | 792 (-4%) | 7mo | $125,000 | $158 | 73 |
| 2925 S Norwood Ave | 0.17mi | 2/1.0 | 926 (+12%) | 4mo | $159,000 | $172 | 69 |
| 3021 S Scott Ave | 0.12mi | 2/1.0 | 720 (-13%) | 9mo | $165,000 | $229 | 65 |
| 3221 S Crysler Ave | 0.45mi | 3/2.0 (+1) | 864 (+4%) | 3mo | $179,000 | $207 | 60 |
| 1524 W Sheley Rd | 0.41mi | 3/1.0 (+1) | 894 (+8%) | 3mo | $157,000 | $176 | 60 |
| 2900 S Appleton Ave | 0.58mi | 2/1.5 | 864 (+4%) | 5mo | $149,800 | $173 | 59 |
| 3339 S Vermont Ave | 0.43mi | 3/2.0 (+1) | 912 (+10%) | 0mo | $195,000 | $214 | 53 |
| 1407 W Sheley Rd | 0.47mi | 2/1.0 | 720 (-13%) | 4mo | $129,950 | $180 | 53 |
| 1220 W 26th St S | 0.64mi | 2/1.0 | 902 (+9%) | 7mo | $194,950 | $216 | 50 |
| 2509 S Sterling Ave | 0.73mi | 2/1.0 | 720 (-13%) | 1mo | $159,900 | $222 | 44 |
Match score weights: distance 35% · size 25% · config 20% · recency 20%. Top-matched comps best support the ARV.
Projected returns pro-forma
-3.0% appreciation · 5.43% rent growth · sell at horizon
- IRR
- -13.0%
- Equity multiple
- 0.52×
- Total profit
- $-18,688
- Equity at exit
- $20,800
- IRR
- -1.0%
- Equity multiple
- 0.92×
- Total profit
- $-3,016
- Equity at exit
- $12,061
Cash invested: $39,060 (down + closing). Projections, not guarantees.
Landlord ↔ Tenant lean methodology
- Overall (STATE)
- 81 Strongly Landlord-Friendly
- State Missouri
- 81 Strongly Landlord-Friendly · R+10
- County
- — inherits STATE
- City
- — inherits STATE
ZIP-level market 64052
- Home prices YoY
- -34.6%
- Rents YoY
- 5.4%
- Active inventory
- 135
- Price-to-rent
- 10.5×
Monthly cashflow live
- Estimated rent
- $1,103 high interval (Pro) →
- Mortgage (P&I)
- −$732
- Tax from tax record
- −$63 /mo · $753/yr
- Insurance
- −$58
- HOA
- −$0
- Vacancy / Maint / Mgmt
- −$232
- Net cashflow
- $19
Break-even live
Sensitivity live
| Price | -10% $98 | -5% $58 | +0% $19 | +5% $-21 | +10% $-60 |
|---|---|---|---|---|---|
| Rent | -10% $-68 | -5% $-25 | +0% $19 | +5% $63 | +10% $106 |
| Rate | -1.0pp $89 | -0.5pp $54 | base $19 | +0.5pp $-17 | +1.0pp $-54 |
UW: 25.0% down · 7.5% · 30yr · 1.5% tax · 5.0% vac · 8.0% maint · 8.0% mgmt
Financing live
Cash to close
- Down payment
- $34,875
- Closing costs
- $4,185
- Reserves months
- —
- Total cash needed
- —
Loan-product check · same deal, 3 products live
Conventional
25% down · 7.5% · 30yr
- Down + closing
- —
- Monthly P&I
- —
- Monthly cashflow
- —
- DSCR
- —
- Eligible?
- —
Personal DTI + credit; lowest rate.
DSCR
20% down · 8.5% · 30yr
- Down + closing
- —
- Monthly P&I
- —
- Monthly cashflow
- —
- DSCR
- —
- Eligible?
- —
No personal income docs; deal must DSCR.
Hard money
10% down · 12.0% · 12mo
- Down + closing
- —
- Monthly P&I
- —
- Monthly cashflow
- —
- DSCR
- —
- Eligible?
- —
Short-term bridge; refi at stabilization.
Rent comps 19 comps
| Address | Beds | Baths | Sqft | Rent | $/sqft | DOM | Units | Dist |
|---|---|---|---|---|---|---|---|---|
| 3115 S Forest Ave Apt 1 Independence, MO | 1.0 | 1.0 | 700 | $999 | $1.43 | 45d | 1 | 0.16mi |
| 3115 S Forest Ave Apt 3 Independence, MO | 1.0 | 1.0 | 700 | $999 | $1.43 | 25d | 1 | 0.16mi |
| 2912 Englewood Ter Independence, MO | 3.0 | 2.0 | 792 | $1,399 | $1.77 | 17d | 1 | 0.42mi |
| 3213 S Ash Ave Independence, MO | 2.0 | 1.0 | 879 | $1,195 | $1.36 | 9d | 1 | 0.98mi |
| 10604 E 26th St S Independence, MO | 3.0 | 1.0 | 1068 | $1,610 | $1.51 | 9d | 1 | 0.99mi |
| 12400 E 40th St S Independence, MO | 1.0 | 1.0 | 750 | $850 | $1.13 | 5d | 1 | 1.18mi |
| 12502 E 40th St S Unit C Independence, MO | 2.0 | 1.5 | 950 | $975 | $1.03 | 5d | 1 | 1.20mi |
| 3927 Willow Ave Kansas City, MO | 1.0–3.0 | 1.0–2.0 | 997 | $1,152 | $1.15 | 3d | 11 | 1.32mi |
| 3551 S Lynn St Unit 3551 Independence, MO | 2.0 | 1.0 | 850 | $899 | $1.06 | 45d | 1 | 1.35mi |
| 724 S Grand Ave Independence, MO | 2.0 | 2.0 | 1000 | $1,149 | $1.15 | 45d | 1 | 1.39mi |
| 1810 S Vermont Ave Independence, MO | 2.0 | 1.0 | 950 | $948 | $1.00 | 45d | 1 | 1.41mi |
| 9715 E 35th Ter S Unit A-5 Independence, MO | 2.0 | 1.0 | 750 | $1,095 | $1.46 | 16d | 1 | 1.45mi |
| 9715 E 35th Ter S Unit B-10 Independence, MO | 2.0 | 1.0 | 750 | $1,095 | $1.46 | 45d | 1 | 1.46mi |
| 9715 E 35th Ter S Unit B-3 Independence, MO | 1.0 | 1.0 | 750 | $950 | $1.27 | 22d | 1 | 1.46mi |
| 9715 E 35th Ter S Unit B-9 Independence, MO | 2.0 | 1.0 | 750 | $999 | $1.33 | 22d | 1 | 1.46mi |
| 9715 E 35th Ter S Apt A8 Independence, MO | 2.0 | 1.0 | 750 | $999 | $1.33 | 5d | 1 | 1.47mi |
| 321 W South Ave Unit 8 Independence, MO | 2.0 | 1.5 | 980 | $1,895 | $1.93 | 3d | 1 | 1.49mi |
| 321 W South Ave Unit 9 Independence, MO | 2.0 | 1.5 | 980 | $1,295 | $1.32 | 45d | 1 | 1.49mi |
| 321 W South Ave Unit 11 Independence, MO | 3.0 | 2.0 | 1000 | $1,275 | $1.27 | 22d | 1 | 1.49mi |
Listing history 6 events
-
2026-06-18status $139,500 Pending 7 DOM
-
2026-06-17days on market $139,500 Active Under Contract 7 DOM
-
2026-06-16days on market $139,500 Active Under Contract 6 DOM
-
2026-06-15days on market $139,500 Active Under Contract 5 DOM
-
2026-06-13remarks 699-char remark
-
2026-06-13$139,500 Active Under Contract 3 DOM
ⓘ Source: listings_history table (triggers on properties + properties_extension) + one-shot
backfill from property_details.listing_events for pre-trigger history.
Tax reassessment forecast MO · Resets to sale price
- Current annual tax
- $753 · $63/mo
- Projected year-2 tax
- $1,353 · $113/mo
- Expected delta
- +$600/yr (+$50/mo · 79.6%)
ⓘ Screening estimate from a state-policy table — verify with the county assessor before closing.
Climate risk First Street
- Flood 1/10 Low FEMA zone X (unshaded) · 0% chance over 30 yrs
- Wildfire 1/10 Low
- Heat 4/10 Moderate 7 d/yr ≥106°F today · 17 d/yr by 30 yrs out
- Wind 2/10 Low
- Air quality 3/10 Moderate 3 unhealthy d/yr today · 3 by 30 yrs out
Nearby sold comps map
Loading sold comps map…
Walkable amenities ~0.75 mi
Loading nearby amenities…
Taxation est. · year 1
- Rental income
- $13,237
- − Mortgage interest
- −$7,814
- − Property taxes
- −$753
- − Insurance
- −$698
- − Repairs & maintenance
- −$1,059
- − Management
- −$1,059
- − Depreciation
- −$4,058
- Taxable loss
- −$2,204
- Est. tax savings @ 24.0%
- +$529
- After-tax cash flow
- $756/yr
For passive investors: Depreciation is non-cash, so a rental often shows a tax loss while cash-flowing — sheltering income. Rental losses are passive: they offset passive income freely, and up to $25,000/yr can offset ordinary (W-2) income if you actively participate and your MAGI is under $100k (phasing out to $0 by $150k); unused losses carry forward. On sale, claimed depreciation is recaptured at up to 25%, and gains may owe capital-gains tax (a 1031 exchange can defer both). Figures are a year-1 estimate at your 24.0% rate — not tax advice; consult a CPA.
Schools (NCES district)
- District
- Independence 30
- NCES district ID
- 2915480
- Math proficiency
- 26% ▼ -8.00%
- Reading proficiency
- 38% ▼ -5.00%
- Median HH income
- $41,843
- Composite
- 27.04/100
- National rank
- #7054
- State rank
- #252 of 324 in MO
Livability — Independence
- Score
- 82/100
- State rank
- #10
- US rank
- #1296
Category grades
Schools grade is shown separately in the Schools card above.
Census & demographics
- Census place
- Independence, MO
- County
- Jackson County · 687,798 people
- City population
- 117,675
- Metro
- Kansas City, MO-KS
- Population (ZIP)
- 22,138
- Household income
- $59,007
- Rent vs Own
- Severe rent burden
- 965.0
Population outlook (Jackson County) Hauer SSP2
- Today (2025)
- 719,589 people
- By 2030
- 731,456 · +1.6%
- By 2040
- 746,689 · +3.8%
- By 2050
- 749,289 · +4.1%
- By 2075
- 736,227 · +2.3%
- By 2100
- 668,210 · -7.1%
Race, ethnicity, and origin ACS 2023
- Neighborhood character
- Diverse neighborhood (Simpson 0.56)
- Race & ethnicity
- White 62% Hispanic / Latino 23% Two or more races 15% Black 7% Asian 2%
- Hispanic origin (detail)
- Mexican 15%
- Common ancestry
- Italian 12% Slovak 2% Lithuanian 2%
- Foreign-born
- 11% · Canada, China
- Languages at home
- 85% English-only · Spanish 13% Other Asian/Pacific 1%
Political lean MEDSL · Jackson
- 2024 margin
- D (+19.3) · D 58.9% · R 39.5% · Other 1.6%
- 2008→2024 swing
- -6.1pp toward R · 2008: 25.4pp · 2024: 19.3pp
- All cycles
- 2024: D+19.3 2020: D+22.0 2016: D+16.6 2012: D+19.0 2008: D+25.4
Not yet ingested
- Civics
- —
Market trends
- HPI YoY
- ▼ -160.06%
- Current HPI
- 302.1124
- Rent YoY
- ▲ 5.43%
- Metro
- Kansas City, MO-KS
- State GDP YoY
- ▲ 1.84%
- F500 in state
- 20
Industry mix (Fortune 500 HQ in MO)
| Industry | F500 HQs | Revenue |
|---|---|---|
| Healthcare | 1 | $163B |
|
||
| Insurance | 1 | $21B |
|
||
| Industrial Technology | 1 | $17B |
|
||
| Retail | 1 | $16B |
|
||
| Industrial Distribution | 1 | $10B |
|
||
| Utilities | 1 | $9B |
|
||
Price history
4 events — show timeline
- 2026-06-11 Contingent — Heartland MLS as Distributed by MLS Grid
- 2026-06-10 Listed $139,500 Heartland MLS as Distributed by MLS Grid
- 2002-09-18 Sold (Public Records) — Public Records
- 1996-05-22 Sold (Public Records) — Public Records
Property tax history
+6.5%/yrLatest (2025): $753 · -34.4% YoY. Source: county tax records.
Cash-flow waterfall
monthlySold comps — $/sqft
last 12 mo · ≤1 miLoading sold comps…