107 Karenlee Cir · Hazel Green, AL
Flood risk No data
- FEMA flood zone
- —
- Chance of flooding over 30 yrs
- —
- Est. flood insurance / yr
- —
Fire risk No data
- Est. fire insurance / yr
- —
Heat risk No data
- Hot days now (above threshold)
- —
- Hot days in 30 yrs
- —
Wind risk No data
- Chance of severe wind over 30 yrs
- —
Air-quality risk No data
- Unhealthy air days now
- —
- Unhealthy air days in 30 yrs
- —
Risk factors via First Street. Map © Google.
Why this score? — see what drove the D grade
The composite is a weighted blend of 9 inputs, each scored 0–100. Each bar is that input's sub-score; the figure is the points it added to the 100-point composite (weight × sub-score).
- ARV discount +10.4/15.0
- Appreciation +10.0/10.0
- Cash flow +6.3/30.0
- Schools +3.7/10.0
- Livability +3.5/5.0
- Rent growth +2.5/5.0
- Condition / age +2.5/5.0
- 1% rule +1.6/10.0
- DSCR +0.6/10.0
$256,900
🖨 Deal sheet 📄 Offer letter ✓ Due diligence
Listing remarks MLS
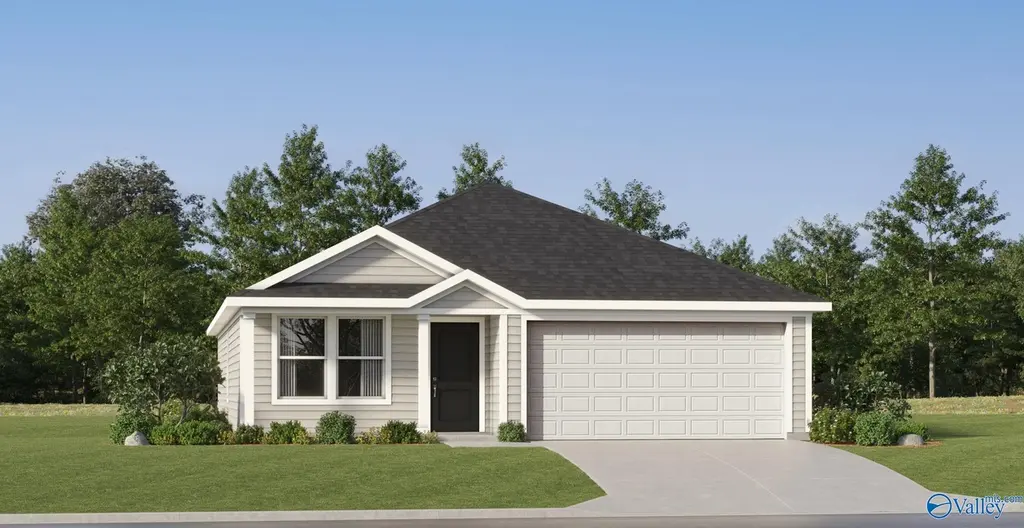
The Newlin is a beautifully designed 3-bedroom, 2-bath home offering 1,474 sq. ft. of stylish, single-level living. Its open layout connects the kitchen, dining, and family room, creating a perfect space for entertaining or relaxing. The private owner’s suite features a walk-in closet and en-suite bath, while two additional bedrooms offer flexibility for guests, work, or hobbies. With a 2-car garage and convenient laundry room, the Newlin blends comfort, functionality, and modern charm—TOUR OUR NEWLIN PLAN TODAY
Key facts
- 0.37 acre lot
- 2 garage spots
- Listed 102 days
Neighborhood map
What this means for you Summary
Snapshot
- This is a 3-bed/2.0-bath single-family listed at $257k.
Deal economics
- At list price, monthly cash flow is $-461 ($-6k/yr) — negative.
- To cash-flow at today's rent, offer at most $190k (26.0% below list).
- To meet the 1% rule (rent ≥ 1% of price), the offer needs to be $168k (34.4% below list).
- Recommended offer: $168k (34.4% below list) — sets the bar for 1% rule.
Location & tenants
- Location reads 69/100 on livability (#54 in AL) — a middle-class / working-renter tenant base. Strengths: cost of living A+, housing A+, crime A; Watch: schools C-, amenities F, commute F.
- Madison County (rural): math 27% / reading 56% proficiency, ranked #19 of 129 in AL (top 15%) — families likely to look elsewhere, expect single-tenant / working-renter base with shorter leases.
- Market conditions: 256 active listings in the ZIP; 15 comparable units currently listed for rent nearby; rentals at typical pace (median 24d on market — plan ~3-4 weeks tenant-placement turnaround); 4,709 units permitted in Madison County in 2024 (1,186 in 5+ unit buildings).
Forward outlook
- In year one you build about $27k of equity ($2k loan paydown + $26k appreciation (10.0% local appreciation)).
- Madison County population projected at +18% by 2050 — long-run rental-demand tailwind backs the buy-and-hold thesis.
- By year 2, paydown + projected appreciation supports a ~$44k cash-out refi (75% LTV) — recoverable capital for the next deal without selling this one.
Negotiation context
- It's been on market 102 days — a 9% lower offer ($234k) is reasonable based on typical stale-listing flexibility.
Questions for the listing agent
- What do current leases actually rent for vs. the listed asking? Can we see a recent rent roll and the last 12 months of T-12 income?
- It's been on market 102 days. Have you received any prior offers? Is the seller open to a 34% concession, seller financing, or rate buy-down credit?
- What does the HOA fee cover, when was the last increase, and are there any pending special assessments or reserve-fund shortfalls?
- Why hasn't it sold? Are there any deal-killer items the seller is aware of (foundation, flood, title, zoning, code violations)?
- Is there a deadline driving the sale (1031 exchange, divorce, estate, relocation)? That informs how much negotiation room exists.
- The area grade is low — what's the realistic commute time and amenity access for the typical tenant pool here? Any planned neighborhood developments (good or bad) we should know about?
- What's the average days-on-market for RENTAL listings here right now (not sales)? A rising rental-DOM trend means longer vacancies and softer asking-rent achievability than the comps imply.
- What's the recent tenant-quality profile in this submarket — average credit score on applications, eviction rate, late-payment / NSF rate, and stable-employment percentage? A property-management company in the area should have these aggregated.
- How much new for-sale + rental construction is in the pipeline within 1–3 miles? Heavy new supply typically softens prices + rents 12–24 months out; constrained supply supports both.
Investment metrics
- 1% rule
- 0.66% ✗
- Cap rate
- 4.14%
- Cash-on-cash
- -7.69%
- DSCR
- 0.66
- GRM
- 12.7
CMA / ARV
- ARV (median comp)
- $274,900
- List price
- $256,900
- Delta
- -6.55%
- Verdict
- FAIR
- Comps
- 20 within 1.0 mi
Show comp detail 12 sales within ~0.75 mi
| Address | Dist | Beds/Ba | Sqft | Sold | Price | $/sf | Match |
|---|---|---|---|---|---|---|---|
| 104 Karenlee Cir | 0.05mi | 3/2.0 | 1,474 (0%) | 2mo | $251,900 | $171 | 96 |
| 169 Keller Dr | 0.17mi | 3/2.0 | 1,537 (+4%) | 1mo | $261,900 | $170 | 84 |
| 233 Tobin Ln | 0.27mi | 3/2.0 | 1,537 (+4%) | 0mo | $240,000 | $156 | 80 |
| 298 Keller Dr | 0.41mi | 3/2.0 | 1,484 (+1%) | 2mo | $269,644 | $182 | 78 |
| 189 Tobin Ln | 0.09mi | 3/2.0 | 1,685 (+14%) | 1mo | $250,000 | $148 | 71 |
| 163 Whitner Dr | 0.05mi | 4/2.0 (+1) | 1,667 (+13%) | 1mo | $249,280 | $150 | 70 |
| 171 Keller Dr | 0.18mi | 3/2.0 | 1,683 (+14%) | 3mo | $279,000 | $166 | 66 |
| 172 Keller Dr | 0.20mi | 3/2.0 | 1,683 (+14%) | 3mo | $269,900 | $160 | 65 |
| 309 Keller Dr | 0.47mi | 3/2.0 | 1,620 (+10%) | 2mo | $284,900 | $176 | 60 |
| 152 Cherry Laurel Dr | 0.52mi | 3/2.0 | 1,620 (+10%) | 0mo | $259,000 | $160 | 59 |
| 147 Butch Cir | 0.44mi | 3/2.0 | 1,269 (-14%) | 1mo | $254,900 | $201 | 56 |
| 576 Charity Ln | 0.75mi | 3/2.0 | 1,636 (+11%) | 3mo | $260,000 | $159 | 44 |
Match score weights: distance 35% · size 25% · config 20% · recency 20%. Top-matched comps best support the ARV.
Projected returns pro-forma
10.0% appreciation · 3.0% rent growth · sell at horizon
- IRR
- 18.9%
- Equity multiple
- 2.54×
- Total profit
- $110,574
- Equity at exit
- $231,436
- IRR
- 17.5%
- Equity multiple
- 5.85×
- Total profit
- $348,794
- Equity at exit
- $499,100
Cash invested: $71,932 (down + closing). Projections, not guarantees.
Landlord ↔ Tenant lean methodology
- Overall (STATE)
- 90 Strongly Landlord-Friendly
- State Alabama
- 90 Strongly Landlord-Friendly · R+15
- County
- — inherits STATE
- City
- — inherits STATE
ZIP-level market 35750
- Home prices YoY
- 8.2%
- Active inventory
- 256
- Price-to-rent
- 12.7×
Monthly cashflow live
- Estimated rent
- $1,685 high interval (Pro) →
- Mortgage (P&I)
- −$1,347
- Tax est. 1.5%
- −$321 /mo · $3,854/yr
- Insurance
- −$107
- HOA
- −$17
- Vacancy / Maint / Mgmt
- −$354
- Net cashflow
- $-461
Break-even live
UW: 25.0% down · 7.5% · 30yr · 1.5% tax · 5.0% vac · 8.0% maint · 8.0% mgmt
Financing live
Cash to close
- Down payment
- $64,225
- Closing costs
- $7,707
- Reserves months
- —
- Total cash needed
- —
Loan-product check · same deal, 3 products live
Conventional
25% down · 7.5% · 30yr
- Down + closing
- —
- Monthly P&I
- —
- Monthly cashflow
- —
- DSCR
- —
- Eligible?
- —
Personal DTI + credit; lowest rate.
DSCR
20% down · 8.5% · 30yr
- Down + closing
- —
- Monthly P&I
- —
- Monthly cashflow
- —
- DSCR
- —
- Eligible?
- —
No personal income docs; deal must DSCR.
Hard money
10% down · 12.0% · 12mo
- Down + closing
- —
- Monthly P&I
- —
- Monthly cashflow
- —
- DSCR
- —
- Eligible?
- —
Short-term bridge; refi at stabilization.
Rent comps 15 comps
| Address | Beds | Baths | Sqft | Rent | $/sqft | DOM | Units | Dist |
|---|---|---|---|---|---|---|---|---|
| 108 Karenlee Cir Hazel Green, AL | 4.0 | 2.0 | 1666 | $1,685 | $1.01 | 23d | 1 | 0.09mi |
| 143 Havner Dr Hazel Green, AL | 4.0 | 2.0 | 1667 | $1,775 | $1.06 | 14d | 1 | 0.10mi |
| 189 Tobin Ln Hazel Green, AL | 3.0 | 2.0 | 1685 | $1,775 | $1.05 | 14d | 1 | 0.13mi |
| 169 Keller Dr Hazel Green, AL | 3.0 | 2.0 | 1537 | $1,665 | $1.08 | 14d | 1 | 0.16mi |
| 171 Keller Dr Hazel Green, AL | 3.0 | 2.0 | 1683 | $1,616 | $0.96 | 44d | 1 | 0.17mi |
| 117 Hank Ct Hazel Green, AL | 3.0 | 2.0 | 1517 | $1,650 | $1.09 | 44d | 1 | 0.26mi |
| 137 Hazel Pine Trl Hazel Green, AL | 3.0 | 2.0 | 1482 | $1,650 | $1.11 | 23d | 1 | 0.50mi |
| 100 Brook Glen Dr Hazel Green, AL | 3.0 | 2.0 | 1336 | $1,595 | $1.19 | 14d | 1 | 0.98mi |
| 109 Bullard Rd Apt A6 Hazel Green, AL | 2.0 | 2.0 | 1008 | $1,200 | $1.19 | 44d | 1 | 1.07mi |
| 109 Bullard Rd Unit C-5 Hazel Green, AL | 2.0 | 2.0 | 1008 | $1,100 | $1.09 | 44d | 1 | 1.07mi |
| 149 Hazel Trce Hazel Green, AL | 3.0 | 2.0 | 1628 | $1,695 | $1.04 | 14d | 1 | 1.20mi |
| 202 Hailey May Ct Hazel Green, AL | 4.0 | 2.5 | 1727 | $1,645 | $0.95 | 23d | 1 | 1.22mi |
| 203 Hailey May Ct Hazel Green, AL | 4.0 | 2.0 | 1797 | $1,695 | $0.94 | 23d | 1 | 1.23mi |
| 127 London Calvin Way Hazel Green, AL | 4.0 | 2.5 | 1727 | $1,645 | $0.95 | 14d | 1 | 1.24mi |
| 106 London Calvin Way Hazel Green, AL | 4.0 | 2.0 | 1797 | $1,684 | $0.94 | 44d | 1 | 1.27mi |
HOA detail
- Monthly dues
- $17 · $204/yr
Listing history 9 events
-
2026-06-10status $256,900 Pending 102 DOM
-
2026-06-09days on market $256,900 Active 102 DOM
-
2026-06-08days on market $256,900 Active 101 DOM
-
2026-06-07days on market $256,900 Active 100 DOM
-
2026-06-02days on market $256,900 Active 95 DOM
-
2026-06-01days on market $256,900 Active 94 DOM
-
2026-05-31days on market $256,900 Active 93 DOM
-
2026-05-30days on market $256,900 Active 92 DOM
-
2026-02-27$256,900 Active 529-char remark
Show marketing remark (529 chars)
The Newlin is a beautifully designed 3-bedroom, 2-bath home offering 1,474 sq. ft. of stylish, single-level living. Its open layout connects the kitchen, dining, and family room, creating a perfect space for entertaining or relaxing. The private owner’s suite features a walk-in closet and en-suite bath, while two additional bedrooms offer flexibility for guests, work, or hobbies. With a 2-car garage and convenient laundry room, the Newlin blends comfort, functionality, and modern charm—TOUR OUR NEWLIN PLAN TODAY
ⓘ Source: listings_history table (triggers on properties + properties_extension) + one-shot
backfill from property_details.listing_events for pre-trigger history.
Nearby sold comps map
Loading sold comps map…
Walkable amenities ~0.75 mi
Loading nearby amenities…
Taxation est. · year 1
- Rental income
- $20,220
- − Mortgage interest
- −$14,390
- − Property taxes
- −$3,854
- − Insurance
- −$1,284
- − Repairs & maintenance
- −$1,618
- − Management
- −$1,618
- − HOA
- −$204
- − Depreciation
- −$7,473
- Taxable loss
- −$10,221
- Est. tax savings @ 24.0%
- +$2,453
- After-tax cash flow
- $-3,082/yr
For passive investors: Depreciation is non-cash, so a rental often shows a tax loss while cash-flowing — sheltering income. Rental losses are passive: they offset passive income freely, and up to $25,000/yr can offset ordinary (W-2) income if you actively participate and your MAGI is under $100k (phasing out to $0 by $150k); unused losses carry forward. On sale, claimed depreciation is recaptured at up to 25%, and gains may owe capital-gains tax (a 1031 exchange can defer both). Figures are a year-1 estimate at your 24.0% rate — not tax advice; consult a CPA.
Schools (NCES district)
- District
- Madison County
- NCES district ID
- 0102220
- Math proficiency
- 27% ▼ -32.00%
- Reading proficiency
- 56% ▼ -1.00%
- Median HH income
- $66,058
- Composite
- 37.15/100
- National rank
- #4483
- State rank
- #19 of 129 in AL
Livability — Hazel Green
- Score
- 69/100
- State rank
- #54
- US rank
- #8575
Category grades
Schools grade is shown separately in the Schools card above.
Census & demographics
- Census place
- Hazel Green, AL
- County
- Madison County · 380,832 people
- City population
- 13,413
- Metro
- Huntsville, AL
- Population (ZIP)
- 13,413
- Household income
- $68,389
- Rent vs Own
- Severe rent burden
- 162.0
Population outlook (Madison County) Hauer SSP2
- Today (2025)
- 392,086 people
- By 2030
- 409,788 · +4.5%
- By 2040
- 440,557 · +12.4%
- By 2050
- 460,990 · +17.6%
- By 2075
- 502,872 · +28.3%
- By 2100
- 513,623 · +31.0%
Race, ethnicity, and origin ACS 2023
- Neighborhood character
- Predominantly White (71%)
- Race & ethnicity
- White 71% Black 19% Asian 5% Two or more races 3% Hispanic / Latino 2%
- Common ancestry
- Slovak 1% Serbian 1% Romanian 1%
- Foreign-born
- 3% · Canada
- Languages at home
- 95% English-only · Spanish 2% Chinese 1% Korean 1%
Political lean MEDSL · Madison
- 2024 margin
- Lean R (+9.0) · D 44.7% · R 53.7% · Other 1.6%
- 2008→2024 swing
- +6.0pp toward D · 2008: -14.9pp · 2024: -9.0pp
- All cycles
- 2024: R+9.0 2020: R+8.0 2016: R+16.8 2012: R+18.7 2008: R+14.9
Not yet ingested
- Civics
- —
Market trends
- HPI YoY
- ▲ 33.59%
- Current HPI
- 444.7418
- Rent YoY
- —
- Metro
- Huntsville, AL
- State GDP YoY
- ▲ 2.94%
- F500 in state
- 4
Industry mix (Fortune 500 HQ in AL)
| Industry | F500 HQs | Revenue |
|---|---|---|
| Financial Services | 1 | $8B |
|
||
| Healthcare | 1 | $5B |
|
||
Price history
1 event — show timeline
- 2026-02-27 Listed $256,900 VMLS
Cash-flow waterfall
monthlySold comps — $/sqft
last 12 mo · ≤1 miLoading sold comps…