1540 Maple Ln #29 · Kent, WA
Flood risk 5/10 · Moderate
- FEMA flood zone
- X
- Chance of flooding over 30 yrs
- 0.24%
- Est. flood insurance / yr
- $507 – $1,088
Fire risk 1/10 · Minimal
- Est. fire insurance / yr
- $604 – $1,122
Heat risk 3/10 · Minor
- Hot days now (above 87°F)
- 7 days/yr
- Hot days in 30 yrs
- 15 days/yr
Wind risk 1/10 · Minimal
- Chance of severe wind over 30 yrs
- —
Air-quality risk 8/10 · Major
- Unhealthy air days now
- 12 days/yr
- Unhealthy air days in 30 yrs
- 12 days/yr
Risk factors via First Street. Map © Google.
Why this score? — see what drove the B+ grade
The composite is a weighted blend of 9 inputs, each scored 0–100. Each bar is that input's sub-score; the figure is the points it added to the 100-point composite (weight × sub-score).
- Cash flow +30.0/30.0
- ARV discount +15.0/15.0
- 1% rule +10.0/10.0
- DSCR +10.0/10.0
- Schools +4.8/10.0
- Livability +4.0/5.0
- Rent growth +3.4/5.0
- Condition / age +2.2/5.0
- Appreciation +0.0/10.0
$64,999
🖨 Deal sheet 📄 Offer letter ✓ Due diligence
Listing remarks
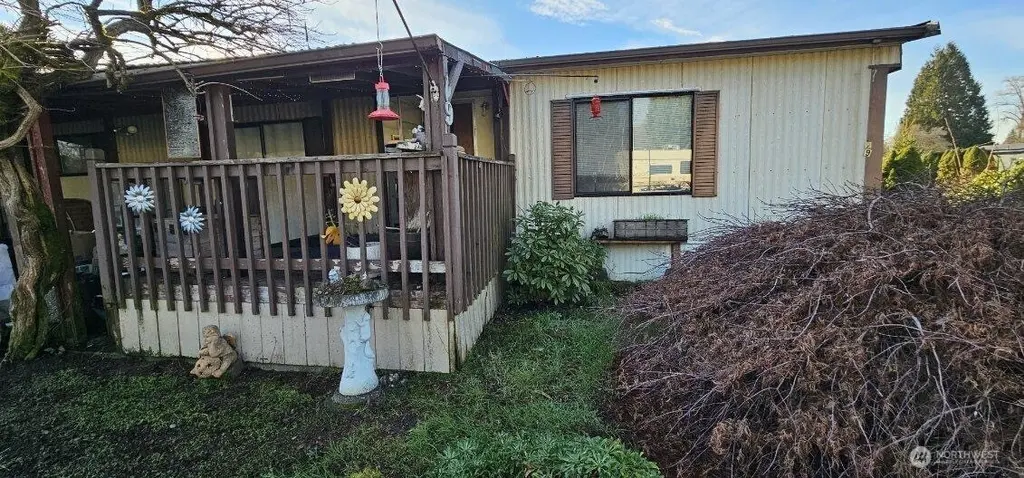
Immerse yourself in the peaceful atmosphere of Horseshoe Acres, a charming 55+ community nestled beside the tranquil river. This 2 bed/2 bath mobile home has so much potential! Enjoy the surrounding nature with beautiful flowers, river access, and trees all around the community. Close to downtown Kent, public transportation, and several shops and restaurants.
Key facts
- Quartz countertops
- Secure storage shed
- Recently remodeled
Tags
Neighborhood map
What this means for you Summary
Snapshot
- This is a 2-bed/2.0-bath manufactured listed at $65k. Condition is rated fair.
Deal economics
- At list price, monthly cash flow is $1k ($14k/yr) — positive.
- The deal already cash-flows at list — no discount required.
- Meets the 1% rule at list price ($2k rent vs $65k).
- Recommended offer: $57k (12.0% below list) — sets the bar for market timing.
- Cap rate 27.4% vs local median 2.7% in Kent — top-decile yield for the area; either an underpriced asset or a hidden risk that comps aren't pricing in. Stress-test before assuming the spread holds.
Location & tenants
- Location reads 79/100 on livability (#109 in WA, #2,154 nationally) — a middle-class / working-renter tenant base. Strengths: amenities A+, commute A+, housing A+; Watch: schools C-, crime F, cost of living F.
- Kent School District (urban): math 47% / reading 57% proficiency, ranked #109 of 291 in WA (top 38%) — acceptable for families but not a draw, mixed tenant base, ~2y average lease.
- Market conditions: Rents rising (+3.7%/yr); 171 active listings in the ZIP; 36 comparable units currently listed for rent nearby; rentals leasing fast (median 13d on market — plan ~1-2 weeks tenant-placement turnaround); solid renter incomes; 10,555 units permitted in King County in 2024 (7,119 in 5+ unit buildings).
Forward outlook
- Local home prices are declining (-3.0%/yr); year-one equity from $449 of loan paydown is wiped out by about $2k of value loss. Plan a longer hold.
- King County population projected at +44% by 2050 — long-run rental-demand tailwind backs the buy-and-hold thesis.
- At projected returns (-3.0% appreciation + 3.7% rent growth), your $18k cash investment doubles in ~2 years — after that, you're playing with house money.
Negotiation context
- It's been on market 138 days — a 12% lower offer ($57k) is reasonable based on typical stale-listing flexibility.
Risks & watch-outs
- Climate carrying-cost: moderate flood risk — expect insurance premiums to compound above CPI over the hold.
Questions for the listing agent
- It's been on market 138 days. Have you received any prior offers? Is the seller open to a 12% concession, seller financing, or rate buy-down credit?
- Have any recent inspections been done? Can we get a copy of the seller's disclosures and any deferred-maintenance estimates?
- Built in 1973 — when were the roof, HVAC, electrical panel, plumbing, and water heater last replaced?
- Why hasn't it sold? Are there any deal-killer items the seller is aware of (foundation, flood, title, zoning, code violations)?
- Is there a deadline driving the sale (1031 exchange, divorce, estate, relocation)? That informs how much negotiation room exists.
- Crime grade is F in this area — have there been break-ins, vandalism, or insurance claims at this property in the last 3 years? What carrier currently insures it and at what premium?
- What's the average days-on-market for RENTAL listings here right now (not sales)? A rising rental-DOM trend means longer vacancies and softer asking-rent achievability than the comps imply.
- What's the recent tenant-quality profile in this submarket — average credit score on applications, eviction rate, late-payment / NSF rate, and stable-employment percentage? A property-management company in the area should have these aggregated.
- How much new for-sale + rental construction is in the pipeline within 1–3 miles? Heavy new supply typically softens prices + rents 12–24 months out; constrained supply supports both.
Investment metrics
- 1% rule
- 3.11% ✓
- Cap rate
- 27.44%
- Cash-on-cash
- 75.53%
- DSCR
- 4.36
- GRM
- 2.7
CMA / ARV
- ARV (median comp)
- $103,149
- List price
- $64,999
- Delta
- -36.99%
- Verdict
- UNDERPRICED
- Comps
- 3 within 1.0 mi
Show comp detail 2 sales within ~0.75 mi
| Address | Dist | Beds/Ba | Sqft | Sold | Price | $/sf | Match |
|---|---|---|---|---|---|---|---|
| 1510 Maple Ln #16 | 0.08mi | 2/2.0 | 1,150 (-8%) | 10mo | $103,000 | $90 | 75 |
| 1540 Maple Ln #35 | 0.02mi | 3/2.0 (+1) | 1,400 (+12%) | 7mo | $165,000 | $118 | 68 |
Match score weights: distance 35% · size 25% · config 20% · recency 20%. Top-matched comps best support the ARV.
Projected returns pro-forma
-3.0% appreciation · 3.72% rent growth · sell at horizon
- IRR
- 76.3%
- Equity multiple
- 4.51×
- Total profit
- $63,928
- Equity at exit
- $9,692
- IRR
- 80.1%
- Equity multiple
- 9.56×
- Total profit
- $155,868
- Equity at exit
- $5,620
Cash invested: $18,200 (down + closing). Projections, not guarantees.
Landlord ↔ Tenant lean methodology
- Overall (STATE)
- 28 Tenant-Leaning
- State Washington
- 28 Tenant-Leaning · D+8
- County
- — inherits STATE
- City
- — inherits STATE
ZIP-level market 98030
- Rents YoY
- 3.7%
- Active inventory
- 171
- Price-to-rent
- 2.7×
Monthly cashflow live
- Estimated rent
- $2,019 high interval (Pro) →
- Mortgage (P&I)
- −$341
- Tax est. 1.5%
- −$81 /mo · $975/yr
- Insurance
- −$27
- HOA
- −$0
- Vacancy / Maint / Mgmt
- −$424
- Net cashflow
- $1,146
Break-even live
UW: 25.0% down · 7.5% · 30yr · 1.5% tax · 5.0% vac · 8.0% maint · 8.0% mgmt
Financing live
Cash to close
- Down payment
- $16,250
- Closing costs
- $1,950
- Reserves months
- —
- Total cash needed
- —
Loan-product check · same deal, 3 products live
Conventional
25% down · 7.5% · 30yr
- Down + closing
- —
- Monthly P&I
- —
- Monthly cashflow
- —
- DSCR
- —
- Eligible?
- —
Personal DTI + credit; lowest rate.
DSCR
20% down · 8.5% · 30yr
- Down + closing
- —
- Monthly P&I
- —
- Monthly cashflow
- —
- DSCR
- —
- Eligible?
- —
No personal income docs; deal must DSCR.
Hard money
10% down · 12.0% · 12mo
- Down + closing
- —
- Monthly P&I
- —
- Monthly cashflow
- —
- DSCR
- —
- Eligible?
- —
Short-term bridge; refi at stabilization.
Rent comps 36 comps
| Address | Beds | Baths | Sqft | Rent | $/sqft | DOM | Units | Dist |
|---|---|---|---|---|---|---|---|---|
| 1605 Maple Ln Apt 2 Kent, WA | 2.0 | 1.0 | 930 | $1,850 | $1.99 | 5d | 1 | 0.15mi |
| 724 2nd Ave S Kent, WA | 2.0 | 1.0 | 875 | $1,699 | $1.94 | 43d | 1 | 0.79mi |
| 713 3rd Ave S Kent, WA | 3.0 | 2.5 | 1350 | $2,795 | $2.07 | 43d | 1 | 0.86mi |
| 25426 97th Pl S Unit 2 Kent, WA | 2.0 | 1.0 | 800 | $2,095 | $2.62 | 43d | 1 | 0.91mi |
| 25426 97th Pl S Unit 2 Kent, WA | 2.0 | 1.0 | 820 | $1,995 | $2.43 | 24d | 1 | 0.91mi |
| 25426 98th Ave S Kent, WA | 3.0 | 1.0 | 690 | $2,195 | $3.18 | 5d | 18 | 0.92mi |
| 10031 SE 258th Pl Kent, WA | 3.0 | 2.0–2.5 | 1454 | $2,968 | $2.04 | 3d | 3 | 0.92mi |
| 702 5th Ave S Kent, WA | 2.0–3.0 | 1.5 | 1150 | $2,200 | $1.91 | 5d | 3 | 0.93mi |
| 707 6th Ave S Unit F103 Kent, WA | 2.0 | 1.5 | 979 | $1,700 | $1.74 | 43d | 1 | 0.97mi |
| 622 6th Ave S Kent, WA | 3.0 | 2.0 | 1114 | $2,999 | $2.69 | 43d | 1 | 1.03mi |
| 9626 S 252nd St Kent, WA | 2.0 | 1.0 | 880 | $1,675 | $1.90 | 2d | 4 | 1.04mi |
| 4750 Auburn Way N Auburn, WA | 1.0–4.0 | 1.0–2.0 | 1011 | $2,102 | $2.08 | 1d | 10 | 1.05mi |
| 401 3rd Ave S Unit Up L Kent, WA | 2.0 | 1.0 | 700 | $1,700 | $2.43 | 43d | 1 | 1.07mi |
| 25035 98th Pl S Kent, WA | 2.0 | 1.0 | 900 | $2,200 | $2.44 | 43d | 1 | 1.11mi |
| 9045 Canyon Dr Apt 1 Kent, WA | 2.0 | 1.0 | 750 | $1,295 | $1.73 | 18d | 1 | 1.11mi |
| 1254 Weiland St Kent, WA | 2.0 | 1.0 | 974 | $1,550 | $1.59 | 43d | 1 | 1.14mi |
| 106 Kensington Ave S #102 Kent, WA | 3.0 | 1.0 | 881 | $1,650 | $1.87 | 24d | 1 | 1.15mi |
| 106 Kensington Ave S Unit 104 Kent, WA | 3.0 | 1.0 | 881 | $1,695 | $1.92 | 43d | 1 | 1.16mi |
| 220 W Meeker St Apt 9 Kent, WA | 1.0 | 1.0 | 700 | $1,280 | $1.83 | 5d | 1 | 1.22mi |
| 220 W Meeker St Apt 7 Kent, WA | 1.0 | 1.0 | 700 | $1,395 | $1.99 | 43d | 1 | 1.22mi |
| 9803 S 248th St Kent, WA | 1.0–2.0 | 1.0 | 754 | $1,790 | $2.37 | 12d | 1 | 1.22mi |
| 802 45th St NE Auburn, WA | 1.0–3.0 | 1.0–2.0 | 895 | $1,749 | $1.95 | 1d | 11 | 1.23mi |
| 24802 99th Pl S Kent, WA | 1.0–2.0 | 1.0–2.0 | 817 | $2,419 | $2.96 | 2d | 9 | 1.24mi |
| 10433 SE Kent Kangley Rd Kent, WA | 1.0–2.0 | 1.0–2.0 | 776 | $1,845 | $2.38 | 5d | 7 | 1.28mi |
| 24808 100th Pl SE Kent, WA | 1.0–2.0 | 1.0–2.0 | 812 | $2,461 | $3.03 | 2d | 12 | 1.30mi |
| 24928 103rd Ave SE Apt D302 Kent, WA | 2.0 | 2.0 | 886 | $2,095 | $2.36 | 22d | 1 | 1.33mi |
| 420 W Smith St Kent, WA | 2.0 | 1.0–2.0 | 704 | $2,321 | $3.30 | 2d | 8 | 1.33mi |
| 625 W Meeker St Kent, WA | 1.0–2.0 | 1.0 | 633 | $1,787 | $2.82 | 2d | 15 | 1.35mi |
| 10215 SE 248th St Kent, WA | 2.0–3.0 | 2.0 | 1240 | $2,645 | $2.13 | 43d | 3 | 1.38mi |
| 10215 SE 248th St Kent, WA | 3.0 | 2.0 | 1250 | $2,895 | $2.32 | 20d | 1 | 1.38mi |
| 10710 SE 256th St Kent, WA | 2.0 | 2.0 | 1029 | $2,200 | $2.14 | 2d | 5 | 1.39mi |
| 102 Madison Ave N Kent, WA | 1.0 | 1.0 | 568 | $1,880 | $3.31 | 2d | 17 | 1.42mi |
| 443 Ramsay Way Kent, WA | 1.0–2.0 | 1.0–2.0 | 728 | $2,249 | $3.09 | 2d | 13 | 1.45mi |
| 525 Central Ave N Kent, WA | 2.0 | 1.0 | 780 | $2,500 | $3.21 | 43d | 1 | 1.45mi |
| 10841 SE Kent Kangley Rd Kent, WA | 2.0 | 1.0 | 900 | $1,812 | $2.01 | 5d | 3 | 1.45mi |
| 10925 SE 259th St Kent, WA | 2.0 | 1.0 | 855 | $1,783 | $2.09 | 1d | 10 | 1.46mi |
Listing history 14 events
-
2026-06-15days on market $64,999 Active 138 DOM
-
2026-06-13days on market $64,999 Active 136 DOM
-
2026-06-09days on market $64,999 Active 132 DOM
-
2026-06-08days on market $64,999 Active 131 DOM
-
2026-06-07days on market $64,999 Active 130 DOM
-
2026-06-04days on market $64,999 Active 127 DOM
-
2026-06-03days on market $64,999 Active 126 DOM
-
2026-06-02days on market $64,999 Active 125 DOM
-
2026-06-01days on market $64,999 Active 124 DOM
-
2026-05-31days on market $64,999 Active 123 DOM
-
2026-04-14price $64,999
-
2026-03-24price $74,999
-
2026-02-26price $79,999
-
2026-01-28$84,999 Active
ⓘ Source: listings_history table (triggers on properties + properties_extension) + one-shot
backfill from property_details.listing_events for pre-trigger history.
Climate risk First Street
- Flood 5/10 Major FEMA zone X · 24% chance over 30 yrs
- Wildfire 1/10 Low
- Heat 3/10 Moderate 7 d/yr ≥87°F today · 15 d/yr by 30 yrs out
- Wind 1/10 Low
- Air quality 8/10 Severe 12 unhealthy d/yr today · 12 by 30 yrs out
Nearby sold comps map
Loading sold comps map…
Walkable amenities ~0.75 mi
Loading nearby amenities…
Taxation est. · year 1
- Rental income
- $24,223
- − Mortgage interest
- −$3,641
- − Property taxes
- −$975
- − Insurance
- −$325
- − Repairs & maintenance
- −$1,938
- − Management
- −$1,938
- − Depreciation
- −$1,891
- Taxable income
- $13,516
- Est. tax owed @ 24.0%
- −$3,244
- After-tax cash flow
- $10,502/yr
For passive investors: Depreciation is non-cash, so a rental often shows a tax loss while cash-flowing — sheltering income. Rental losses are passive: they offset passive income freely, and up to $25,000/yr can offset ordinary (W-2) income if you actively participate and your MAGI is under $100k (phasing out to $0 by $150k); unused losses carry forward. On sale, claimed depreciation is recaptured at up to 25%, and gains may owe capital-gains tax (a 1031 exchange can defer both). Figures are a year-1 estimate at your 24.0% rate — not tax advice; consult a CPA.
Condition & rehab AI · 12 photos
This mobile home requires moderate renovations, focusing on exterior siding, landscaping, and interior updates to improve its resale and rental value.
Repairs flagged
- Major exterior siding — Significant wear and tear
- Major landscaping — Overgrown vegetation
Value-add opportunities
- Both paint interior walls — Enhances curb appeal and interior aesthetics
- Both replace carpet — Improves comfort and reduces maintenance
- Both landscaping — Enhances curb appeal and creates a more inviting exterior
Renovation cost estimate screening
| Repair item | Severity | Est. cost |
|---|---|---|
| exterior siding · Significant wear and tear | Major | $15,000–50,000 |
| landscaping · Overgrown vegetation | Major | $15,000–50,000 |
| Total estimated repair cost · 2 items | $30,000–100,000 |
Value-add ROI direction
- Both paint interior walls — Enhances curb appeal and interior aesthetics ↑
- Both replace carpet — Improves comfort and reduces maintenance ↑
- Both landscaping — Enhances curb appeal and creates a more inviting exterior ↑
ⓘ Cost ranges are severity-bucket heuristics (US national rule-of-thumb). Get contractor quotes + a written scope before underwriting a rehab budget.
Schools (NCES district)
- District
- Kent School District
- NCES district ID
- 5303960
- Math proficiency
- 47% ▼ -1.00%
- Reading proficiency
- 57% ▼ -1.00%
- Median HH income
- $69,823
- Composite
- 48.25/100
- National rank
- #4714
- State rank
- #109 of 291 in WA
Livability — Kent
- Score
- 79/100
- State rank
- #109
- US rank
- #2154
Category grades
Schools grade is shown separately in the Schools card above.
Census & demographics
- Census place
- Kent, WA
- County
- King County · 2,251,916 people
- City population
- 119,479
- Metro
- Seattle-Tacoma-Bellevue, WA
- Population (ZIP)
- 38,523
- Household income
- $91,761
- Rent vs Own
- Severe rent burden
- 1415.0
Population outlook (King County) Hauer SSP2
- Today (2025)
- 2,576,485 people
- By 2030
- 2,803,316 · +8.8%
- By 2040
- 3,255,921 · +26.4%
- By 2050
- 3,706,444 · +43.9%
- By 2075
- 4,746,063 · +84.2%
- By 2100
- 5,407,730 · +109.9%
Race, ethnicity, and origin ACS 2023
- Neighborhood character
- Highly diverse neighborhood (Simpson 0.74)
- Race & ethnicity
- White 41% Asian 24% Hispanic / Latino 15% Black 11% Two or more races 9% Pacific Islander 3%
- Hispanic origin (detail)
- Mexican 12%
- Common ancestry
- Subsaharan African 6% Italian 4% Portuguese 2%
- Foreign-born
- 36% · Canada, Vietnam, Philippines
- Languages at home
- 53% English-only · Spanish 10% Other Indo-European 9% Other Asian/Pacific 8%
Political lean MEDSL · King
- 2024 margin
- Solid D (+51.7) · D 74.2% · R 22.5% · Other 3.4%
- 2008→2024 swing
- +9.6pp toward D · 2008: 42.1pp · 2024: 51.7pp
- All cycles
- 2024: D+51.7 2020: D+52.7 2016: D+50.4 2012: D+39.9 2008: D+42.1
Not yet ingested
- Civics
- —
Market trends
- HPI YoY
- ▼ -494.18%
- Current HPI
- 315.2007
- Rent YoY
- ▲ 3.72%
- Metro
- Seattle-Tacoma-Bellevue, WA
- State GDP YoY
- ▲ 4.65%
- F500 in state
- 22
Industry mix (Fortune 500 HQ in WA)
| Industry | F500 HQs | Revenue |
|---|---|---|
| Retail | 2 | $269B |
|
||
| Technology / Retail | 1 | $638B |
|
||
| Technology | 1 | $245B |
|
||
| Telecommunications | 1 | $38B |
|
||
| Food / Beverage | 1 | $36B |
|
||
| Automotive / Trucks | 1 | $34B |
|
||
Price history
-23.5% since first listed4 events — show timeline
- 2026-04-14 Price Changed $64,999 NWMLS as Distributed by MLS Grid
- 2026-03-24 Price Changed $74,999 NWMLS as Distributed by MLS Grid
- 2026-02-26 Price Changed $79,999 NWMLS as Distributed by MLS Grid
- 2026-01-28 Listed $84,999 NWMLS as Distributed by MLS Grid
Cash-flow waterfall
monthlySold comps — $/sqft
last 12 mo · ≤1 miLoading sold comps…