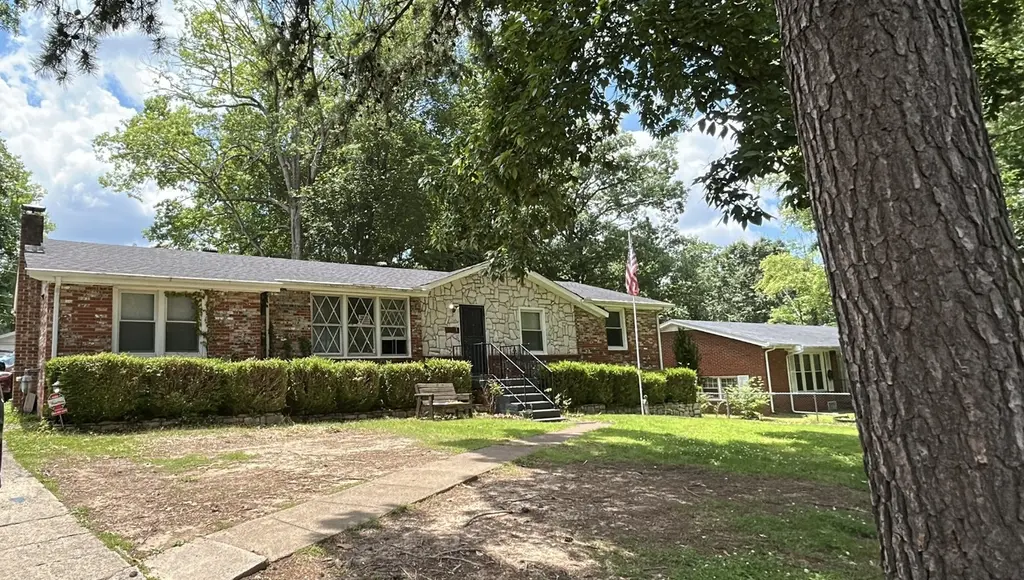
138 Saratoga Dr · Clarksville, TN
Flood risk 1/10 · Minimal
- FEMA flood zone
- X (unshaded)
- Chance of flooding over 30 yrs
- 0.0%
- Est. flood insurance / yr
- $507 – $1,088
Fire risk 1/10 · Minimal
- Est. fire insurance / yr
- $949 – $1,763
Heat risk 5/10 · Moderate
- Hot days now (above 107°F)
- 7 days/yr
- Hot days in 30 yrs
- 20 days/yr
Wind risk 4/10 · Minor
- Chance of severe wind over 30 yrs
- 9.0%
Air-quality risk 2/10 · Minimal
- Unhealthy air days now
- 1 days/yr
- Unhealthy air days in 30 yrs
- 1 days/yr
Risk factors via First Street. Map © Google.
Why this score? — see what drove the D+ grade
The composite is a weighted blend of 9 inputs, each scored 0–100. Each bar is that input's sub-score; the figure is the points it added to the 100-point composite (weight × sub-score).
- Cash flow +15.0/30.0
- ARV discount +15.0/15.0
- DSCR +4.6/10.0
- Livability +4.2/5.0
- 1% rule +3.4/10.0
- Rent growth +2.8/5.0
- Schools +2.5/10.0
- Condition / age +2.5/5.0
- Appreciation +0.0/10.0
$210,000
🖨 Deal sheet 📄 Offer letter ✓ Due diligence
Listing remarks MLS
Incredible one of a kind home! Only one owner, meticulously maintained, den with exposed beams, heated/cooled sun room, detached garage, over 2000 sq/ft, hardwood, large lot and more! Come see this gem before its gone!
Key facts
- 0.33 acre lot
- Garage
- Built 1963
Neighborhood map
What this means for you Summary
Snapshot
- This is a 3-bed/3.0-bath single-family listed at $210k.
Deal economics
- At list price, monthly cash flow is $65 ($778/yr) — positive.
- The deal already cash-flows at list — no discount required.
- To meet the 1% rule (rent ≥ 1% of price), the offer needs to be $176k (16.0% below list).
- Recommended offer: $176k (16.0% below list) — sets the bar for 1% rule.
- Cap rate 6.7% vs local median 3.5% in Clarksville — top-decile yield for the area; either an underpriced asset or a hidden risk that comps aren't pricing in. Stress-test before assuming the spread holds.
Location & tenants
- Location reads 84/100 on livability (#1 in TN, #798 nationally) — a professional / high-income tenant draw. Strengths: amenities A+, commute A+, cost of living A+; Watch: employment C-, crime D+.
- Montgomery County (urban): math 25% / reading 31% proficiency, ranked #65 of 139 in TN (top 47%) — low school quality limits family demand, transient renter base, plan for 1-2y turnover.
- Zoned schools: Byrns Darden Elementary (math 14% / reading 21%, grade F, #704 of 952 statewide, top 74%, 536 students, 0% FRL); Kenwood High (math 5% / reading 29%, grade F, #225 of 332 statewide, top 69%, 1,291 students, 0% FRL) — zoned schools average 0% FRL vs 40% district-wide (40 pts lower); this property's tenant base skews higher-income than the district average.
- Market conditions: Rents rising (+1.3%/yr); 893 active listings in the ZIP; 11 comparable units currently listed for rent nearby; rentals at typical pace (median 21d on market — plan ~3-4 weeks tenant-placement turnaround); 2,583 units permitted in Montgomery County in 2024 (617 in 5+ unit buildings).
- This rent runs 30% of the median local income ($70k/yr) — at the standard rent-burdened threshold; future hikes will face affordability resistance.
Forward outlook
- Local home prices are declining (-3.0%/yr); year-one equity from $1k of loan paydown is wiped out by about $6k of value loss. Plan a longer hold.
- Montgomery County population projected at +49% by 2050 — long-run rental-demand tailwind backs the buy-and-hold thesis.
Negotiation context
- Only 2 days on market — expect competitive offers; lowballing is unlikely to land.
- 2 sale attempts since 9y ago; this cycle's ask is 50% above the opening price — seller raised mid-cycle; expect resistance to lowballs.
- Current owner paid $140k; list at $210k implies a 50% gain — meaningful room to come down on a strong offer.
Risks & watch-outs
- Climate carrying-cost: extreme-heat days projected 7→20/yr by 2055 (HVAC capex compounding) — expect insurance premiums to compound above CPI over the hold.
Questions for the listing agent
- Built in 1963 — when were the roof, HVAC, electrical panel, plumbing, and water heater last replaced?
- Is there a deadline driving the sale (1031 exchange, divorce, estate, relocation)? That informs how much negotiation room exists.
- Crime grade is D in this area — have there been break-ins, vandalism, or insurance claims at this property in the last 3 years? What carrier currently insures it and at what premium?
- The area grade is low — what's the realistic commute time and amenity access for the typical tenant pool here? Any planned neighborhood developments (good or bad) we should know about?
- What's the average days-on-market for RENTAL listings here right now (not sales)? A rising rental-DOM trend means longer vacancies and softer asking-rent achievability than the comps imply.
- What's the recent tenant-quality profile in this submarket — average credit score on applications, eviction rate, late-payment / NSF rate, and stable-employment percentage? A property-management company in the area should have these aggregated.
- How much new for-sale + rental construction is in the pipeline within 1–3 miles? Heavy new supply typically softens prices + rents 12–24 months out; constrained supply supports both.
Investment metrics
- 1% rule
- 0.84% ✗
- Cap rate
- 6.66%
- Cash-on-cash
- 1.32%
- DSCR
- 1.06
- GRM
- 9.9
CMA / ARV
- ARV (on-the-fly)
- $317,608
- Comps found
- 12
Show comp detail 12 sales within ~0.75 mi
| Address | Dist | Beds/Ba | Sqft | Sold | Price | $/sf | Match |
|---|---|---|---|---|---|---|---|
| 128 Delaware Dr | 0.08mi | 3/3.0 | 2,150 (+0%) | 9mo | $283,000 | $132 | 88 |
| 233 Pine Mountain Rd | 0.22mi | 3/2.0 | 2,002 (-7%) | 7mo | $200,000 | $100 | 68 |
| 284 Shiloh Rd | 0.21mi | 3/2.5 | 1,869 (-13%) | 8mo | $308,000 | $165 | 60 |
| 626 Bunker Hill Rd | 0.65mi | 3/2.0 | 2,209 (+3%) | 3mo | $309,900 | $140 | 58 |
| 187 Dale Ter | 0.66mi | 3/2.5 | 2,214 (+3%) | 6mo | $255,000 | $115 | 57 |
| 54 W Bel Air Blvd | 0.41mi | 3/2.0 | 1,971 (-8%) | 10mo | $295,000 | $150 | 55 |
| 1215 Verkler Dr | 0.47mi | 3/2.5 | 1,845 (-14%) | 1mo | $280,000 | $152 | 52 |
| 12 Brandywine Dr | 0.31mi | 3/2.0 | 1,850 (-14%) | 8mo | $249,000 | $135 | 52 |
| 342 Broadmore Dr | 0.69mi | 3/2.5 | 2,300 (+7%) | 3mo | $340,000 | $148 | 51 |
| 648 Bunker Hill Rd | 0.63mi | 4/2.0 (+1) | 2,074 (-3%) | 12mo | $304,900 | $147 | 46 |
| 1038 Roedeer Dr | 0.53mi | 4/2.5 (+1) | 1,881 (-12%) | 2mo | $306,000 | $163 | 46 |
| 625 Paddy Run Rd | 0.66mi | 3/2.0 | 1,909 (-11%) | 4mo | $295,000 | $155 | 43 |
Match score weights: distance 35% · size 25% · config 20% · recency 20%. Top-matched comps best support the ARV.
Projected returns pro-forma
-3.0% appreciation · 1.27% rent growth · sell at horizon
- IRR
- -16.0%
- Equity multiple
- 0.44×
- Total profit
- $-32,967
- Equity at exit
- $31,312
- IRR
- -10.8%
- Equity multiple
- 0.40×
- Total profit
- $-35,548
- Equity at exit
- $18,157
Cash invested: $58,800 (down + closing). Projections, not guarantees.
Landlord ↔ Tenant lean methodology
- Overall (STATE)
- 87 Strongly Landlord-Friendly
- State Tennessee
- 87 Strongly Landlord-Friendly · R+13
- County
- — inherits STATE
- City
- — inherits STATE
ZIP-level market 37042
- Home prices YoY
- -18.2%
- Rents YoY
- 1.3%
- Active inventory
- 893
- Price-to-rent
- 9.9×
Monthly cashflow live
- Estimated rent
- $1,763 high interval (Pro) →
- Mortgage (P&I)
- −$1,101
- Tax from tax record
- −$139 /mo · $1,670/yr
- Insurance
- −$88
- HOA
- −$0
- Vacancy / Maint / Mgmt
- −$370
- Net cashflow
- $65
Break-even live
UW: 25.0% down · 7.5% · 30yr · 1.5% tax · 5.0% vac · 8.0% maint · 8.0% mgmt
Financing live
Cash to close
- Down payment
- $52,500
- Closing costs
- $6,300
- Reserves months
- —
- Total cash needed
- —
Loan-product check · same deal, 3 products live
Conventional
25% down · 7.5% · 30yr
- Down + closing
- —
- Monthly P&I
- —
- Monthly cashflow
- —
- DSCR
- —
- Eligible?
- —
Personal DTI + credit; lowest rate.
DSCR
20% down · 8.5% · 30yr
- Down + closing
- —
- Monthly P&I
- —
- Monthly cashflow
- —
- DSCR
- —
- Eligible?
- —
No personal income docs; deal must DSCR.
Hard money
10% down · 12.0% · 12mo
- Down + closing
- —
- Monthly P&I
- —
- Monthly cashflow
- —
- DSCR
- —
- Eligible?
- —
Short-term bridge; refi at stabilization.
Rent comps 11 comps
| Address | Beds | Baths | Sqft | Rent | $/sqft | DOM | Units | Dist |
|---|---|---|---|---|---|---|---|---|
| 1103 Rosebrook Dr Clarksville, TN | 3.0 | 2.5 | 1908 | $1,900 | $1.00 | 20d | 1 | 0.15mi |
| 1122 Rosebrook Dr Clarksville, TN | 3.0 | 2.5 | 1736 | $1,730 | $1.00 | 20d | 1 | 0.34mi |
| 404 Carter Rd Clarksville, TN | 3.0 | 2.0 | 1600 | $1,550 | $0.97 | 13d | 1 | 0.87mi |
| 1319 Fort Campbell Blvd Clarksville, TN | 3.0 | 2.0 | 2080 | $1,750 | $0.84 | 20d | 1 | 0.96mi |
| 7 Dalewood Dr Clarksville, TN | 4.0 | 2.0 | 1726 | $1,450 | $0.84 | 20d | 1 | 0.97mi |
| 125 Mossland Dr Clarksville, TN | 3.0 | 2.5 | 1718 | $1,950 | $1.14 | 13d | 1 | 0.99mi |
| 706 Green Valley Ct Clarksville, TN | 4.0 | 3.0 | 1753 | $1,850 | $1.06 | 13d | 1 | 1.00mi |
| 219 Kirby Dr Clarksville, TN | 3.0 | 1.5 | 1425 | $1,495 | $1.05 | 20d | 1 | 1.25mi |
| 116 Waterwheel Cir Clarksville, TN | 3.0 | 2.5 | 1581 | $1,700 | $1.08 | 20d | 1 | 1.37mi |
| 194 Bob White Dr Clarksville, TN | 3.0 | 1.5 | 1700 | $1,495 | $0.88 | 20d | 1 | 1.38mi |
| 397 Elaine Dr Clarksville, TN | 4.0 | 2.0 | 1700 | $1,395 | $0.82 | 13d | 1 | 1.41mi |
Listing history 8 events
-
2025-06-27status Pending
-
2025-06-25status Active
-
2025-06-15status Pending
-
2025-06-13historical $210,000
-
2017-04-05soldstatus $139,900
-
2017-04-03soldstatus $139,900 Closed 218-char remark
Show marketing remark (218 chars)
Incredible one of a kind home! Only one owner, meticulously maintained, den with exposed beams, heated/cooled sun room, detached garage, over 2000 sq/ft, hardwood, large lot and more! Come see this gem before its gone!
-
2017-02-20status Pending 218-char remark
Show marketing remark (218 chars)
Incredible one of a kind home! Only one owner, meticulously maintained, den with exposed beams, heated/cooled sun room, detached garage, over 2000 sq/ft, hardwood, large lot and more! Come see this gem before its gone!
-
2017-02-14$139,900 Active 218-char remark
Show marketing remark (218 chars)
Incredible one of a kind home! Only one owner, meticulously maintained, den with exposed beams, heated/cooled sun room, detached garage, over 2000 sq/ft, hardwood, large lot and more! Come see this gem before its gone!
ⓘ Source: listings_history table (triggers on properties + properties_extension) + one-shot
backfill from property_details.listing_events for pre-trigger history.
Tax reassessment forecast TN · Resets to sale price
- Current annual tax
- $1,670 · $139/mo
- Projected year-2 tax
- $1,670 · $139/mo
- Expected delta
- $0/yr ($0/mo · 0.0%)
ⓘ Screening estimate from a state-policy table — verify with the county assessor before closing.
Climate risk First Street
- Flood 1/10 Low FEMA zone X (unshaded) · 0% chance over 30 yrs
- Wildfire 1/10 Low
- Heat 5/10 Major 7 d/yr ≥107°F today · 20 d/yr by 30 yrs out
- Wind 4/10 Moderate 9% chance of damaging wind over 30 yrs
- Air quality 2/10 Low 1 unhealthy d/yr today · 1 by 30 yrs out
Nearby sold comps map
Loading sold comps map…
Walkable amenities ~0.75 mi
Loading nearby amenities…
Taxation est. · year 1
- Rental income
- $21,156
- − Mortgage interest
- −$11,763
- − Property taxes
- −$1,670
- − Insurance
- −$1,050
- − Repairs & maintenance
- −$1,692
- − Management
- −$1,692
- − Depreciation
- −$6,109
- Taxable loss
- −$2,822
- Est. tax savings @ 24.0%
- +$677
- After-tax cash flow
- $1,455/yr
For passive investors: Depreciation is non-cash, so a rental often shows a tax loss while cash-flowing — sheltering income. Rental losses are passive: they offset passive income freely, and up to $25,000/yr can offset ordinary (W-2) income if you actively participate and your MAGI is under $100k (phasing out to $0 by $150k); unused losses carry forward. On sale, claimed depreciation is recaptured at up to 25%, and gains may owe capital-gains tax (a 1031 exchange can defer both). Figures are a year-1 estimate at your 24.0% rate — not tax advice; consult a CPA.
Schools (NCES district)
- District
- Montgomery County
- NCES district ID
- 4703030
- Math proficiency
- 25% ▼ -20.00%
- Reading proficiency
- 31% ▼ -10.00%
- Median HH income
- $50,423
- Composite
- 24.56/100
- National rank
- #7641
- State rank
- #65 of 139 in TN
Livability — Clarksville
- Score
- 84/100
- State rank
- #1
- US rank
- #798
Category grades
Schools grade is shown separately in the Schools card above.
Census & demographics
- Census place
- Clarksville, TN
- County
- Montgomery County · 211,371 people
- City population
- 211,371
- Metro
- Clarksville, TN-KY
- Population (ZIP)
- 87,652
- Household income
- $70,393
- Rent vs Own
- Severe rent burden
- 2093.0
Population outlook (Montgomery County) Hauer SSP2
- Today (2025)
- 236,633 people
- By 2030
- 258,978 · +9.4%
- By 2040
- 305,456 · +29.1%
- By 2050
- 353,147 · +49.2%
- By 2075
- 471,289 · +99.2%
- By 2100
- 564,122 · +138.4%
Race, ethnicity, and origin ACS 2023
- Neighborhood character
- Diverse neighborhood (Simpson 0.68)
- Race & ethnicity
- White 48% Black 26% Hispanic / Latino 15% Two or more races 13% Asian 3%
- Hispanic origin (detail)
- Mexican 6% Puerto Rican 4%
- Common ancestry
- Italian 4% Slovak 1% Lithuanian 1%
- Foreign-born
- 8% · Canada, South Korea, China
- Languages at home
- 88% English-only · Spanish 8% German/W. Germanic 1% Other Indo-European 1%
Political lean MEDSL · Montgomery
- 2024 margin
- R (+18.4) · D 40.0% · R 58.5% · Other 1.5%
- 2008→2024 swing
- -10.5pp toward R · 2008: -7.9pp · 2024: -18.4pp
- All cycles
- 2024: R+18.4 2020: R+12.7 2016: R+18.6 2012: R+10.5 2008: R+7.9
Not yet ingested
- Civics
- —
Market trends
- HPI YoY
- ▼ -58.81%
- Current HPI
- 264.4911
- Rent YoY
- ▲ 1.27%
- Metro
- Clarksville, TN-KY
- State GDP YoY
- ▲ 2.78%
- F500 in state
- 22
Industry mix (Fortune 500 HQ in TN)
| Industry | F500 HQs | Revenue |
|---|---|---|
| Healthcare | 3 | $91B |
|
||
| Retail | 3 | $72B |
|
||
| Transportation / Logistics | 1 | $88B |
|
||
| Paper / Packaging | 1 | $19B |
|
||
| Insurance | 1 | $13B |
|
||
| Energy | 1 | $12B |
|
||
Price history
+50.1% since first listed8 events — show timeline
- 2025-06-27 Pending — REALTRACS as Distributed by MLS Grid
- 2025-06-25 Relisted — REALTRACS as Distributed by MLS Grid
- 2025-06-15 Pending — REALTRACS as Distributed by MLS Grid
- 2025-06-13 Coming Soon $210,000 REALTRACS as Distributed by MLS Grid
- 2017-04-05 Sold (Public Records) $139,900 Public Records
- 2017-04-03 Sold (MLS) $139,900 REALTRACS as Distributed by MLS Grid
- 2017-02-20 Pending — REALTRACS as Distributed by MLS Grid
- 2017-02-14 Listed $139,900 REALTRACS as Distributed by MLS Grid
Property tax history
+6.5%/yrLatest (2025): $1,670 · +1.3% YoY. Source: county tax records.
Cash-flow waterfall
monthlySold comps — $/sqft
last 12 mo · ≤1 miLoading sold comps…