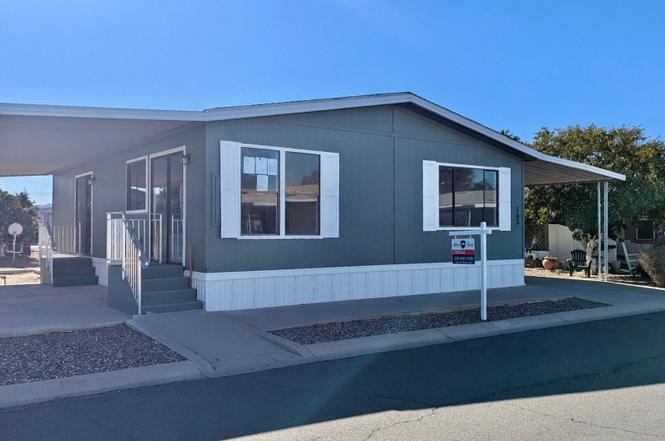
450 W Sunwest Dr #163 · Casa Grande, AZ
Flood risk 1/10 · Minimal
- FEMA flood zone
- X (unshaded)
- Chance of flooding over 30 yrs
- 0.0%
- Est. flood insurance / yr
- $507 – $1,088
Fire risk 6/10 · Moderate
- Est. fire insurance / yr
- $610 – $1,132
Heat risk 9/10 · Severe
- Hot days now (above 113°F)
- 6 days/yr
- Hot days in 30 yrs
- 15 days/yr
Wind risk 1/10 · Minimal
- Chance of severe wind over 30 yrs
- —
Air-quality risk 2/10 · Minimal
- Unhealthy air days now
- 1 days/yr
- Unhealthy air days in 30 yrs
- 1 days/yr
Risk factors via First Street. Map © Google.
Why this score? — see what drove the D- grade
The composite is a weighted blend of 9 inputs, each scored 0–100. Each bar is that input's sub-score; the figure is the points it added to the 100-point composite (weight × sub-score).
- 1% rule +10.0/10.0
- Cash flow +8.0/30.0
- ARV discount +7.5/15.0
- Rent growth +3.7/5.0
- Livability +2.9/5.0
- Condition / age +2.5/5.0
- DSCR +2.1/10.0
- Schools +1.5/10.0
- Appreciation +0.0/10.0
$85,000
🖨 Deal sheet (PDF) 📄 Offer letter ✓ Due diligence
Listing remarks
* 3 MONTHS OF FREE LOT RENT! * Welcome to Sunwest Resort Village #163! This newly renovated 1983 Golden West 28x36 features new stainless steel appliances, new floors & carpet, professionally painted interior and exterior, new toilets, new sinks & vanity counter tops, and master bedroom access to the patio! Take advantage of this beautiful gated community offering a pool & spa, exercise room, pool & poker room, shuffleboard courts, and countless community activities! Schedule your appointment to view this stunning home today, it won't last long! If you are over the age of 40, please reach out for more information.
Key facts
- New floors
- Gated community
- Exercise room
Tags
Property features AI
Finance
- Other: Listed price: $85,000
- HOA & community: Association fee: $675
Exterior
- Parking: 2 total parking spaces
- Utilities: Has heating; Has cooling
- Home design: Single-level plan: Golden West 28x36; Spec inventory home
- Construction: Living area approximately 1008
- Exterior features: Composition roof
Interior
- Kitchen: Includes dishwasher and refrigerator
- Bedrooms: 2 bedrooms
- Bathrooms: 2 full bathrooms
- Heating & cooling: Electric forced-air heating; Central air conditioning; Ceiling fans
- Interior features: Dishwasher; Refrigerator
Neighborhood map
What this means for you Summary
Snapshot
- This is a 2-bed/2.0-bath manufactured listed at $85k.
Deal economics
- At list price, monthly cash flow is $-87 ($-1k/yr) — negative.
- To cash-flow at today's rent, offer at most $72k (14.7% below list).
- Meets the 1% rule at list price ($1k rent vs $85k).
- Recommended offer: $72k (14.7% below list) — sets the bar for cash-flow.
- Cap rate 5.1% vs local median 4.0% in Casa Grande — meaningfully above typical; check what's discounted (condition, days-on-market, listing class) to confirm the premium yield is real.
Location & tenants
- Location reads 58/100 on livability (#220 in AZ) — a working-class tenant base; expect higher turnover. Strengths: cost of living A+, housing A+; Watch: crime D+, employment D+, amenities F.
- Casa Grande Union High School District (4453) (suburban): math 14% / reading 21% proficiency, ranked #193 of 249 in AZ (top 78%) — low school quality limits family demand, transient renter base, plan for 1-2y turnover.
- Zoned schools: Cottonwood Elementary School (math 8% / reading 8%, grade F, #1,056 of 1,109 statewide, top 96%, 451 students, 89% FRL); Casa Grande Middle School (math 7% / reading 12%, grade F, #197 of 218 statewide, top 91%, 645 students, 84% FRL); Casa Grande Union High School (math 18% / reading 25%, grade F, #217 of 381 statewide, top 57%, 2,132 students, 52% FRL).
- Market conditions: Rents rising fast (+4.6%/yr); 632 active listings in the ZIP; 21 comparable units currently listed for rent nearby; rentals at typical pace (median 17d on market — plan ~3-4 weeks tenant-placement turnaround); 9,504 units permitted in Pinal County in 2024 (776 in 5+ unit buildings).
Forward outlook
- Local home prices are declining (-3.0%/yr); year-one equity from $588 of loan paydown is wiped out by about $3k of value loss. Plan a longer hold.
Negotiation context
- It's been on market 521 days — a 12% lower offer ($75k) is reasonable based on typical stale-listing flexibility.
Risks & watch-outs
- Watch-outs: HOA is 45% of rent.
- Climate carrying-cost: major wildfire risk; extreme-heat days projected 6→15/yr by 2055 (HVAC capex compounding) — expect insurance premiums to compound above CPI over the hold.
Questions for the listing agent
- What do current leases actually rent for vs. the listed asking? Can we see a recent rent roll and the last 12 months of T-12 income?
- It's been on market 521 days. Have you received any prior offers? Is the seller open to a 15% concession, seller financing, or rate buy-down credit?
- What does the HOA fee cover, when was the last increase, and are there any pending special assessments or reserve-fund shortfalls?
- Why hasn't it sold? Are there any deal-killer items the seller is aware of (foundation, flood, title, zoning, code violations)?
- Is there a deadline driving the sale (1031 exchange, divorce, estate, relocation)? That informs how much negotiation room exists.
- Schools are F-rated, which usually means shorter tenancies and higher turnover. Who's the typical renter profile here, and what's been the actual vacancy rate?
- Crime grade is D in this area — have there been break-ins, vandalism, or insurance claims at this property in the last 3 years? What carrier currently insures it and at what premium?
- The area grade is low — what's the realistic commute time and amenity access for the typical tenant pool here? Any planned neighborhood developments (good or bad) we should know about?
- What's the average days-on-market for RENTAL listings here right now (not sales)? A rising rental-DOM trend means longer vacancies and softer asking-rent achievability than the comps imply.
- What's the recent tenant-quality profile in this submarket — average credit score on applications, eviction rate, late-payment / NSF rate, and stable-employment percentage? A property-management company in the area should have these aggregated.
- How much new for-sale + rental construction is in the pipeline within 1–3 miles? Heavy new supply typically softens prices + rents 12–24 months out; constrained supply supports both.
Investment metrics
- 1% rule
- 1.75% ✓
- Cap rate
- 5.07%
- Cash-on-cash
- -4.37%
- DSCR
- 0.81
- GRM
- 4.8
CMA / ARV
- ARV (on-the-fly)
- $55,440
- Comps found
- 12
Show comp detail 12 sales within ~0.75 mi
| Address | Dist | Beds/Ba | Sqft | Sold | Price | $/sf | Match |
|---|---|---|---|---|---|---|---|
| 450 W Sunwest Dr #111 | 0.00mi | 2/2.0 | 1,024 (+2%) | 6mo | $45,000 | $44 | 92 |
| 426 W Cottonwood Ln #83 | 0.14mi | 2/2.0 | 1,045 (+4%) | 2mo | $78,000 | $75 | 86 |
| 450 W Sunwest Dr #69 | 0.09mi | 2/2.0 | 960 (-5%) | 5mo | $67,500 | $70 | 84 |
| 450 W Sunwest Dr #135 | 0.00mi | 2/2.0 | 960 (-5%) | 10mo | $53,000 | $55 | 83 |
| 426 W Cottonwood Ln #25 | 0.22mi | 2/2.0 | 930 (-8%) | 8mo | $60,000 | $65 | 71 |
| 120 W Oneil Dr #48 | 0.46mi | 2/1.5 | 980 (-3%) | 2mo | $20,000 | $20 | 70 |
| 120 W Oneil Dr #71 | 0.44mi | 2/2.0 | 960 (-5%) | 5mo | $38,000 | $40 | 67 |
| 450 W Sunwest Dr #139 | 0.00mi | 3/2.0 (+1) | 1,152 (+14%) | 6mo | $75,000 | $65 | 66 |
| 1409 N French St #78 | 0.58mi | 2/2.0 | 968 (-4%) | 1mo | $79,000 | $82 | 66 |
| 120 W O'neil Dr #58 | 0.46mi | 3/2.0 (+1) | 1,056 (+5%) | 2mo | $48,999 | $46 | 64 |
| 708 W Mcmurray Blvd #38 | 0.61mi | 3/2.0 (+1) | 900 (-11%) | 8mo | $30,000 | $33 | 42 |
| 1451 N Pinal Ave #31 | 0.48mi | 1/1.0 (-1) | 900 (-11%) | 11mo | $15,000 | $17 | 42 |
Match score weights: distance 35% · size 25% · config 20% · recency 20%. Top-matched comps best support the ARV.
Projected returns pro-forma
-3.0% appreciation · 4.6% rent growth · sell at horizon
- IRR
- -19.0%
- Equity multiple
- 0.31×
- Total profit
- $-16,417
- Equity at exit
- $12,674
- IRR
- -5.1%
- Equity multiple
- 0.61×
- Total profit
- $-9,300
- Equity at exit
- $7,349
Cash invested: $23,800 (down + closing). Projections, not guarantees.
Landlord ↔ Tenant lean methodology
- Overall (STATE)
- 87 Strongly Landlord-Friendly
- State Arizona
- 87 Strongly Landlord-Friendly · R+3
- County
- — inherits STATE
- City
- — inherits STATE
ZIP-level market 85122
- Home prices YoY
- -22.4%
- Rents YoY
- 4.6%
- Active inventory
- 632
- Price-to-rent
- 4.8×
Monthly cashflow live
- Estimated rent
- $1,488 high interval (Pro) →
- Mortgage (P&I)
- −$446
- Tax est. 1.5%
- −$106 /mo · $1,275/yr
- Insurance
- −$35
- HOA
- −$675
- Vacancy / Maint / Mgmt
- −$313
- Net cashflow
- $-87
Break-even live
Sensitivity live
| Price | -10% $-28 | -5% $-57 | +0% $-87 | +5% $-116 | +10% $-145 |
|---|---|---|---|---|---|
| Rent | -10% $-204 | -5% $-145 | +0% $-87 | +5% $-28 | +10% $31 |
| Rate | -1.0pp $-44 | -0.5pp $-65 | base $-87 | +0.5pp $-109 | +1.0pp $-131 |
UW: 25.0% down · 7.5% · 30yr · 1.5% tax · 5.0% vac · 8.0% maint · 8.0% mgmt
Financing live
Cash to close
- Down payment
- $21,250
- Closing costs
- $2,550
- Reserves months
- —
- Total cash needed
- —
Loan-product check · same deal, 3 products live
Conventional
25% down · 7.5% · 30yr
- Down + closing
- —
- Monthly P&I
- —
- Monthly cashflow
- —
- DSCR
- —
- Eligible?
- —
Personal DTI + credit; lowest rate.
DSCR
20% down · 8.5% · 30yr
- Down + closing
- —
- Monthly P&I
- —
- Monthly cashflow
- —
- DSCR
- —
- Eligible?
- —
No personal income docs; deal must DSCR.
Hard money
10% down · 12.0% · 12mo
- Down + closing
- —
- Monthly P&I
- —
- Monthly cashflow
- —
- DSCR
- —
- Eligible?
- —
Short-term bridge; refi at stabilization.
Rent comps 21 comps
| Address | Beds | Baths | Sqft | Rent | $/sqft | DOM | Units | Dist |
|---|---|---|---|---|---|---|---|---|
| 541 W Melrose Dr Casa Grande, AZ | 3.0 | 2.0 | 1101 | $1,600 | $1.45 | 26d | 1 | 0.40mi |
| 290 W Viola St Unit 4 Casa Grande, AZ | 2.0 | 1.0 | 800 | $1,250 | $1.56 | 16d | 1 | 0.51mi |
| 767 W Barrus Dr Casa Grande, AZ | 3.0 | 2.0 | 1463 | $1,695 | $1.16 | 26d | 1 | 0.55mi |
| 1858 N Center Ave Casa Grande, AZ | 2.0 | 2.0 | 1146 | $1,500 | $1.31 | 26d | 1 | 0.75mi |
| 645 W Jardin Dr Casa Grande, AZ | 3.0 | 2.0 | 1309 | $1,650 | $1.26 | 26d | 1 | 0.78mi |
| 701 W 12th St Unit F Casa Grande, AZ | 2.0 | 1.0 | 745 | $1,500 | $2.01 | 26d | 1 | 0.82mi |
| 803 W Jardin Dr Casa Grande, AZ | 3.0 | 2.0 | 1491 | $1,725 | $1.16 | 6d | 1 | 0.85mi |
| 1550 N Casa Grande Ave Casa Grande, AZ | 1.0–2.0 | 1.0–2.0 | 625 | $1,199 | $1.92 | 0d | 1 | 0.87mi |
| 1641 N Kadota Ave Casa Grande, AZ | 1.0–2.0 | 1.0–2.0 | 750 | $1,100 | $1.47 | 0d | 3 | 0.94mi |
| 1010 N Park Ave Casa Grande, AZ | 2.0 | 1.0 | 920 | $1,100 | $1.20 | 14d | 1 | 0.96mi |
| 1564 N Morrison Ave Casa Grande, AZ | 2.0–3.0 | 2.0 | 871 | $956 | $1.10 | 0d | 19 | 0.97mi |
| 416 W 9th St Unit 1 Casa Grande, AZ | 2.0 | 1.0 | 725 | $1,200 | $1.66 | 14d | 1 | 1.00mi |
| 1113 W Corinthian Cir Casa Grande, AZ | 3.0 | 2.0 | 981 | $1,395 | $1.42 | 16d | 1 | 1.01mi |
| 300 W 9th St Casa Grande, AZ | 2.0 | 1.0 | 775 | $999 | $1.29 | 23d | 1 | 1.03mi |
| 419 W 9th St Apt A Casa Grande, AZ | 2.0 | 1.0 | 750 | $1,199 | $1.60 | 26d | 1 | 1.03mi |
| 776 W Fairlane Ct Casa Grande, AZ | 3.0 | 2.0 | 1489 | $3,200 | $2.15 | 26d | 1 | 1.06mi |
| 803 N Park Ave Casa Grande, AZ | 2.0 | 1.0 | 822 | $1,275 | $1.55 | 7d | 1 | 1.12mi |
| 2094 N Sweetwater Dr Casa Grande, AZ | 3.0 | 2.0 | 1266 | $1,700 | $1.34 | 26d | 1 | 1.14mi |
| 1926 N Avenida de Palmas Casa Grande, AZ | 2.0 | 2.0 | 1106 | $1,199 | $1.08 | 23d | 3 | 1.35mi |
| 1620 N Trekell Rd Casa Grande, AZ | 1.0–3.0 | 1.0–2.5 | 1090 | $2,165 | $1.99 | 0d | 1 | 1.36mi |
| 1161 E O'Neil Dr Casa Grande, AZ | 2.0–4.0 | 2.0 | 1144 | $1,295 | $1.13 | 0d | 13 | 1.49mi |
HOA detail
- Monthly dues
- $675 · $8,100/yr
- Likely covers
- poolsecurity
Listing history 15 events
-
2026-06-21days on market $85,000 Active 521 DOM
-
2026-06-18days on market $85,000 Active 518 DOM
-
2026-06-17days on market $85,000 Active 517 DOM
-
2026-06-16days on market $85,000 Active 516 DOM
-
2026-06-15days on market $85,000 Active 515 DOM
-
2026-06-13days on market $85,000 Active 513 DOM
-
2026-06-13days on market $85,000 Active 512 DOM
-
2026-06-09days on market $85,000 Active 509 DOM
-
2026-06-08days on market $85,000 Active 508 DOM
-
2026-06-07days on market $85,000 Active 507 DOM
-
2026-06-04days on market $85,000 Active 504 DOM
-
2026-06-03days on market $85,000 Active 503 DOM
-
2026-06-02days on market $85,000 Active 502 DOM
-
2026-06-01days on market $85,000 Active 501 DOM
-
2026-05-31days on market $85,000 Active 500 DOM
ⓘ Source: listings_history table (triggers on properties + properties_extension) + one-shot
backfill from property_details.listing_events for pre-trigger history.
Climate risk First Street
- Flood 1/10 Low FEMA zone X (unshaded) · 0% chance over 30 yrs
- Wildfire 6/10 Major
- Heat 9/10 Extreme 6 d/yr ≥113°F today · 15 d/yr by 30 yrs out
- Wind 1/10 Low
- Air quality 2/10 Low 1 unhealthy d/yr today · 1 by 30 yrs out
Nearby sold comps map
Loading sold comps map…
Walkable amenities ~0.75 mi
Loading nearby amenities…
Taxation est. · year 1
- Rental income
- $17,861
- − Mortgage interest
- −$4,761
- − Property taxes
- −$1,275
- − Insurance
- −$425
- − Repairs & maintenance
- −$1,429
- − Management
- −$1,429
- − HOA
- −$8,100
- − Depreciation
- −$2,473
- Taxable loss
- −$2,031
- Est. tax savings @ 24.0%
- +$487
- After-tax cash flow
- $-552/yr
For passive investors: Depreciation is non-cash, so a rental often shows a tax loss while cash-flowing — sheltering income. Rental losses are passive: they offset passive income freely, and up to $25,000/yr can offset ordinary (W-2) income if you actively participate and your MAGI is under $100k (phasing out to $0 by $150k); unused losses carry forward. On sale, claimed depreciation is recaptured at up to 25%, and gains may owe capital-gains tax (a 1031 exchange can defer both). Figures are a year-1 estimate at your 24.0% rate — not tax advice; consult a CPA.
Schools (NCES district)
- District
- Casa Grande Union High School District (4453)
- NCES district ID
- 0401740
- Math proficiency
- 14% ▼ -15.00%
- Reading proficiency
- 21% ▼ -10.00%
- Median HH income
- $45,373
- Composite
- 15.38/100
- National rank
- #9319
- State rank
- #193 of 249 in AZ
Livability — Casa Grande
- Score
- 58/100
- State rank
- #220
- US rank
- #21534
Category grades
Schools grade is shown separately in the Schools card above.
Census & demographics
- Census place
- Casa Grande, AZ
- County
- Pinal County · 399,947 people
- City population
- 69,701
- Metro
- Phoenix-Mesa-Chandler, AZ
- Population (ZIP)
- 61,624
- Household income
- $68,443
- Rent vs Own
- Severe rent burden
- 1250.0
Population outlook (Pinal County) Hauer SSP2
- Today (2025)
- 437,574 people
- By 2030
- 446,903 · +2.1%
- By 2040
- 452,589 · +3.4%
- By 2050
- 444,126 · +1.5%
- By 2075
- 430,300 · -1.7%
- By 2100
- 393,536 · -10.1%
Race, ethnicity, and origin ACS 2023
- Neighborhood character
- Diverse neighborhood (Simpson 0.63)
- Race & ethnicity
- Hispanic / Latino 44% White 42% Two or more races 21% Black 4% Native American 4% Asian 1%
- Hispanic origin (detail)
- Mexican 40%
- Common ancestry
- Lithuanian 1% Slovak 1% Portuguese 1%
- Foreign-born
- 12% · Canada
- Languages at home
- 75% English-only · Spanish 23% Tagalog/Filipino 1% Other Indo-European 1%
Political lean MEDSL · Pinal
- 2024 margin
- Strong R (+22.1) · D 38.5% · R 60.6%
- 2008→2024 swing
- -7.6pp toward R · 2008: -14.5pp · 2024: -22.1pp
- All cycles
- 2024: R+22.1 2020: R+17.3 2016: R+19.3 2012: R+17.1 2008: R+14.5
Not yet ingested
- Civics
- —
Market trends
- HPI YoY
- ▼ -67.32%
- Current HPI
- 233.148
- Rent YoY
- ▲ 4.60%
- Metro
- Phoenix-Mesa-Chandler, AZ
- State GDP YoY
- ▲ 4.54%
- F500 in state
- 20
Industry mix (Fortune 500 HQ in AZ)
| Industry | F500 HQs | Revenue |
|---|---|---|
| Technology | 2 | $13B |
|
||
| Mining / Metals | 1 | $23B |
|
||
| Environmental Services | 1 | $16B |
|
||
| Metals / Steel | 1 | $14B |
|
||
| Technology Distribution | 1 | $9B |
|
||
| Homebuilding | 1 | $8B |
|
||
Cash-flow waterfall
monthlySold comps — $/sqft
last 12 mo · ≤1 miLoading sold comps…