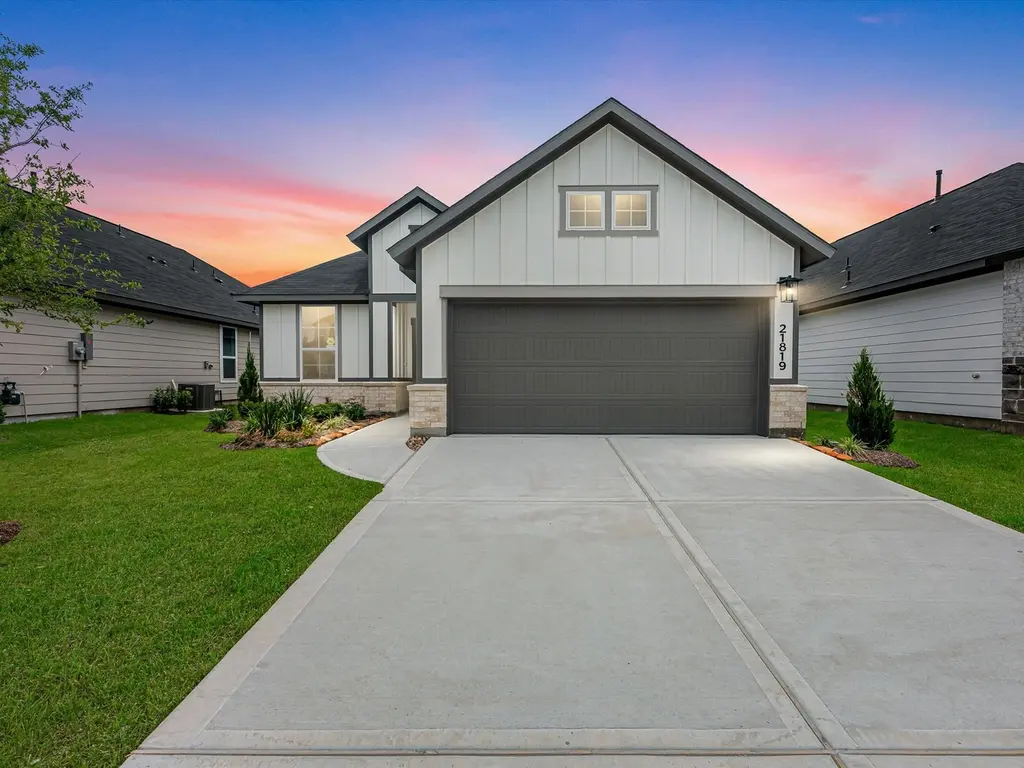
21819 Honey Scent Ln · Houston, TX
Flood risk 4/10 · Minor
- FEMA flood zone
- X (unshaded)
- Chance of flooding over 30 yrs
- 0.2%
- Est. flood insurance / yr
- $507 – $1,088
Fire risk 4/10 · Minor
- Est. fire insurance / yr
- $1,222 – $2,270
Heat risk 9/10 · Severe
- Hot days now (above 110°F)
- 7 days/yr
- Hot days in 30 yrs
- 22 days/yr
Wind risk 9/10 · Severe
- Chance of severe wind over 30 yrs
- 99.0%
Air-quality risk 2/10 · Minimal
- Unhealthy air days now
- 2 days/yr
- Unhealthy air days in 30 yrs
- 2 days/yr
Risk factors via First Street. Map © Google.
Why this score? — see what drove the D- grade
The composite is a weighted blend of 9 inputs, each scored 0–100. Each bar is that input's sub-score; the figure is the points it added to the 100-point composite (weight × sub-score).
- Cash flow +10.0/30.0
- ARV discount +9.4/15.0
- Schools +4.4/10.0
- Condition / age +4.0/5.0
- Livability +3.7/5.0
- 1% rule +3.3/10.0
- DSCR +2.9/10.0
- Rent growth +2.2/5.0
- Appreciation +0.0/10.0
$299,255
🖨 Deal sheet (PDF) 📄 Offer letter ✓ Due diligence
Listing remarks MLS
The Primrose Plan - This amazing one-story plan features an open-concept layout that flows seamlessly from the spacious foyer into the great room, home office, casual dining area, and gourmet kitchen. The kitchen boasts a GE 30" Free-Standing Gas Range, Groveland Poplar Grey Wolf cabinetry, Everest Mist granite countertops, and Mythology Santorini Picket Mosaic tile backsplash. Retreat to the primary suite, which includes a dual sink vanity and walk-in closet. Additional highlights include a covered patio, a convenient laundry room, and a 2-bay garage Mason Woods by Tri Pointe Homes is your oasis of luxury living and community. Amenities include a Recreation Center, Fitness Center, Resort-style pool, miles of trails, Central playgrounds, and sparkling lakes. Discover the perfect blend of comfort and convenience in this idyllic neighborhood setting.
Key facts
- 6,838 sq ft lot
- 2 garage spots
- Community pool
Neighborhood map
What this means for you Summary
Snapshot
- This is a 3-bed/2.0-bath single-family listed at $299k. Condition is rated good.
Deal economics
- At list price, monthly cash flow is $-180 ($-2k/yr) — negative.
- To cash-flow at today's rent, offer at most $273k (8.7% below list).
- To meet the 1% rule (rent ≥ 1% of price), the offer needs to be $248k (17.1% below list).
- Recommended offer: $248k (17.1% below list) — sets the bar for 1% rule.
- Cap rate 5.6% vs local median 3.2% in Houston — top-decile yield for the area; either an underpriced asset or a hidden risk that comps aren't pricing in. Stress-test before assuming the spread holds.
Location & tenants
- Location reads 74/100 on livability (#184 in TX, #4,771 nationally) — a middle-class / working-renter tenant base. Strengths: amenities A+, cost of living A+, housing A+; Watch: crime F.
- Cypress-Fairbanks ISD (suburban): math 45% / reading 52% proficiency, ranked #161 of 826 in TX (top 20%) — families likely to look elsewhere, expect single-tenant / working-renter base with shorter leases.
- Zoned schools: Postma El (math 45% / reading 59%, grade C-, #742 of 4,322 statewide, top 19%, 1,247 students, 45% FRL); Smith Middle (math 79% / reading 78%, grade A+, #19 of 1,662 statewide, top 1%, 2,057 students, 14% FRL); Cypress Springs H S (math 35% / reading 60%, grade D, #583 of 1,632 statewide, top 36%, 2,788 students, 68% FRL) — zoned schools at 42% FRL track the district average.
- Market conditions: Rents soft (-1.3%/yr); 2065 active listings in the ZIP; 16 comparable units currently listed for rent nearby; rentals lingering (median 45d on market — plan ~5-8 weeks vacancy on turnover, expect pricing pressure); 75% of comp listings sitting > 30 days — soft ceiling on asking rent; high-income renter base; 29,883 units permitted in Harris County in 2024 (8,621 in 5+ unit buildings).
Forward outlook
- Local home prices are declining (-3.0%/yr); year-one equity from $2k of loan paydown is wiped out by about $9k of value loss. Plan a longer hold.
- Harris County population projected at +47% by 2050 — long-run rental-demand tailwind backs the buy-and-hold thesis.
Negotiation context
- It's been on market 49 days — a 3% lower offer ($290k) is reasonable based on typical stale-listing flexibility.
Risks & watch-outs
- Climate carrying-cost: severe wind risk, 99% chance of damaging wind over 30y; extreme-heat days projected 7→22/yr by 2055 (HVAC capex compounding) — expect insurance premiums to compound above CPI over the hold.
Questions for the listing agent
- What do current leases actually rent for vs. the listed asking? Can we see a recent rent roll and the last 12 months of T-12 income?
- It's been on market 49 days. Have you received any prior offers? Is the seller open to a 17% concession, seller financing, or rate buy-down credit?
- What does the HOA fee cover, when was the last increase, and are there any pending special assessments or reserve-fund shortfalls?
- Is there a deadline driving the sale (1031 exchange, divorce, estate, relocation)? That informs how much negotiation room exists.
- Schools are D-rated, which usually means shorter tenancies and higher turnover. Who's the typical renter profile here, and what's been the actual vacancy rate?
- Crime grade is F in this area — have there been break-ins, vandalism, or insurance claims at this property in the last 3 years? What carrier currently insures it and at what premium?
- The area grade is low — what's the realistic commute time and amenity access for the typical tenant pool here? Any planned neighborhood developments (good or bad) we should know about?
- What's the average days-on-market for RENTAL listings here right now (not sales)? A rising rental-DOM trend means longer vacancies and softer asking-rent achievability than the comps imply.
- What's the recent tenant-quality profile in this submarket — average credit score on applications, eviction rate, late-payment / NSF rate, and stable-employment percentage? A property-management company in the area should have these aggregated.
- How much new for-sale + rental construction is in the pipeline within 1–3 miles? Heavy new supply typically softens prices + rents 12–24 months out; constrained supply supports both.
Investment metrics
- 1% rule
- 0.83% ✗
- Cap rate
- 5.57%
- Cash-on-cash
- -2.57%
- DSCR
- 0.89
- GRM
- 10.1
CMA / ARV
- ARV (median comp)
- $312,810
- List price
- $299,255
- Delta
- -4.33%
- Verdict
- FAIR
- Comps
- 20 within 1.0 mi
Show comp detail 12 sales within ~0.75 mi
| Address | Dist | Beds/Ba | Sqft | Sold | Price | $/sf | Match |
|---|---|---|---|---|---|---|---|
| 21822 Black Tulip Ln | 0.03mi | 3/2.0 | 1,631 (+2%) | 1mo | $309,605 | $190 | 95 |
| 7919 Sunny Lily Loop | 0.29mi | 3/2.0 | 1,622 (+1%) | 1mo | $319,925 | $197 | 83 |
| 7811 Summer Solstice St | 0.34mi | 3/2.0 | 1,612 (+1%) | 1mo | $331,190 | $205 | 82 |
| 21815 Coral Mist Dr | 0.11mi | 4/2.0 (+1) | 1,675 (+5%) | 1mo | $309,138 | $185 | 81 |
| 8218 Blue Shell Ln | 0.25mi | 3/2.0 | 1,673 (+4%) | 1mo | $340,990 | $204 | 80 |
| 8102 Magnolia Prairie Ln | 0.15mi | 4/2.0 (+1) | 1,675 (+5%) | 1mo | $324,890 | $194 | 79 |
| 8122 Kay Harbor Dr | 0.21mi | 4/2.0 (+1) | 1,744 (+9%) | 0mo | $346,990 | $199 | 70 |
| 21807 Honey Scent Ln | 0.03mi | 4/2.0 (+1) | 1,840 (+15%) | 1mo | $334,935 | $182 | 68 |
| 21815 White Bellflower Ln | 0.42mi | 3/2.0 | 1,479 (-8%) | 1mo | $275,000 | $186 | 67 |
| 8214 Blue Shell Ln | 0.25mi | 4/2.0 (+1) | 1,756 (+10%) | 1mo | $324,990 | $185 | 67 |
| 21330 Cypress River Oak Dr | 0.69mi | 3/2.0 | 1,740 (+9%) | 1mo | $274,000 | $157 | 52 |
| 7530 Primrose Myrtle Ln | 0.53mi | 4/2.5 (+1) | 1,825 (+14%) | 1mo | $312,845 | $171 | 44 |
Match score weights: distance 35% · size 25% · config 20% · recency 20%. Top-matched comps best support the ARV.
Projected returns pro-forma
-3.0% appreciation · 0.0% rent growth · sell at horizon
- IRR
- -24.1%
- Equity multiple
- 0.20×
- Total profit
- $-67,125
- Equity at exit
- $44,620
- IRR
- -31.6%
- Equity multiple
- -0.20×
- Total profit
- $-100,950
- Equity at exit
- $25,874
Cash invested: $83,791 (down + closing). Projections, not guarantees.
Landlord ↔ Tenant lean methodology
- Overall (STATE)
- 87 Strongly Landlord-Friendly
- State Texas
- 87 Strongly Landlord-Friendly · R+5
- County
- — inherits STATE
- City
- — inherits STATE
ZIP-level market 77433
- Home prices YoY
- -28.5%
- Rents YoY
- -1.3%
- Active inventory
- 2065
- Price-to-rent
- 10.1×
Monthly cashflow live
- Estimated rent
- $2,480 high interval (Pro) →
- Mortgage (P&I)
- −$1,569
- Tax est. 1.5%
- −$374 /mo · $4,489/yr
- Insurance
- −$125
- HOA
- −$71
- Vacancy / Maint / Mgmt
- −$521
- Net cashflow
- $-180
Break-even live
Sensitivity live
| Price | -10% $27 | -5% $-76 | +0% $-180 | +5% $-283 | +10% $-387 |
|---|---|---|---|---|---|
| Rent | -10% $-376 | -5% $-278 | +0% $-180 | +5% $-82 | +10% $16 |
| Rate | -1.0pp $-29 | -0.5pp $-104 | base $-180 | +0.5pp $-257 | +1.0pp $-336 |
UW: 25.0% down · 7.5% · 30yr · 1.5% tax · 5.0% vac · 8.0% maint · 8.0% mgmt
Financing live
Cash to close
- Down payment
- $74,814
- Closing costs
- $8,978
- Reserves months
- —
- Total cash needed
- —
Loan-product check · same deal, 3 products live
Conventional
25% down · 7.5% · 30yr
- Down + closing
- —
- Monthly P&I
- —
- Monthly cashflow
- —
- DSCR
- —
- Eligible?
- —
Personal DTI + credit; lowest rate.
DSCR
20% down · 8.5% · 30yr
- Down + closing
- —
- Monthly P&I
- —
- Monthly cashflow
- —
- DSCR
- —
- Eligible?
- —
No personal income docs; deal must DSCR.
Hard money
10% down · 12.0% · 12mo
- Down + closing
- —
- Monthly P&I
- —
- Monthly cashflow
- —
- DSCR
- —
- Eligible?
- —
Short-term bridge; refi at stabilization.
Rent comps 16 comps
| Address | Beds | Baths | Sqft | Rent | $/sqft | DOM | Units | Dist |
|---|---|---|---|---|---|---|---|---|
| 7911 Tuscan Cypress Dr Cypress, TX | 4.0 | 3.0 | 1730 | $2,475 | $1.43 | 45d | 1 | 0.46mi |
| 7558 Magnolia Orchid Ln Cypress, TX | 4.0 | 2.5 | 1743 | $2,390 | $1.37 | 45d | 1 | 0.51mi |
| 7546 Coral Terrace Dr Cypress, TX | 3.0 | 2.5 | 2050 | $2,699 | $1.32 | 45d | 1 | 0.75mi |
| 21114 Montego Bay Dr Cypress, TX | 3.0 | 2.5 | 2124 | $2,499 | $1.18 | 45d | 1 | 0.85mi |
| 21054 Montego Breeze Ln Cypress, TX | 3.0–5.0 | 2.0–3.5 | 1935 | $2,199 | $1.14 | 14d | 21 | 0.94mi |
| 21235 Catalina Palm Dr Cypress, TX | 4.0 | 2.0 | 1756 | $2,600 | $1.48 | 45d | 1 | 0.96mi |
| 21038 Treasure Gate Ln Cypress, TX | 4.0 | 2.5 | 1804 | $2,676 | $1.48 | 45d | 1 | 0.98mi |
| 21010 Treasure Gate Ln Cypress, TX | 4.0 | 2.0 | 2157 | $2,768 | $1.28 | 45d | 1 | 1.04mi |
| 22025 Avalon Landing Ln Cypress, TX | 1.0–3.0 | 1.0–2.0 | 954 | $2,663 | $2.79 | 0d | 12 | 1.09mi |
| 21447 FM 529 Rd Cypress, TX | 1.0–3.0 | 1.0–2.0 | 996 | $2,205 | $2.21 | 0d | 28 | 1.11mi |
| 21034 Shore Oak Dr Cypress, TX | 4.0 | 3.0 | 2110 | $2,950 | $1.40 | 45d | 1 | 1.11mi |
| 21038 Bay Village Dr Cypress, TX | 4.0 | 2.5 | 1904 | $2,491 | $1.31 | 45d | 1 | 1.14mi |
| 21054 Breezeway Cove Dr Bridgeland, TX | 3.0–4.0 | 2.5–3.5 | 1784 | $2,450 | $1.37 | 0d | 41 | 1.22mi |
| 7310 Coconut Bay Dr Cypress, TX | 4.0 | 2.0 | 1620 | $2,307 | $1.42 | 45d | 1 | 1.24mi |
| 21815 Sunshine Cove Ln Cypress, TX | 3.0 | 2.0 | 1780 | $2,650 | $1.49 | 45d | 1 | 1.39mi |
| 6747 Scarlet Sagebrush St Katy, TX | 3.0 | 2.0 | 1530 | $2,300 | $1.50 | 45d | 1 | 1.40mi |
HOA detail
- Monthly dues
- $71 · $852/yr
- Likely covers
- gaslandscapingpoolgym
Listing history 8 events
-
2026-06-08statusdays on market $299,255 Pending 49 DOM
-
2026-06-07days on market $299,255 Active 48 DOM
-
2026-06-04days on market $299,255 Active 45 DOM
-
2026-06-03days on market $299,255 Active 44 DOM
-
2026-06-02days on market $299,255 Active 43 DOM
-
2026-06-02days on market $299,255 Active 42 DOM
-
2026-05-31days on market $299,255 Active 41 DOM
-
2026-04-20$354,255 Active 866-char remark
Show marketing remark (866 chars)
The Primrose Plan - This amazing one-story plan features an open-concept layout that flows seamlessly from the spacious foyer into the great room, home office, casual dining area, and gourmet kitchen. The kitchen boasts a GE 30" Free-Standing Gas Range, Groveland Poplar Grey Wolf cabinetry, Everest Mist granite countertops, and Mythology Santorini Picket Mosaic tile backsplash. Retreat to the primary suite, which includes a dual sink vanity and walk-in closet. Additional highlights include a covered patio, a convenient laundry room, and a 2-bay garage Mason Woods by Tri Pointe Homes is your oasis of luxury living and community. Amenities include a Recreation Center, Fitness Center, Resort-style pool, miles of trails, Central playgrounds, and sparkling lakes. Discover the perfect blend of comfort and convenience in this idyllic neighborhood setting.
ⓘ Source: listings_history table (triggers on properties + properties_extension) + one-shot
backfill from property_details.listing_events for pre-trigger history.
Climate risk First Street
- Flood 4/10 Moderate FEMA zone X (unshaded) · 20% chance over 30 yrs
- Wildfire 4/10 Moderate
- Heat 9/10 Extreme 7 d/yr ≥110°F today · 22 d/yr by 30 yrs out
- Wind 9/10 Extreme 99% chance of damaging wind over 30 yrs
- Air quality 2/10 Low 2 unhealthy d/yr today · 2 by 30 yrs out
Nearby sold comps map
Loading sold comps map…
Walkable amenities ~0.75 mi
Loading nearby amenities…
Taxation est. · year 1
- Rental income
- $29,763
- − Mortgage interest
- −$16,763
- − Property taxes
- −$4,489
- − Insurance
- −$1,496
- − Repairs & maintenance
- −$2,381
- − Management
- −$2,381
- − HOA
- −$852
- − Depreciation
- −$8,706
- Taxable loss
- −$7,305
- Est. tax savings @ 24.0%
- +$1,753
- After-tax cash flow
- $-403/yr
For passive investors: Depreciation is non-cash, so a rental often shows a tax loss while cash-flowing — sheltering income. Rental losses are passive: they offset passive income freely, and up to $25,000/yr can offset ordinary (W-2) income if you actively participate and your MAGI is under $100k (phasing out to $0 by $150k); unused losses carry forward. On sale, claimed depreciation is recaptured at up to 25%, and gains may owe capital-gains tax (a 1031 exchange can defer both). Figures are a year-1 estimate at your 24.0% rate — not tax advice; consult a CPA.
Condition & rehab AI · 6 photos
This single-family home is in good condition with a modern kitchen and well-maintained exterior. It offers a good investment opportunity with potential for value enhancement through minor updates.
Value-add opportunities
- Resale Paint exterior siding — Enhances curb appeal and value.
- Resale Replace countertops — Modernizes the kitchen and adds value.
- Both Install smart home features — Improves convenience and marketability.
- Resale Landscaping improvements — Enhances curb appeal and value.
Renovation cost estimate screening
Value-add ROI direction
- Resale Paint exterior siding — Enhances curb appeal and value. ↑
- Resale Replace countertops — Modernizes the kitchen and adds value. ↑
- Both Install smart home features — Improves convenience and marketability. ↑
- Resale Landscaping improvements — Enhances curb appeal and value. ↑
ⓘ Cost ranges are severity-bucket heuristics (US national rule-of-thumb). Get contractor quotes + a written scope before underwriting a rehab budget.
Schools (NCES district)
- District
- Cypress-Fairbanks ISD
- NCES district ID
- 4816110
- Math proficiency
- 45% ▼ -12.00%
- Reading proficiency
- 52% ▼ -2.00%
- Median HH income
- $72,025
- Composite
- 43.63/100
- National rank
- #2968
- State rank
- #161 of 826 in TX
Livability — Houston
- Score
- 74/100
- State rank
- #184
- US rank
- #4771
Category grades
Schools grade is shown separately in the Schools card above.
Census & demographics
- County
- Harris County · 4,702,590 people
- City population
- 3,226,434
- Metro
- Houston-The Woodlands-Sugar Land, TX
- Population (ZIP)
- 116,550
- Household income
- $143,934
- Rent vs Own
- Severe rent burden
- 1700.0
Population outlook (Harris County) Hauer SSP2
- Today (2025)
- 5,571,493 people
- By 2030
- 6,089,821 · +9.3%
- By 2040
- 7,142,806 · +28.2%
- By 2050
- 8,185,864 · +46.9%
- By 2075
- 10,574,329 · +89.8%
- By 2100
- 12,109,958 · +117.4%
Race, ethnicity, and origin ACS 2023
- Neighborhood character
- Highly diverse neighborhood (Simpson 0.73)
- Race & ethnicity
- White 39% Hispanic / Latino 27% Black 17% Two or more races 14% Asian 13%
- Hispanic origin (detail)
- Mexican 16%
- Common ancestry
- Lithuanian 2% Romanian 1% Italian 1%
- Foreign-born
- 21% · Canada, Vietnam, China
- Languages at home
- 66% English-only · Spanish 19% Other Indo-European 4% Vietnamese 4%
Political lean MEDSL · Harris
- 2024 margin
- Lean D (+5.5) · D 52.0% · R 46.4% · Other 1.6%
- 2008→2024 swing
- +3.9pp toward D · 2008: 1.6pp · 2024: 5.5pp
- All cycles
- 2024: D+5.5 2020: D+13.3 2016: D+12.4 2012: D+0.1 2008: D+1.6
Not yet ingested
- Civics
- —
Market trends
- HPI YoY
- ▼ -87.83%
- Current HPI
- 220.2136
- Rent YoY
- ▼ -1.27%
- Metro
- Houston-The Woodlands-Sugar Land, TX
- State GDP YoY
- ▲ 3.95%
- F500 in state
- 110
Industry mix (Fortune 500 HQ in TX)
| Industry | F500 HQs | Revenue |
|---|---|---|
| Energy | 16 | $1,198B |
|
||
| Technology | 5 | $198B |
|
||
| Engineering / Construction | 4 | $72B |
|
||
| Energy Services | 3 | $60B |
|
||
| Utilities | 3 | $41B |
|
||
| Healthcare | 2 | $330B |
|
||
Price history
1 event — show timeline
- 2026-04-20 Listed $354,255 HARMLS
Cash-flow waterfall
monthlySold comps — $/sqft
last 12 mo · ≤1 miLoading sold comps…