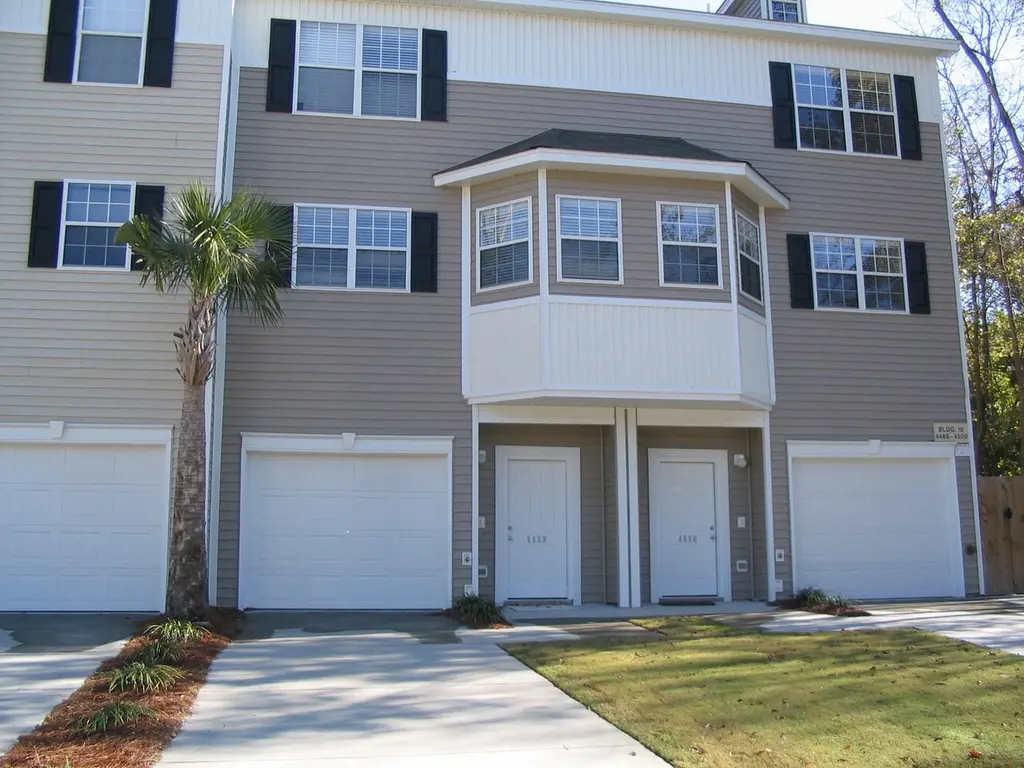
4488 Great Oak Dr Unit 10-G · North Charleston, SC
Flood risk 1/10 · Minimal
- FEMA flood zone
- X (shaded)
- Chance of flooding over 30 yrs
- 0.0%
- Est. flood insurance / yr
- $507 – $1,088
Fire risk 2/10 · Minimal
- Est. fire insurance / yr
- $783 – $1,453
Heat risk 9/10 · Severe
- Hot days now (above 106°F)
- 7 days/yr
- Hot days in 30 yrs
- 18 days/yr
Wind risk 8/10 · Major
- Chance of severe wind over 30 yrs
- 99.0%
Air-quality risk 2/10 · Minimal
- Unhealthy air days now
- 2 days/yr
- Unhealthy air days in 30 yrs
- 2 days/yr
Risk factors via First Street. Map © Google.
Why this score? — see what drove the D+ grade
The composite is a weighted blend of 9 inputs, each scored 0–100. Each bar is that input's sub-score; the figure is the points it added to the 100-point composite (weight × sub-score).
- ARV discount +15.0/15.0
- Cash flow +11.5/30.0
- 1% rule +5.6/10.0
- Schools +4.3/10.0
- DSCR +3.4/10.0
- Livability +3.3/5.0
- Rent growth +3.1/5.0
- Condition / age +2.5/5.0
- Appreciation +0.0/10.0
$190,000
🖨 Deal sheet (PDF) 📄 Offer letter ✓ Due diligence
Listing remarks MLS
THREE STORY 2BR.(OPTION 3BR.) TOWNHOMES WITH DOUBLE DECKS AND COVERED PATIO. OPEN FLOOR PLAN W/ 9' SMOOTH CIELINGS. TOWNHOME BACKED TO POND AND 2 MINUTE WALK TO RIVERS EDGE. AMENITIES: DEEP WATER ACCESS, BOAT RAMP, DOCK, POOL, CLUBHOUSE!
Key facts
- $335 HOA
- Garage
- Built 2005
Neighborhood map
What this means for you Summary
Snapshot
- This is a 2-bed/2.5-bath townhouse listed at $190k.
Deal economics
- At list price, monthly cash flow is $-61 ($-735/yr) — negative.
- To cash-flow at today's rent, offer at most $181k (4.7% below list).
- Meets the 1% rule at list price ($2k rent vs $190k).
- Recommended offer: $181k (4.7% below list) — sets the bar for cash-flow.
- Cap rate 5.9% vs local median 4.0% in North Charleston — top-decile yield for the area; either an underpriced asset or a hidden risk that comps aren't pricing in. Stress-test before assuming the spread holds.
Location & tenants
- Location reads 66/100 on livability (#122 in SC) — a middle-class / working-renter tenant base. Strengths: housing A+, health & safety A+, cost of living A; Watch: employment C-, crime F, amenities F.
- Charleston 01 (urban): math 48% / reading 53% proficiency, ranked #7 of 80 in SC (top 9%) — acceptable for families but not a draw, mixed tenant base, ~2y average lease.
- Zoned schools: Hunley Park Elementary (math 27% / reading 27%, grade F, #421 of 597 statewide, top 73%, 410 students, 100% FRL); Jerry Zucker Middle School of Science (math 8% / reading 17%, grade F, #213 of 229 statewide, top 94%, 524 students, 100% FRL); North Charleston High (math 27% / reading 57%, grade F, #174 of 196 statewide, top 90%, 768 students, 100% FRL) — zoned schools average 100% FRL vs 44% district-wide (56 pts higher); higher-poverty schools than district average — tighter screening recommended.
- Zoned-school proficiency averages 27% at this address vs 50% district-wide (-23 pts) — the specific schools serving this property underperform the Charleston 01 average; the district grade overstates school quality for this exact location.
- Market conditions: Rents rising (+2.3%/yr); 99 active listings in the ZIP; 13 comparable units currently listed for rent nearby; rentals at typical pace (median 25d on market — plan ~3-4 weeks tenant-placement turnaround); 4,156 units permitted in Charleston County in 2024 (857 in 5+ unit buildings).
- This rent runs 37% of the median local income ($65k/yr) — at the standard rent-burdened threshold; future hikes will face affordability resistance.
Forward outlook
- Local home prices are declining (-3.0%/yr); year-one equity from $1k of loan paydown is wiped out by about $6k of value loss. Plan a longer hold.
- Charleston County population projected at +44% by 2050 — long-run rental-demand tailwind backs the buy-and-hold thesis.
Negotiation context
- Only 0 days on market — expect competitive offers; lowballing is unlikely to land.
- 2 sale attempts since 22y ago with the ask held roughly flat each time — persistent listings suggest the price (not the market) is what's stuck; bring a comps-based counter.
- Current owner paid $149k; 28% above their basis — modest negotiation headroom, anchor on the comps not their cost.
Risks & watch-outs
- Climate carrying-cost: severe wind risk, 99% chance of damaging wind over 30y; extreme-heat days projected 7→18/yr by 2055 (HVAC capex compounding) — expect insurance premiums to compound above CPI over the hold.
Questions for the listing agent
- What do current leases actually rent for vs. the listed asking? Can we see a recent rent roll and the last 12 months of T-12 income?
- What does the HOA fee cover, when was the last increase, and are there any pending special assessments or reserve-fund shortfalls?
- Is there a deadline driving the sale (1031 exchange, divorce, estate, relocation)? That informs how much negotiation room exists.
- Crime grade is F in this area — have there been break-ins, vandalism, or insurance claims at this property in the last 3 years? What carrier currently insures it and at what premium?
- The area grade is low — what's the realistic commute time and amenity access for the typical tenant pool here? Any planned neighborhood developments (good or bad) we should know about?
- What's the average days-on-market for RENTAL listings here right now (not sales)? A rising rental-DOM trend means longer vacancies and softer asking-rent achievability than the comps imply.
- What's the recent tenant-quality profile in this submarket — average credit score on applications, eviction rate, late-payment / NSF rate, and stable-employment percentage? A property-management company in the area should have these aggregated.
- How much new for-sale + rental construction is in the pipeline within 1–3 miles? Heavy new supply typically softens prices + rents 12–24 months out; constrained supply supports both.
Investment metrics
- 1% rule
- 1.06% ✓
- Cap rate
- 5.91%
- Cash-on-cash
- -1.38%
- DSCR
- 0.94
- GRM
- 7.9
CMA / ARV
- ARV (on-the-fly)
- $279,212
- Comps found
- 12
Show comp detail 12 sales within ~0.75 mi
| Address | Dist | Beds/Ba | Sqft | Sold | Price | $/sf | Match |
|---|---|---|---|---|---|---|---|
| 4488 Great Oak Dr Unit 10-G | 0.00mi | 2/2.5 | 1,682 (0%) | 0mo | $175,000 | $104 | 100 |
| 4543 Great Oak Dr | 0.08mi | 2/2.5 | 1,682 (0%) | 5mo | $240,000 | $143 | 92 |
| 4509 Great Oak Dr | 0.05mi | 2/2.5 | 1,615 (-4%) | 4mo | $272,000 | $168 | 88 |
| 4666 Palm View Cir | 0.12mi | 2/2.5 | 1,704 (+1%) | 14mo | $289,000 | $170 | 80 |
| 4692 Palm View Cir | 0.10mi | 3/2.5 (+1) | 1,586 (-6%) | 1mo | $285,000 | $180 | 80 |
| 4654 Palm View Cir | 0.14mi | 2/2.5 | 1,810 (+8%) | 4mo | $267,500 | $148 | 77 |
| 4538 Great Oak Dr Unit 4d | 0.07mi | 3/2.5 (+1) | 1,628 (-3%) | 15mo | $270,000 | $166 | 74 |
| 4671 Palm View Cir | 0.13mi | 3/2.5 (+1) | 1,536 (-9%) | 3mo | $267,000 | $174 | 72 |
| 4669 Palm View Cir | 0.09mi | 3/2.5 (+1) | 1,536 (-9%) | 9mo | $250,000 | $163 | 69 |
| 4636 Palm View Cir | 0.16mi | 3/3.5 (+1) | 1,810 (+8%) | 4mo | $292,900 | $162 | 68 |
| 4630 Palm View Cir | 0.15mi | 3/2.5 (+1) | 1,818 (+8%) | 11mo | $290,000 | $160 | 66 |
| 4678 Palm View Cir | 0.10mi | 3/2.5 (+1) | 1,473 (-12%) | 13mo | $290,000 | $197 | 59 |
Match score weights: distance 35% · size 25% · config 20% · recency 20%. Top-matched comps best support the ARV.
Projected returns pro-forma
-3.0% appreciation · 2.26% rent growth · sell at horizon
- IRR
- -19.5%
- Equity multiple
- 0.32×
- Total profit
- $-35,936
- Equity at exit
- $28,330
- IRR
- -13.9%
- Equity multiple
- 0.22×
- Total profit
- $-41,356
- Equity at exit
- $16,428
Cash invested: $53,200 (down + closing). Projections, not guarantees.
Landlord ↔ Tenant lean methodology
- Overall (STATE)
- 90 Strongly Landlord-Friendly
- State South Carolina
- 90 Strongly Landlord-Friendly · R+6
- County
- — inherits STATE
- City
- — inherits STATE
ZIP-level market 29418
- Home prices YoY
- -18.1%
- Rents YoY
- 2.3%
- Active inventory
- 99
- Price-to-rent
- 7.9×
Monthly cashflow live
- Estimated rent
- $2,009 high interval (Pro) →
- Mortgage (P&I)
- −$996
- Tax est. 1.5%
- −$238 /mo · $2,850/yr
- Insurance
- −$79
- HOA
- −$335
- Vacancy / Maint / Mgmt
- −$422
- Net cashflow
- $-61
Break-even live
Sensitivity live
| Price | -10% $70 | -5% $4 | +0% $-61 | +5% $-127 | +10% $-193 |
|---|---|---|---|---|---|
| Rent | -10% $-220 | -5% $-141 | +0% $-61 | +5% $18 | +10% $97 |
| Rate | -1.0pp $34 | -0.5pp $-13 | base $-61 | +0.5pp $-110 | +1.0pp $-161 |
UW: 25.0% down · 7.5% · 30yr · 1.5% tax · 5.0% vac · 8.0% maint · 8.0% mgmt
Financing live
Cash to close
- Down payment
- $47,500
- Closing costs
- $5,700
- Reserves months
- —
- Total cash needed
- —
Loan-product check · same deal, 3 products live
Conventional
25% down · 7.5% · 30yr
- Down + closing
- —
- Monthly P&I
- —
- Monthly cashflow
- —
- DSCR
- —
- Eligible?
- —
Personal DTI + credit; lowest rate.
DSCR
20% down · 8.5% · 30yr
- Down + closing
- —
- Monthly P&I
- —
- Monthly cashflow
- —
- DSCR
- —
- Eligible?
- —
No personal income docs; deal must DSCR.
Hard money
10% down · 12.0% · 12mo
- Down + closing
- —
- Monthly P&I
- —
- Monthly cashflow
- —
- DSCR
- —
- Eligible?
- —
Short-term bridge; refi at stabilization.
Rent comps 13 comps
| Address | Beds | Baths | Sqft | Rent | $/sqft | DOM | Units | Dist |
|---|---|---|---|---|---|---|---|---|
| 4492 Great Oak Dr Unit 1 North Charleston, SC | 3.0 | 2.5 | 1976 | $2,100 | $1.06 | 16d | 1 | 0.02mi |
| 4370 Great Oak DR , SC | 3.0 | 1.5 | 1156 | $1,650 | $1.43 | 25d | 1 | 0.10mi |
| 4589 Palm View Cir North Charleston, SC | 3.0 | 2.5 | 1596 | $2,500 | $1.57 | 12d | 1 | 0.11mi |
| 4668 Palm View Cir North Charleston, SC | 3.0 | 2.5 | 1810 | $2,250 | $1.24 | 4d | 1 | 0.13mi |
| 4356 Cheviot Dr North Charleston, SC | 3.0 | 2.0 | 1699 | $2,295 | $1.35 | 25d | 1 | 0.37mi |
| 6520 Dorchester Rd North Charleston, SC | 2.0–3.0 | 1.0–2.0 | 1010 | $1,200 | $1.19 | 25d | 9 | 0.48mi |
| 4775 Apartment Blvd North Charleston, SC | 2.0–3.0 | 1.0–1.5 | 1025 | $1,595 | $1.56 | 4d | 3 | 0.67mi |
| 4791 Apartment Blvd North Charleston, SC | 2.0–3.0 | 1.5 | 1250 | $1,200 | $0.96 | 25d | 1 | 0.82mi |
| 4211 Britain Ct North Charleston, SC | 2.0–3.0 | 1.5–2.5 | 1355 | $1,695 | $1.25 | 13d | 4 | 0.92mi |
| 5581 Fowler Dr North Charleston, SC | 3.0 | 1.5 | 1370 | $1,800 | $1.31 | 25d | 1 | 1.09mi |
| 4371 Purdue Dr North Charleston, SC | 3.0 | 1.5 | 1185 | $1,800 | $1.52 | 25d | 1 | 1.15mi |
| 4305 Bream Rd North Charleston, SC | 2.0–3.0 | 1.5 | 1006 | $1,150 | $1.14 | 25d | 4 | 1.27mi |
| 123 Toura Ln Charleston, SC | 3.0 | 2.0 | 1580 | $2,500 | $1.58 | 16d | 1 | 1.37mi |
HOA detail
- Monthly dues
- $335 · $4,020/yr
- Likely covers
- waterpool
Listing history 4 events
-
2026-04-17historical
-
2026-04-16$190,000
-
2005-01-25soldstatus $148,900 237-char remark
Show marketing remark (237 chars)
THREE STORY 2BR.(OPTION 3BR.) TOWNHOMES WITH DOUBLE DECKS AND COVERED PATIO. OPEN FLOOR PLAN W/ 9' SMOOTH CIELINGS. TOWNHOME BACKED TO POND AND 2 MINUTE WALK TO RIVERS EDGE. AMENITIES: DEEP WATER ACCESS, BOAT RAMP, DOCK, POOL, CLUBHOUSE!
-
2004-10-26$148,900 237-char remark
Show marketing remark (237 chars)
THREE STORY 2BR.(OPTION 3BR.) TOWNHOMES WITH DOUBLE DECKS AND COVERED PATIO. OPEN FLOOR PLAN W/ 9' SMOOTH CIELINGS. TOWNHOME BACKED TO POND AND 2 MINUTE WALK TO RIVERS EDGE. AMENITIES: DEEP WATER ACCESS, BOAT RAMP, DOCK, POOL, CLUBHOUSE!
ⓘ Source: listings_history table (triggers on properties + properties_extension) + one-shot
backfill from property_details.listing_events for pre-trigger history.
Climate risk First Street
- Flood 1/10 Low FEMA zone X (shaded) · 0% chance over 30 yrs
- Wildfire 2/10 Low
- Heat 9/10 Extreme 7 d/yr ≥106°F today · 18 d/yr by 30 yrs out
- Wind 8/10 Severe 99% chance of damaging wind over 30 yrs
- Air quality 2/10 Low 2 unhealthy d/yr today · 2 by 30 yrs out
Nearby sold comps map
Loading sold comps map…
Walkable amenities ~0.75 mi
Loading nearby amenities…
Taxation est. · year 1
- Rental income
- $24,104
- − Mortgage interest
- −$10,643
- − Property taxes
- −$2,850
- − Insurance
- −$950
- − Repairs & maintenance
- −$1,928
- − Management
- −$1,928
- − HOA
- −$4,020
- − Depreciation
- −$5,527
- Taxable loss
- −$3,743
- Est. tax savings @ 24.0%
- +$898
- After-tax cash flow
- $164/yr
For passive investors: Depreciation is non-cash, so a rental often shows a tax loss while cash-flowing — sheltering income. Rental losses are passive: they offset passive income freely, and up to $25,000/yr can offset ordinary (W-2) income if you actively participate and your MAGI is under $100k (phasing out to $0 by $150k); unused losses carry forward. On sale, claimed depreciation is recaptured at up to 25%, and gains may owe capital-gains tax (a 1031 exchange can defer both). Figures are a year-1 estimate at your 24.0% rate — not tax advice; consult a CPA.
Schools (NCES district)
- District
- Charleston 01
- NCES district ID
- 4501440
- Math proficiency
- 48% ▼ -2.00%
- Reading proficiency
- 53% ▬ 0.00%
- Median HH income
- $52,376
- Composite
- 43.41/100
- National rank
- #3018
- State rank
- #7 of 80 in SC
Livability — North Charleston
- Score
- 66/100
- State rank
- #122
- US rank
- #12222
Category grades
Schools grade is shown separately in the Schools card above.
Census & demographics
- Census place
- North Charleston, SC
- County
- Charleston County · 366,793 people
- City population
- 108,266
- Metro
- Charleston-North Charleston, SC
- Population (ZIP)
- 26,052
- Household income
- $64,583
- Rent vs Own
- Severe rent burden
- 647.0
Population outlook (Charleston County) Hauer SSP2
- Today (2025)
- 480,562 people
- By 2030
- 525,921 · +9.4%
- By 2040
- 612,189 · +27.4%
- By 2050
- 691,627 · +43.9%
- By 2075
- 847,979 · +76.5%
- By 2100
- 926,482 · +92.8%
Race, ethnicity, and origin ACS 2023
- Neighborhood character
- Diverse neighborhood (Simpson 0.65)
- Race & ethnicity
- Black 48% White 32% Hispanic / Latino 16% Two or more races 4% Asian 2%
- Hispanic origin (detail)
- Mexican 10%
- Common ancestry
- Lithuanian 1% Romanian 1% Slovak 1%
- Foreign-born
- 14% · Canada, Jamaica, China
- Languages at home
- 83% English-only · Spanish 13% Vietnamese 1%
Political lean MEDSL · Charleston
- 2024 margin
- Lean D (+5.7) · D 51.9% · R 46.3% · Other 1.8%
- 2008→2024 swing
- -2.7pp toward R · 2008: 8.3pp · 2024: 5.7pp
- All cycles
- 2024: D+5.7 2020: D+12.9 2016: D+7.9 2012: D+2.4 2008: D+8.3
Not yet ingested
- Civics
- —
Market trends
- HPI YoY
- ▼ -64.59%
- Current HPI
- 293.0402
- Rent YoY
- ▲ 2.26%
- Metro
- Charleston-North Charleston, SC
- State GDP YoY
- ▲ 4.51%
- F500 in state
- 2
Industry mix (Fortune 500 HQ in SC)
| Industry | F500 HQs | Revenue |
|---|---|---|
| Packaging | 1 | $7B |
|
||
Price history
+27.6% since first listed4 events — show timeline
- 2026-04-17 Listing Removed — Charleston Trident MLS
- 2026-04-16 Listed $190,000 Charleston Trident MLS
- 2005-01-25 Sold (MLS) $148,900 Charleston Trident MLS
- 2004-10-26 Listed $148,900 Charleston Trident MLS
Cash-flow waterfall
monthlySold comps — $/sqft
last 12 mo · ≤1 miLoading sold comps…