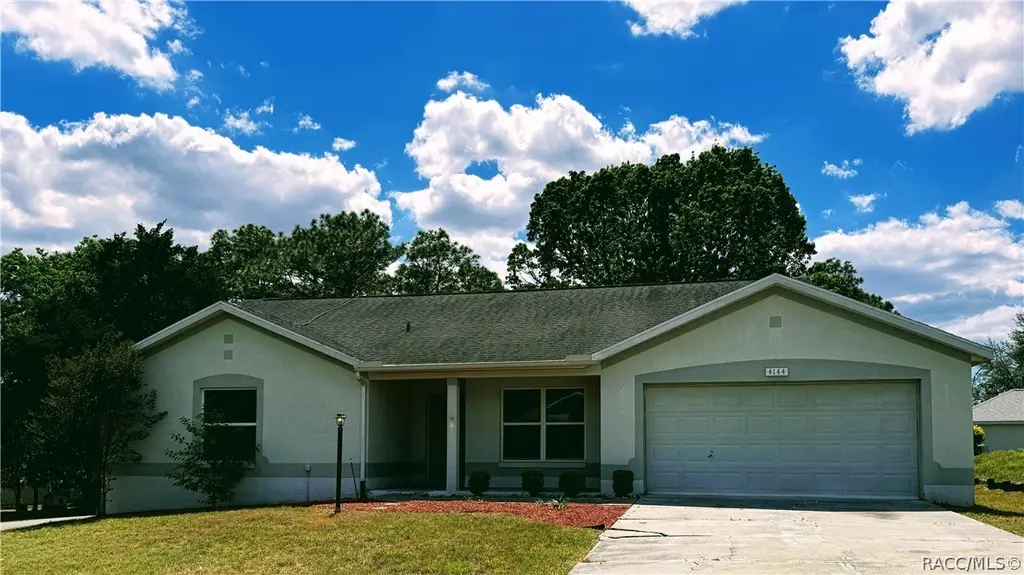
4144 N Mae West Way · Beverly Hills, FL
Flood risk 1/10 · Minimal
- FEMA flood zone
- X (unshaded)
- Chance of flooding over 30 yrs
- 0.0%
- Est. flood insurance / yr
- $507 – $1,088
Fire risk 5/10 · Moderate
- Est. fire insurance / yr
- $947 – $1,759
Heat risk 9/10 · Severe
- Hot days now (above 108°F)
- 7 days/yr
- Hot days in 30 yrs
- 24 days/yr
Wind risk 9/10 · Severe
- Chance of severe wind over 30 yrs
- 99.0%
Air-quality risk 1/10 · Minimal
- Unhealthy air days now
- 0 days/yr
- Unhealthy air days in 30 yrs
- 0 days/yr
Risk factors via First Street. Map © Google.
Why this score? — see what drove the C grade
The composite is a weighted blend of 9 inputs, each scored 0–100. Each bar is that input's sub-score; the figure is the points it added to the 100-point composite (weight × sub-score).
- Cash flow +18.8/30.0
- ARV discount +15.0/15.0
- DSCR +5.9/10.0
- 1% rule +5.5/10.0
- Schools +4.1/10.0
- Livability +3.2/5.0
- Rent growth +2.5/5.0
- Condition / age +2.5/5.0
- Appreciation +0.0/10.0
$164,900
🖨 Deal sheet 📄 Offer letter ✓ Due diligence
Listing remarks MLS
BEAUTIFUL, WELL MAINTAINED, 3 BDRM, 2 BATH, 2 CAR GARAGE WITH REAR WOODEN DECK, REAR FENCED(CHAIN LINK) YARD ON CORNER LOT, CATHEDRIAL & STANDARD CEILINGS, BREAKFAST BAR & EAT IN KITCHEN NOOK, HUGE WALK-IN CLOSET IN MAIN BATH; BEAUTIFUL LANDSCAPING, , 2-CAR GARAGE WITH OPENER; NEWER TILE & CARPET & VINYL(WOOD LIKE) FLOORING; FORMAL DINING ROOM, REAR DECK(2010) 10X14; NEW ROOF IN 2015
Key facts
- Corner lot home
- Usable outdoor space
- Mature landscaping
Tags
Property features AI
Finance
- Other: Located in Oakwood Village subdivision; Topography: hill; Zoning: PDR
- HOA & community: Homeowners association with an annual fee of $75 (about $6.25/month)
Exterior
- Parking: Attached 2-car garage; Concrete paved driveway; Garage with door opener
- Utilities: Public water; Public sewer
- Home design: Single family residence; Residential property
- Construction: Block, concrete and stucco construction; Block and slab foundation
- Exterior features: Asphalt shingle roof; Rolling/sloped rectangular lot; Paved road frontage on a county road
Interior
- Kitchen: Dishwasher; Electric cooktop; Microwave; Oven; Range; Refrigerator
- Flooring: Carpet; Tile; Vinyl
- Bathrooms: 2 full bathrooms
- Heating & cooling: Central heating (electric); Central air conditioning (electric)
- Interior features: Dishwasher; Electric cooktop; Microwave; Oven; Range; Refrigerator; Water heater
- Laundry & utility: Water heater
Neighborhood map
What this means for you Summary
Snapshot
- This is a 3-bed/2.0-bath single-family listed at $165k.
Deal economics
- At list price, monthly cash flow is $165 ($2k/yr) — positive.
- The deal already cash-flows at list — no discount required.
- Meets the 1% rule at list price ($2k rent vs $165k).
- Recommended offer: $162k (1.5% below list) — sets the bar for market timing.
- Cap rate 7.5% vs local median 5.8% in Beverly Hills — meaningfully above typical; check what's discounted (condition, days-on-market, listing class) to confirm the premium yield is real.
Location & tenants
- Location reads 64/100 on livability (#666 in FL) — a middle-class / working-renter tenant base. Strengths: cost of living A+, housing A+, health & safety A+; Watch: amenities F, commute F, employment F.
- Citrus (rural): math 49% / reading 50% proficiency, ranked #44 of 73 in FL (top 60%) — families likely to look elsewhere, expect single-tenant / working-renter base with shorter leases.
- Zoned schools: Forest Ridge Elementary School (math 55% / reading 59%, grade C+, #781 of 2,144 statewide, top 38%, 708 students, 67% FRL); Lecanto Middle School (math 49% / reading 49%, grade C-, #265 of 571 statewide, top 48%, 809 students, 55% FRL); Lecanto High School (math 46% / reading 53%, grade D, #179 of 667 statewide, top 29%, 1,630 students, 46% FRL) — zoned schools at 56% FRL track the district average.
- Market conditions: 396 active listings in the ZIP; 18 comparable units currently listed for rent nearby; rentals at typical pace (median 21d on market — plan ~3-4 weeks tenant-placement turnaround); 2,443 units permitted in Citrus County in 2024 (0 in 5+ unit buildings).
- This rent runs 38% of the median local income ($55k/yr) — at the standard rent-burdened threshold; future hikes will face affordability resistance.
Forward outlook
- Local home prices are declining (-3.0%/yr); year-one equity from $1k of loan paydown is wiped out by about $5k of value loss. Plan a longer hold.
- Citrus County population projected to shrink 10% by 2050 — rents likely to lag national; underwrite the cash flow, not the appreciation.
Negotiation context
- It's been on market 20 days — a 2% lower offer ($162k) is reasonable based on typical stale-listing flexibility.
- 6 sale attempts since 25y ago with the ask held roughly flat each time — persistent listings suggest the price (not the market) is what's stuck; bring a comps-based counter.
- Current owner paid $122k; 35% above their basis — modest negotiation headroom, anchor on the comps not their cost.
Risks & watch-outs
- Climate carrying-cost: severe wind risk, 99% chance of damaging wind over 30y; moderate wildfire risk; extreme-heat days projected 7→24/yr by 2055 (HVAC capex compounding) — expect insurance premiums to compound above CPI over the hold.
Questions for the listing agent
- What does the HOA fee cover, when was the last increase, and are there any pending special assessments or reserve-fund shortfalls?
- Is there a deadline driving the sale (1031 exchange, divorce, estate, relocation)? That informs how much negotiation room exists.
- Schools are F-rated, which usually means shorter tenancies and higher turnover. Who's the typical renter profile here, and what's been the actual vacancy rate?
- What's the average days-on-market for RENTAL listings here right now (not sales)? A rising rental-DOM trend means longer vacancies and softer asking-rent achievability than the comps imply.
- What's the recent tenant-quality profile in this submarket — average credit score on applications, eviction rate, late-payment / NSF rate, and stable-employment percentage? A property-management company in the area should have these aggregated.
- How much new for-sale + rental construction is in the pipeline within 1–3 miles? Heavy new supply typically softens prices + rents 12–24 months out; constrained supply supports both.
Investment metrics
- 1% rule
- 1.05% ✓
- Cap rate
- 7.49%
- Cash-on-cash
- 4.29%
- DSCR
- 1.19
- GRM
- 8.0
CMA / ARV
- ARV (on-the-fly)
- $241,224
- Comps found
- 12
Show comp detail 12 sales within ~0.75 mi
| Address | Dist | Beds/Ba | Sqft | Sold | Price | $/sf | Match |
|---|---|---|---|---|---|---|---|
| 3939 N Blazingstar Way | 0.40mi | 3/2.0 | 1,580 (-0%) | 1mo | $230,000 | $146 | 80 |
| 4291 N Lincoln Ave | 0.25mi | 3/2.0 | 1,513 (-5%) | 4mo | $214,000 | $141 | 77 |
| 588 W Hillwood Path | 0.47mi | 3/2.0 | 1,581 (-0%) | 3mo | $240,000 | $152 | 75 |
| 4298 N Brynner Pass Ter | 0.24mi | 3/2.0 | 1,724 (+9%) | 2mo | $269,000 | $156 | 73 |
| 4385 N Bacall Loop | 0.31mi | 2/2.0 (-1) | 1,489 (-6%) | 2mo | $228,000 | $153 | 68 |
| 4301 N Bacall Loop | 0.44mi | 3/2.0 | 1,742 (+10%) | 4mo | $245,000 | $141 | 60 |
| 23 N Tyler St | 0.44mi | 2/2.0 (-1) | 1,464 (-8%) | 4mo | $149,900 | $102 | 58 |
| 931 W Starjasmine Pl | 0.40mi | 2/2.0 (-1) | 1,740 (+10%) | 6mo | $215,000 | $124 | 55 |
| 602 W Player Path | 0.35mi | 2/2.0 (-1) | 1,389 (-12%) | 5mo | $215,000 | $155 | 54 |
| 3861 N Tamarisk Ave | 0.60mi | 2/2.0 (-1) | 1,675 (+6%) | 5mo | $165,000 | $99 | 54 |
| 3525 N Burroughs Path | 0.62mi | 3/2.0 | 1,388 (-12%) | 3mo | $223,500 | $161 | 48 |
| 582 W Hillwood Path | 0.49mi | 2/2.0 (-1) | 1,401 (-12%) | 7mo | $219,000 | $156 | 47 |
Match score weights: distance 35% · size 25% · config 20% · recency 20%. Top-matched comps best support the ARV.
Projected returns pro-forma
-3.0% appreciation · 3.0% rent growth · sell at horizon
- IRR
- -9.6%
- Equity multiple
- 0.65×
- Total profit
- $-16,157
- Equity at exit
- $24,587
- IRR
- -0.1%
- Equity multiple
- 0.99×
- Total profit
- $-296
- Equity at exit
- $14,258
Cash invested: $46,172 (down + closing). Projections, not guarantees.
Landlord ↔ Tenant lean methodology
- Overall (STATE)
- 87 Strongly Landlord-Friendly
- State Florida
- 87 Strongly Landlord-Friendly · R+3
- County
- — inherits STATE
- City
- — inherits STATE
ZIP-level market 34465
- Home prices YoY
- -33.1%
- Active inventory
- 396
- Price-to-rent
- 8.0×
Monthly cashflow live
- Estimated rent
- $1,725 high interval (Pro) →
- Mortgage (P&I)
- −$865
- Tax from tax record
- −$258 /mo · $3,098/yr
- Insurance
- −$69
- HOA
- −$6
- Vacancy / Maint / Mgmt
- −$362
- Net cashflow
- $165
Break-even live
UW: 25.0% down · 7.5% · 30yr · 1.5% tax · 5.0% vac · 8.0% maint · 8.0% mgmt
Financing live
Cash to close
- Down payment
- $41,225
- Closing costs
- $4,947
- Reserves months
- —
- Total cash needed
- —
Loan-product check · same deal, 3 products live
Conventional
25% down · 7.5% · 30yr
- Down + closing
- —
- Monthly P&I
- —
- Monthly cashflow
- —
- DSCR
- —
- Eligible?
- —
Personal DTI + credit; lowest rate.
DSCR
20% down · 8.5% · 30yr
- Down + closing
- —
- Monthly P&I
- —
- Monthly cashflow
- —
- DSCR
- —
- Eligible?
- —
No personal income docs; deal must DSCR.
Hard money
10% down · 12.0% · 12mo
- Down + closing
- —
- Monthly P&I
- —
- Monthly cashflow
- —
- DSCR
- —
- Eligible?
- —
Short-term bridge; refi at stabilization.
Rent comps 18 comps
| Address | Beds | Baths | Sqft | Rent | $/sqft | DOM | Units | Dist |
|---|---|---|---|---|---|---|---|---|
| 23 N Lee St Beverly Hills, FL | 2.0 | 1.0 | 1416 | $1,350 | $0.95 | 21d | 1 | 0.31mi |
| 17 N Davis St Beverly Hills, FL | 2.0 | 1.0 | 1108 | $1,000 | $0.90 | 21d | 1 | 0.32mi |
| 665 W Sunset Strip Dr Beverly Hills, FL | 3.0 | 2.0 | 2038 | $2,200 | $1.08 | 21d | 1 | 0.32mi |
| 3660 N Laurelwood Loop Beverly Hills, FL | 2.0 | 2.5 | 1543 | $1,800 | $1.17 | 21d | 1 | 0.49mi |
| 262 W Romany Loop Beverly Hills, FL | 2.0 | 2.0 | 1981 | $2,750 | $1.39 | 21d | 1 | 0.68mi |
| 661 W Twisted Oaks Dr Beverly Hills, FL | 4.0 | 2.0 | 1864 | $1,695 | $0.91 | 21d | 1 | 0.79mi |
| 3442 N Tamarisk Ave Unit NA Beverly Hills, FL | 3.0 | 2.0 | 1530 | $1,800 | $1.18 | 21d | 1 | 0.84mi |
| 174 W Romany Loop Beverly Hills, FL | 2.0 | 2.0 | 1748 | $2,200 | $1.26 | 21d | 1 | 0.84mi |
| 45 S Jackson St Beverly Hills, FL | 2.0 | 1.0 | 1108 | $1,275 | $1.15 | 21d | 1 | 0.89mi |
| 229 W Casurina Pl Beverly Hills, FL | 3.0 | 2.0 | 1604 | $1,399 | $0.87 | 21d | 1 | 0.91mi |
| 13 S Washington St Beverly Hills, FL | 3.0 | 1.0 | 1062 | $1,350 | $1.27 | 21d | 1 | 0.96mi |
| 42 Roosevelt Blvd Unit 1 Beverly Hills, FL | 3.0 | 1.5 | 1612 | $1,449 | $0.90 | 21d | 1 | 1.02mi |
| 3263 N Maidencane Dr Beverly Hills, FL | 2.0 | 1.0 | 1380 | $1,350 | $0.98 | 21d | 1 | 1.04mi |
| 95 S Desoto St Beverly Hills, FL | 2.0 | 2.0 | 1152 | $1,435 | $1.25 | 21d | 1 | 1.13mi |
| 95 S Fillmore St Beverly Hills, FL | 2.0 | 1.0 | 1056 | $1,300 | $1.23 | 21d | 1 | 1.17mi |
| 703 W Sunbird Path Hernando, FL | 2.0 | 2.0 | 1298 | $1,700 | $1.31 | 21d | 1 | 1.19mi |
| 144 W Sugarmaple Ln Beverly Hills, FL | 3.0 | 2.0 | 1600 | $1,700 | $1.06 | 21d | 1 | 1.21mi |
| 209 S Tyler St Beverly Hills, FL | 2.0 | 2.0 | 1604 | $1,500 | $0.94 | 21d | 1 | 1.36mi |
HOA detail
- Monthly dues
- $6 · $72/yr
- Likely covers
- landscaping
Listing history 23 events
-
2026-06-03status $164,900 Pending 20 DOM
-
2026-06-02days on market $164,900 Active 20 DOM
-
2026-06-01days on market $164,900 Active 19 DOM
-
2026-05-31days on market $164,900 Active 18 DOM
-
2026-05-30days on market $164,900 Active 17 DOM
-
2026-05-15status Active
-
2026-05-09status Pending
-
2026-05-07$164,900 Active
-
2017-02-06soldstatus $122,000
-
2017-02-03soldstatus $122,000 410-char remark
Show marketing remark (410 chars)
BEAUTIFUL, WELL MAINTAINED, 3 BDRM, 2 BATH, 2 CAR GARAGE WITH REAR WOODEN DECK, REAR FENCED(CHAIN LINK) YARD ON CORNER LOT, CATHEDRIAL & STANDARD CEILINGS, BREAKFAST BAR & EAT IN KITCHEN NOOK, HUGE WALK-IN CLOSET IN MAIN BATH; BEAUTIFUL LANDSCAPING, , 2-CAR GARAGE WITH OPENER; NEWER TILE & CARPET & VINYL(WOOD LIKE) FLOORING; FORMAL DINING ROOM, REAR DECK(2010) 10X14; NEW ROOF IN 2015
-
2016-07-27$122,000 410-char remark
Show marketing remark (410 chars)
BEAUTIFUL, WELL MAINTAINED, 3 BDRM, 2 BATH, 2 CAR GARAGE WITH REAR WOODEN DECK, REAR FENCED(CHAIN LINK) YARD ON CORNER LOT, CATHEDRIAL & STANDARD CEILINGS, BREAKFAST BAR & EAT IN KITCHEN NOOK, HUGE WALK-IN CLOSET IN MAIN BATH; BEAUTIFUL LANDSCAPING, , 2-CAR GARAGE WITH OPENER; NEWER TILE & CARPET & VINYL(WOOD LIKE) FLOORING; FORMAL DINING ROOM, REAR DECK(2010) 10X14; NEW ROOF IN 2015
-
2012-05-08soldstatus $83,500
-
2012-04-24soldstatus $83,500 378-char remark
Show marketing remark (378 chars)
This Beautiful Oakwood Village Home sits on corner lot with 3 Bedrooms, 2 Baths and 2 Car Garage. Open Floor Plan with Large Great Room, Formal Dining Room and Eat in Kitchen with tile floors and newer carpet through out. Outside has a 2010 Built 14 x 10 Deck with Fenced in Back Yard. This is a must see and priced to Sell! owner financing 20% down 5% interest 3-5 year balloon
-
2011-10-06$86,900 378-char remark
Show marketing remark (378 chars)
This Beautiful Oakwood Village Home sits on corner lot with 3 Bedrooms, 2 Baths and 2 Car Garage. Open Floor Plan with Large Great Room, Formal Dining Room and Eat in Kitchen with tile floors and newer carpet through out. Outside has a 2010 Built 14 x 10 Deck with Fenced in Back Yard. This is a must see and priced to Sell! owner financing 20% down 5% interest 3-5 year balloon
-
2009-10-27soldstatus $78,200
-
2009-06-10$78,200
-
2005-09-14soldstatus $158,800
-
2005-02-17soldstatus $115,000
-
2001-07-03soldstatus $104,900
-
2001-05-14$104,900
-
2001-04-04soldstatus $74,600
-
1996-06-01soldstatus $83,000
-
1994-03-01soldstatus $359,700
ⓘ Source: listings_history table (triggers on properties + properties_extension) + one-shot
backfill from property_details.listing_events for pre-trigger history.
Tax reassessment forecast FL · Resets to sale price
- Current annual tax
- $3,098 · $258/mo
- Projected year-2 tax
- $3,098 · $258/mo
- Expected delta
- $0/yr ($0/mo · 0.0%)
ⓘ Screening estimate from a state-policy table — verify with the county assessor before closing.
Climate risk First Street
- Flood 1/10 Low FEMA zone X (unshaded) · 0% chance over 30 yrs
- Wildfire 5/10 Major
- Heat 9/10 Extreme 7 d/yr ≥108°F today · 24 d/yr by 30 yrs out
- Wind 9/10 Extreme 99% chance of damaging wind over 30 yrs
- Air quality 1/10 Low 0 unhealthy d/yr today · 0 by 30 yrs out
Nearby sold comps map
Loading sold comps map…
Walkable amenities ~0.75 mi
Loading nearby amenities…
Taxation est. · year 1
- Rental income
- $20,697
- − Mortgage interest
- −$9,237
- − Property taxes
- −$3,098
- − Insurance
- −$824
- − Repairs & maintenance
- −$1,656
- − Management
- −$1,656
- − HOA
- −$72
- − Depreciation
- −$4,797
- Taxable loss
- −$644
- Est. tax savings @ 24.0%
- +$154
- After-tax cash flow
- $2,133/yr
For passive investors: Depreciation is non-cash, so a rental often shows a tax loss while cash-flowing — sheltering income. Rental losses are passive: they offset passive income freely, and up to $25,000/yr can offset ordinary (W-2) income if you actively participate and your MAGI is under $100k (phasing out to $0 by $150k); unused losses carry forward. On sale, claimed depreciation is recaptured at up to 25%, and gains may owe capital-gains tax (a 1031 exchange can defer both). Figures are a year-1 estimate at your 24.0% rate — not tax advice; consult a CPA.
Schools (NCES district)
- District
- Citrus
- NCES district ID
- 1200270
- Math proficiency
- 49% ▼ -10.00%
- Reading proficiency
- 50% ▼ -6.00%
- Median HH income
- $38,618
- Composite
- 41.28/100
- National rank
- #3519
- State rank
- #44 of 73 in FL
Livability — Beverly Hills
- Score
- 64/100
- State rank
- #666
- US rank
- #13671
Category grades
Schools grade is shown separately in the Schools card above.
Census & demographics
- Census place
- Beverly Hills, FL
- County
- Citrus County · 111,314 people
- City population
- 18,879
- Metro
- Homosassa Springs, FL
- Population (ZIP)
- 18,879
- Household income
- $54,869
- Rent vs Own
- Severe rent burden
- 334.0
Population outlook (Citrus County) Hauer SSP2
- Today (2025)
- 138,622 people
- By 2030
- 136,886 · -1.3%
- By 2040
- 132,009 · -4.8%
- By 2050
- 125,196 · -9.7%
- By 2075
- 108,570 · -21.7%
- By 2100
- 84,454 · -39.1%
Race, ethnicity, and origin ACS 2023
- Neighborhood character
- Predominantly White (82%)
- Race & ethnicity
- White 82% Hispanic / Latino 8% Black 4% Two or more races 3% Asian 2%
- Hispanic origin (detail)
- Mexican 1% Puerto Rican 3%
- Common ancestry
- Romanian 4% Lithuanian 3% Slovak 2%
- Foreign-born
- 8% · Canada, Vietnam, Dominican Republic
- Languages at home
- 93% English-only · Spanish 4% French/Haitian/Cajun 1% Other Asian/Pacific 1%
Political lean MEDSL · Citrus
- 2024 margin
- Solid R (+45.9) · D 26.8% · R 72.6%
- 2008→2024 swing
- -29.8pp toward R · 2008: -16.1pp · 2024: -45.9pp
- All cycles
- 2024: R+45.9 2020: R+41.0 2016: R+39.7 2012: R+21.9 2008: R+16.1
Not yet ingested
- Civics
- —
Market trends
- HPI YoY
- ▼ -138.62%
- Current HPI
- 279.7183
- Rent YoY
- —
- Metro
- Homosassa Springs, FL
- State GDP YoY
- ▲ 3.28%
- F500 in state
- 36
Industry mix (Fortune 500 HQ in FL)
| Industry | F500 HQs | Revenue |
|---|---|---|
| Industrial Technology | 2 | $29B |
|
||
| Insurance | 2 | $17B |
|
||
| Retail | 1 | $60B |
|
||
| Technology Distribution | 1 | $58B |
|
||
| Homebuilding | 1 | $35B |
|
||
| Technology Manufacturing | 1 | $35B |
|
||
Price history
-54.2% since first listed18 events — show timeline
- 2026-05-15 Relisted — RACC
- 2026-05-09 Pending — RACC
- 2026-05-07 Listed $164,900 RACC
- 2017-02-06 Sold (Public Records) $122,000 Public Records
- 2017-02-03 Sold (MLS) $122,000 RACC
- 2016-07-27 Listed $122,000 RACC
- 2012-05-08 Sold (Public Records) $83,500 Public Records
- 2012-04-24 Sold (MLS) $83,500 RACC
- 2011-10-06 Listed $86,900 RACC
- 2009-10-27 Sold (MLS) $78,200 RACC
- 2009-06-10 Listed $78,200 RACC
- 2005-09-14 Sold (Public Records) $158,800 Public Records
- 2005-02-17 Sold (Public Records) $115,000 Public Records
- 2001-07-03 Sold (MLS) $104,900 RACC
- 2001-05-14 Listed $104,900 RACC
- 2001-04-04 Sold (Public Records) $74,600 Public Records
- 1996-06-01 Sold (Public Records) $83,000 Public Records
- 1994-03-01 Sold (Public Records) $359,700 Public Records
Property tax history
+52.9%/yrLatest (2025): $3,098 · -0.1% YoY. Source: county tax records.
Cash-flow waterfall
monthlySold comps — $/sqft
last 12 mo · ≤1 miLoading sold comps…