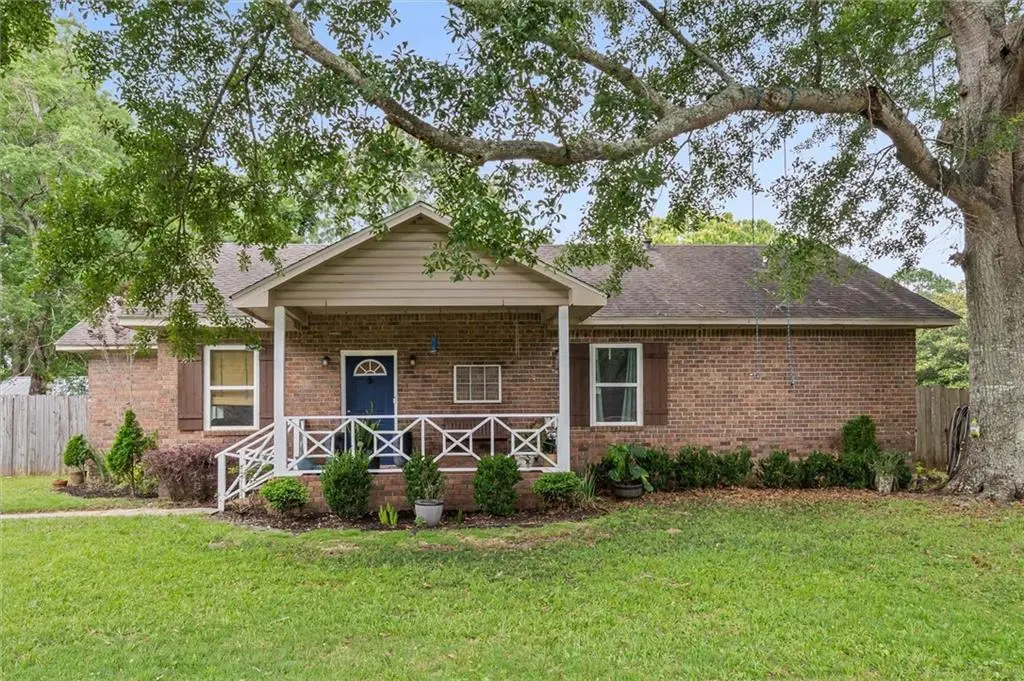
8460 Lake Eleanor Dr · Tillmans Corner, AL
Flood risk 1/10 · Minimal
- FEMA flood zone
- X (unshaded)
- Chance of flooding over 30 yrs
- 0.0%
- Est. flood insurance / yr
- $507 – $1,088
Fire risk 3/10 · Minor
- Est. fire insurance / yr
- $916 – $1,700
Heat risk 9/10 · Severe
- Hot days now (above 105°F)
- 7 days/yr
- Hot days in 30 yrs
- 21 days/yr
Wind risk 9/10 · Severe
- Chance of severe wind over 30 yrs
- 99.0%
Air-quality risk 1/10 · Minimal
- Unhealthy air days now
- 0 days/yr
- Unhealthy air days in 30 yrs
- 0 days/yr
Risk factors via First Street. Map © Google.
Why this score? — see what drove the D- grade
The composite is a weighted blend of 9 inputs, each scored 0–100. Each bar is that input's sub-score; the figure is the points it added to the 100-point composite (weight × sub-score).
- Cash flow +14.9/30.0
- DSCR +4.6/10.0
- ARV discount +3.1/15.0
- Livability +3.1/5.0
- 1% rule +2.8/10.0
- Rent growth +2.5/5.0
- Condition / age +2.5/5.0
- Schools +2.3/10.0
- Appreciation +0.0/10.0
$214,900
🖨 Deal sheet 📄 Offer letter ✓ Due diligence
Listing remarks
Move-In Ready & Conveniently Located! This beautifully updated 3-bedroom, 2-bath home offers 1,494 square feet of comfortable living space on a large, fenced corner lot. Inside, you'll find attractive laminate flooring throughout the main living areas and tile in the wet areas, creating a stylish and low-maintenance interior. The updated kitchen is sure to impress with stone countertops, modern gray cabinetry, and stainless steel appliances. The open and inviting layout makes everyday living and entertaining easy. Major updates provide added peace of mind, including a roof installed in 2019 and HVAC system replaced in 2018. Outside, the spacious fenced yard offers plenty of room for p
Key facts
- Spacious fenced yard
- Stone countertops
- Updated kitchen
Tags
Property features AI
Finance
- Financial info: No financial/investor details listed
- HOA & community: Subdivision: Lakewood Acres
Exterior
- Parking: No parking listed
- Security: No accessibility features listed
- Utilities: Cable available; Electricity available; Water available; Sewer: Other
- Home design: Single family residence; Residential property; Built in 1981
- Construction: Shingle roof; Foundation: See remarks
- Exterior features: Private yard; Fenced yard; Shed(s); View
Interior
- Kitchen: Dishwasher; Electric range
- Bedrooms: 3 bedrooms
- Flooring: Laminate flooring
- Bathrooms: 2 full bathrooms
- Heating & cooling: Electric heating; Central air conditioning
- Interior features: Crown molding; Open floorplan; Stone counters; Breakfast bar
- Laundry & utility: No specific laundry features listed
Neighborhood map
What this means for you Summary
Snapshot
- This is a 3-bed/2.0-bath single-family listed at $215k.
Deal economics
- At list price, monthly cash flow is $64 ($767/yr) — positive.
- The deal already cash-flows at list — no discount required.
- To meet the 1% rule (rent ≥ 1% of price), the offer needs to be $168k (21.9% below list).
- Recommended offer: $168k (21.9% below list) — sets the bar for 1% rule.
- Cap rate 6.6% vs local median 5.0% in Tillmans Corner — top-decile yield for the area; either an underpriced asset or a hidden risk that comps aren't pricing in. Stress-test before assuming the spread holds.
Location & tenants
- Location reads 61/100 on livability (#260 in AL) — a middle-class / working-renter tenant base. Strengths: cost of living A+, housing A+; Watch: crime D+, amenities F, commute F.
- Mobile County (urban): math 15% / reading 39% proficiency, ranked #81 of 129 in AL (top 63%) — low school quality limits family demand, transient renter base, plan for 1-2y turnover; 67% free/reduced lunch — lower-income household profile, screen leases tightly.
- Zoned schools: Pearl Haskew Elementary (math 22% / reading 47%, grade F, #296 of 627 statewide, top 49%, 502 students, 68% FRL); Theodore High School (math 10% / reading 12%, grade F, #247 of 305 statewide, top 81%, 1,280 students, 60% FRL) — zoned schools at 64% FRL track the district average.
- Market conditions: 250 active listings in the ZIP; 1 comparable units currently listed for rent nearby; 1,678 units permitted in Mobile County in 2024 (264 in 5+ unit buildings).
- This rent runs 31% of the median local income ($65k/yr) — at the standard rent-burdened threshold; future hikes will face affordability resistance.
Forward outlook
- Local home prices are declining (-3.0%/yr); year-one equity from $1k of loan paydown is wiped out by about $6k of value loss. Plan a longer hold.
- Mobile County population projected to shrink 8% by 2050 — rents likely to lag national; underwrite the cash flow, not the appreciation.
Negotiation context
- Only 8 days on market — expect competitive offers; lowballing is unlikely to land.
- Current owner paid $113k; list at $215k implies a 91% gain — meaningful room to come down on a strong offer.
Risks & watch-outs
- Climate carrying-cost: severe wind risk, 99% chance of damaging wind over 30y; extreme-heat days projected 7→21/yr by 2055 (HVAC capex compounding) — expect insurance premiums to compound above CPI over the hold.
Questions for the listing agent
- Is there a deadline driving the sale (1031 exchange, divorce, estate, relocation)? That informs how much negotiation room exists.
- Schools are F-rated, which usually means shorter tenancies and higher turnover. Who's the typical renter profile here, and what's been the actual vacancy rate?
- Crime grade is D in this area — have there been break-ins, vandalism, or insurance claims at this property in the last 3 years? What carrier currently insures it and at what premium?
- The area grade is low — what's the realistic commute time and amenity access for the typical tenant pool here? Any planned neighborhood developments (good or bad) we should know about?
- What's the average days-on-market for RENTAL listings here right now (not sales)? A rising rental-DOM trend means longer vacancies and softer asking-rent achievability than the comps imply.
- What's the recent tenant-quality profile in this submarket — average credit score on applications, eviction rate, late-payment / NSF rate, and stable-employment percentage? A property-management company in the area should have these aggregated.
- How much new for-sale + rental construction is in the pipeline within 1–3 miles? Heavy new supply typically softens prices + rents 12–24 months out; constrained supply supports both.
Investment metrics
- 1% rule
- 0.78% ✗
- Cap rate
- 6.65%
- Cash-on-cash
- 1.27%
- DSCR
- 1.06
- GRM
- 10.7
CMA / ARV
- ARV (on-the-fly)
- $195,714
- Comps found
- 9
Show comp detail 9 sales within ~0.75 mi
| Address | Dist | Beds/Ba | Sqft | Sold | Price | $/sf | Match |
|---|---|---|---|---|---|---|---|
| 6208 Anthony Dr W | 0.54mi | 3/2.0 | 1,380 (-8%) | 2mo | $222,000 | $161 | 61 |
| 8502 Mcadams Dr S | 0.20mi | 3/2.0 | 1,344 (-10%) | 17mo | $175,000 | $130 | 60 |
| 6480 Mcadams Dr W | 0.31mi | 3/2.0 | 1,337 (-10%) | 11mo | $195,000 | $146 | 59 |
| 8230 Old Pascagoula Rd | 0.39mi | 3/1.5 | 1,296 (-13%) | 4mo | $170,000 | $131 | 54 |
| 6441 Mcadams Dr W | 0.26mi | 3/2.0 | 1,274 (-15%) | 13mo | $130,000 | $102 | 52 |
| 8461 Lake Tahoe Dr | 0.41mi | 3/2.0 | 1,269 (-15%) | 5mo | $90,000 | $71 | 52 |
| 8309 Lake Helen Dr N | 0.25mi | 3/2.0 | 1,302 (-13%) | 18mo | $182,500 | $140 | 51 |
| 8059 Old Pascagoula Rd | 0.57mi | 3/2.0 | 1,674 (+12%) | 12mo | $225,000 | $134 | 44 |
| 6851 Red Lane Cir | 0.69mi | 3/1.5 | 1,437 (-4%) | 19mo | $105,000 | $73 | 43 |
Match score weights: distance 35% · size 25% · config 20% · recency 20%. Top-matched comps best support the ARV.
Projected returns pro-forma
-3.0% appreciation · 3.0% rent growth · sell at horizon
- IRR
- -14.3%
- Equity multiple
- 0.49×
- Total profit
- $-30,864
- Equity at exit
- $32,042
- IRR
- -5.7%
- Equity multiple
- 0.63×
- Total profit
- $-22,090
- Equity at exit
- $18,581
Cash invested: $60,172 (down + closing). Projections, not guarantees.
Landlord ↔ Tenant lean methodology
- Overall (STATE)
- 90 Strongly Landlord-Friendly
- State Alabama
- 90 Strongly Landlord-Friendly · R+15
- County
- — inherits STATE
- City
- — inherits STATE
ZIP-level market 36582
- Home prices YoY
- -19.1%
- Active inventory
- 250
- Price-to-rent
- 10.7×
Monthly cashflow live
- Estimated rent
- $1,677 medium interval (Pro) →
- Mortgage (P&I)
- −$1,127
- Tax from tax record
- −$45 /mo · $537/yr
- Insurance
- −$90
- HOA
- −$0
- Vacancy / Maint / Mgmt
- −$352
- Net cashflow
- $64
Break-even live
UW: 25.0% down · 7.5% · 30yr · 1.5% tax · 5.0% vac · 8.0% maint · 8.0% mgmt
Financing live
Cash to close
- Down payment
- $53,725
- Closing costs
- $6,447
- Reserves months
- —
- Total cash needed
- —
Loan-product check · same deal, 3 products live
Conventional
25% down · 7.5% · 30yr
- Down + closing
- —
- Monthly P&I
- —
- Monthly cashflow
- —
- DSCR
- —
- Eligible?
- —
Personal DTI + credit; lowest rate.
DSCR
20% down · 8.5% · 30yr
- Down + closing
- —
- Monthly P&I
- —
- Monthly cashflow
- —
- DSCR
- —
- Eligible?
- —
No personal income docs; deal must DSCR.
Hard money
10% down · 12.0% · 12mo
- Down + closing
- —
- Monthly P&I
- —
- Monthly cashflow
- —
- DSCR
- —
- Eligible?
- —
Short-term bridge; refi at stabilization.
Rent comps 1 comps
| Address | Beds | Baths | Sqft | Rent | $/sqft | DOM | Units | Dist |
|---|---|---|---|---|---|---|---|---|
| 8216 Old Pascagoula Rd Theodore, AL | 3.0 | 2.0 | 1630 | $1,600 | $0.98 | 13d | 1 | 0.40mi |
Listing history 8 events
-
2026-06-15statusdays on market $214,900 Pending 8 DOM
-
2026-06-14days on market $214,900 Active 7 DOM
-
2026-06-13days on market $214,900 Active 6 DOM
-
2026-06-10days on market $214,900 Active 4 DOM
-
2026-06-09days on market $214,900 Active 3 DOM
-
2026-06-08days on market $214,900 Active 2 DOM
-
2026-06-07remarks 695-char remark
-
2026-06-07$214,900 Active 1 DOM
ⓘ Source: listings_history table (triggers on properties + properties_extension) + one-shot
backfill from property_details.listing_events for pre-trigger history.
Tax reassessment forecast AL · Resets to sale price
- Current annual tax
- $537 · $45/mo
- Projected year-2 tax
- $881 · $73/mo
- Expected delta
- +$344/yr (+$29/mo · 64.0%)
ⓘ Screening estimate from a state-policy table — verify with the county assessor before closing.
Climate risk First Street
- Flood 1/10 Low FEMA zone X (unshaded) · 0% chance over 30 yrs
- Wildfire 3/10 Moderate
- Heat 9/10 Extreme 7 d/yr ≥105°F today · 21 d/yr by 30 yrs out
- Wind 9/10 Extreme 99% chance of damaging wind over 30 yrs
- Air quality 1/10 Low 0 unhealthy d/yr today · 0 by 30 yrs out
Nearby sold comps map
Loading sold comps map…
Walkable amenities ~0.75 mi
Loading nearby amenities…
Taxation est. · year 1
- Rental income
- $20,130
- − Mortgage interest
- −$12,038
- − Property taxes
- −$537
- − Insurance
- −$1,074
- − Repairs & maintenance
- −$1,610
- − Management
- −$1,610
- − Depreciation
- −$6,252
- Taxable loss
- −$2,992
- Est. tax savings @ 24.0%
- +$718
- After-tax cash flow
- $1,485/yr
For passive investors: Depreciation is non-cash, so a rental often shows a tax loss while cash-flowing — sheltering income. Rental losses are passive: they offset passive income freely, and up to $25,000/yr can offset ordinary (W-2) income if you actively participate and your MAGI is under $100k (phasing out to $0 by $150k); unused losses carry forward. On sale, claimed depreciation is recaptured at up to 25%, and gains may owe capital-gains tax (a 1031 exchange can defer both). Figures are a year-1 estimate at your 24.0% rate — not tax advice; consult a CPA.
Schools (NCES district)
- District
- Mobile County
- NCES district ID
- 0102370
- Math proficiency
- 15% ▼ -28.00%
- Reading proficiency
- 39% ▬ 0.00%
- Median HH income
- $42,455
- Composite
- 22.9/100
- National rank
- #8002
- State rank
- #81 of 129 in AL
Livability — Tillmans Corner
- Score
- 61/100
- State rank
- #260
- US rank
- #18090
Category grades
Schools grade is shown separately in the Schools card above.
Census & demographics
- Census place
- Tillmans Corner, AL
- County
- Mobile County · 246,577 people
- City population
- 14,550
- Metro
- Mobile, AL
- Population (ZIP)
- 23,705
- Household income
- $64,763
- Rent vs Own
- Severe rent burden
- 431.0
Population outlook (Mobile County) Hauer SSP2
- Today (2025)
- 415,303 people
- By 2030
- 411,755 · -0.9%
- By 2040
- 399,670 · -3.8%
- By 2050
- 382,616 · -7.9%
- By 2075
- 337,353 · -18.8%
- By 2100
- 283,391 · -31.8%
Race, ethnicity, and origin ACS 2023
- Neighborhood character
- Predominantly White (73%)
- Race & ethnicity
- White 73% Black 18% Two or more races 4% Hispanic / Latino 3% Asian 2%
- Common ancestry
- Slovak 3% Serbian 2% Lithuanian 2%
- Foreign-born
- 3% · Canada, Vietnam
- Languages at home
- 95% English-only · Spanish 3% Vietnamese 1%
Political lean MEDSL · Mobile
- 2024 margin
- R (+16.4) · D 41.3% · R 57.7%
- 2008→2024 swing
- -7.7pp toward R · 2008: -8.7pp · 2024: -16.4pp
- All cycles
- 2024: R+16.4 2020: R+11.9 2016: R+13.9 2012: R+9.3 2008: R+8.7
Not yet ingested
- Civics
- —
Market trends
- HPI YoY
- ▼ -49.61%
- Current HPI
- 209.7621
- Rent YoY
- —
- Metro
- Mobile, AL
- State GDP YoY
- ▲ 2.94%
- F500 in state
- 4
Industry mix (Fortune 500 HQ in AL)
| Industry | F500 HQs | Revenue |
|---|---|---|
| Financial Services | 1 | $8B |
|
||
| Healthcare | 1 | $5B |
|
||
Price history
+55.7% since first listed3 events — show timeline
- 2026-06-06 Listed $214,900 GCMLS AL
- 2018-09-11 Sold (Public Records) $112,621 Public Records
- 2006-04-03 Sold (Public Records) $138,000 Public Records
Property tax history
-2.0%/yrLatest (2025): $537 · +9.1% YoY. Source: county tax records.
Cash-flow waterfall
monthlySold comps — $/sqft
last 12 mo · ≤1 miLoading sold comps…