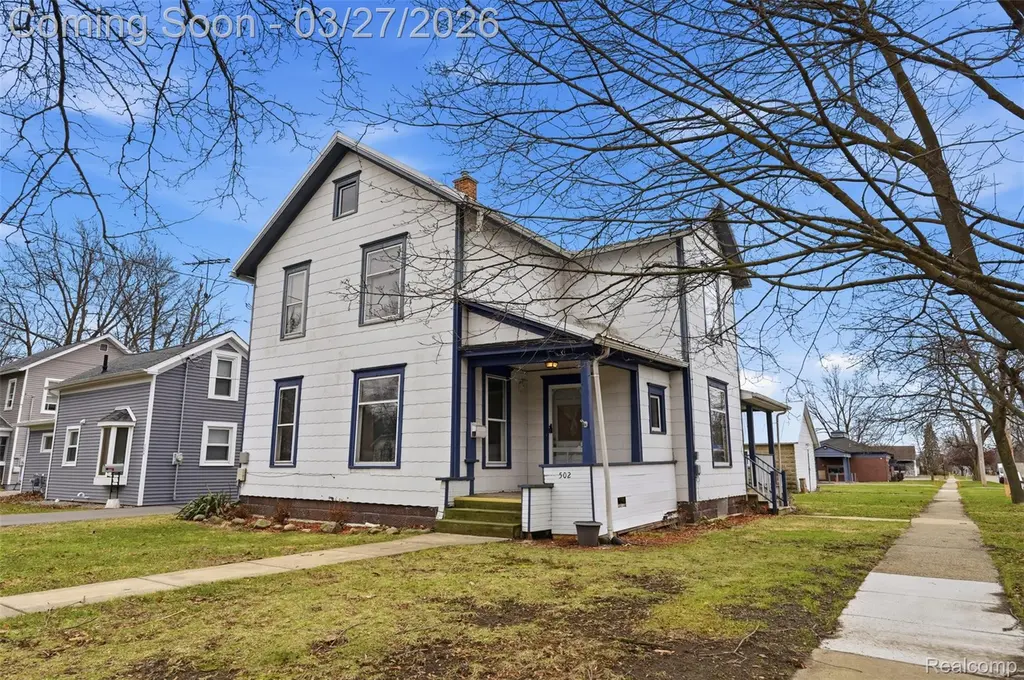
502 E Logan St · Tecumseh, MI
Flood risk 1/10 · Minimal
- FEMA flood zone
- X (unshaded)
- Chance of flooding over 30 yrs
- 0.0%
- Est. flood insurance / yr
- $507 – $1,088
Fire risk 1/10 · Minimal
- Est. fire insurance / yr
- $784 – $1,456
Heat risk 3/10 · Minor
- Hot days now (above 99°F)
- 7 days/yr
- Hot days in 30 yrs
- 15 days/yr
Wind risk 2/10 · Minimal
- Chance of severe wind over 30 yrs
- —
Air-quality risk 2/10 · Minimal
- Unhealthy air days now
- 1 days/yr
- Unhealthy air days in 30 yrs
- 2 days/yr
Risk factors via First Street. Map © Google.
Why this score? — see what drove the C grade
The composite is a weighted blend of 9 inputs, each scored 0–100. Each bar is that input's sub-score; the figure is the points it added to the 100-point composite (weight × sub-score).
- Cash flow +20.7/30.0
- ARV discount +9.9/15.0
- DSCR +6.6/10.0
- 1% rule +5.5/10.0
- Livability +3.9/5.0
- Schools +3.6/10.0
- Rent growth +2.5/5.0
- Condition / age +2.5/5.0
- Appreciation +0.0/10.0
$197,900
🖨 Deal sheet (PDF) 📄 Offer letter ✓ Due diligence
Listing remarks MLS
Classic farmhouse charm with the updates that matter. This 1,802 sq ft home offers 3 bedrooms and 2 full baths, blending timeless character with everyday functionality. You'll love the original woodwork throughout - details you simply can't replicate - paired with an updated kitchen with cherry cabinets, island with butcher block counter top (needs staining) that makes the home move-in ready. The main floor features a convenient first-floor bedroom, ideal for guests or flexible living. Major mechanicals are already handled with a newer furnace, central air, and a durable steel roof installed in 2015 - so you can focus on making it your own, not fixing it up. Situated on a generous 49 x 190 lot, there's plenty of space to enjoy the outdoors, plus a 1.5-car detached garage for storage and convenience. - Electrical updated
Key facts
- First-floor bedroom
- Newer furnace
- Updated kitchen
Tags
Property features AI
Finance
- Other: Property listed as residential single-family; Lot dimensions approximately 49 x 189 (0.22 acres)
Exterior
- Parking: Detached garage; Approximately 1.5 garage spaces
- Security: Smoke detector(s)
- Utilities: Public water; Public sewer; Electric with circuit breakers
- Home design: Single-family residence; Two levels; Ground-level entry with steps
- Construction: Asphalt and metal roof; Other construction materials
- Exterior features: Covered porch; Corner lot; Paved road access
Interior
- Kitchen: Built-in gas range; Dishwasher; Microwave; Disposal; Free-standing refrigerator
- Bedrooms: Details not specified
- Bathrooms: 2 full bathrooms
- Interior features: Gas water heater; Built-in gas range; Dishwasher; Disposal; Microwave; Partial, unfinished basement; 8 total rooms; Smoke detector(s)
- Laundry & utility: Laundry room with washer hookup and electric dryer hookup; Washer; Dryer
Neighborhood map
What this means for you Summary
Snapshot
- This is a 3-bed/2.0-bath single-family listed at $198k.
Deal economics
- At list price, monthly cash flow is $266 ($3k/yr) — positive.
- The deal already cash-flows at list — no discount required.
- Meets the 1% rule at list price ($2k rent vs $198k).
- Recommended offer: $195k (1.5% below list) — sets the bar for market timing.
- Cap rate 7.9% vs local median 3.6% in Tecumseh — top-decile yield for the area; either an underpriced asset or a hidden risk that comps aren't pricing in. Stress-test before assuming the spread holds.
Location & tenants
- Location reads 78/100 on livability (#103 in MI, #2,459 nationally) — a middle-class / working-renter tenant base. Strengths: crime A+, cost of living A+, housing A+; Watch: amenities F, commute F.
- Tecumseh Public Schools (town): math 34% / reading 48% proficiency, ranked #181 of 540 in MI (top 34%) — families likely to look elsewhere, expect single-tenant / working-renter base with shorter leases.
- Zoned schools: Tecumseh Acres North Early Learning Center (303 students, 43% FRL); Tecumseh Middle School (math 33% / reading 41%, grade F, #248 of 493 statewide, top 53%, 793 students, 34% FRL); Tecumseh High School (math 37% / reading 72%, grade C-, #109 of 713 statewide, top 17%, 800 students, 33% FRL).
- Market conditions: 96 active listings in the ZIP; 4 comparable units currently listed for rent nearby; rentals at typical pace (median 15d on market — plan ~3-4 weeks tenant-placement turnaround); 137 units permitted in Lenawee County in 2024 (0 in 5+ unit buildings).
Forward outlook
- Local home prices are declining (-3.0%/yr); year-one equity from $1k of loan paydown is wiped out by about $6k of value loss. Plan a longer hold.
- Lenawee County population projected at -18% by 2050 — secular population decline; favor cash flow + early exit over multi-decade hold.
Negotiation context
- It's been on market 20 days — a 2% lower offer ($195k) is reasonable based on typical stale-listing flexibility.
- 13 sale attempts since 12y ago; this cycle's ask has dropped $12k (6%) from the opening price — seller is motivated, your offer sets the floor, not the list.
- Current owner paid $93k; list at $198k implies a 113% gain — meaningful room to come down on a strong offer.
Risks & watch-outs
- Watch-outs: built in 1900 — expect roof / HVAC / electrical / plumbing capex.
Questions for the listing agent
- Built in 1900 — when were the roof, HVAC, electrical panel, plumbing, and water heater last replaced?
- Is there a deadline driving the sale (1031 exchange, divorce, estate, relocation)? That informs how much negotiation room exists.
- Schools are B-rated — typically a magnet for longer-tenancy family renters. What's the average tenant stay here, and is there a school-zone premium baked into asking?
- What's the average days-on-market for RENTAL listings here right now (not sales)? A rising rental-DOM trend means longer vacancies and softer asking-rent achievability than the comps imply.
- What's the recent tenant-quality profile in this submarket — average credit score on applications, eviction rate, late-payment / NSF rate, and stable-employment percentage? A property-management company in the area should have these aggregated.
- How much new for-sale + rental construction is in the pipeline within 1–3 miles? Heavy new supply typically softens prices + rents 12–24 months out; constrained supply supports both.
Investment metrics
- 1% rule
- 1.05% ✓
- Cap rate
- 7.91%
- Cash-on-cash
- 5.77%
- DSCR
- 1.26
- GRM
- 8.0
CMA / ARV
- ARV (median comp)
- $209,253
- List price
- $197,900
- Delta
- 0.31%
- Verdict
- FAIR
- Comps
- 20 within 1.0 mi
Show comp detail 12 sales within ~0.75 mi
| Address | Dist | Beds/Ba | Sqft | Sold | Price | $/sf | Match |
|---|---|---|---|---|---|---|---|
| 510 E Logan St | 0.04mi | 3/2.0 | 1,736 (-4%) | 5mo | $252,000 | $145 | 88 |
| 410 E Pottawatamie St | 0.19mi | 3/2.0 | 1,728 (-4%) | 1mo | $231,000 | $134 | 84 |
| 424 N Evans St | 0.42mi | 3/1.5 | 1,713 (-5%) | 13mo | $270,000 | $158 | 60 |
| 600 Center Dr | 0.42mi | 3/1.5 | 1,600 (-11%) | 8mo | $215,000 | $134 | 53 |
| 219 Chippewa St | 0.61mi | 4/2.0 (+1) | 1,740 (-3%) | 10mo | $319,900 | $184 | 52 |
| 301 W Shawnee St | 0.56mi | 3/2.0 | 1,998 (+11%) | 6mo | $300,000 | $150 | 51 |
| 110 W Shawnee St | 0.42mi | 3/1.0 | 1,588 (-12%) | 10mo | $235,000 | $148 | 49 |
| 314 W Logan St | 0.58mi | 4/1.5 (+1) | 1,645 (-9%) | 7mo | $234,000 | $142 | 46 |
| 304 N Van Buren St | 0.69mi | 3/1.5 | 1,644 (-9%) | 11mo | $234,000 | $142 | 42 |
| 405 N Union St | 0.70mi | 3/2.0 | 2,056 (+14%) | 3mo | $455,000 | $221 | 42 |
| 507 W Logan St | 0.73mi | 3/2.0 | 1,566 (-13%) | 8mo | $200,000 | $128 | 38 |
| 107 N Van Buren Rd | 0.71mi | 4/2.5 (+1) | 1,548 (-14%) | 7mo | $219,000 | $141 | 31 |
Match score weights: distance 35% · size 25% · config 20% · recency 20%. Top-matched comps best support the ARV.
Projected returns pro-forma
-3.0% appreciation · 3.0% rent growth · sell at horizon
- IRR
- -7.4%
- Equity multiple
- 0.73×
- Total profit
- $-15,065
- Equity at exit
- $29,508
- IRR
- 2.2%
- Equity multiple
- 1.16×
- Total profit
- $8,866
- Equity at exit
- $17,111
Cash invested: $55,412 (down + closing). Projections, not guarantees.
Landlord ↔ Tenant lean methodology
- Overall (STATE)
- 62 Landlord-Friendly
- State Michigan
- 62 Landlord-Friendly · EVEN
- County
- — inherits STATE
- City
- — inherits STATE
ZIP-level market 49286
- Home prices YoY
- -32.9%
- Active inventory
- 96
- Price-to-rent
- 8.0×
Monthly cashflow live
- Estimated rent
- $2,070 medium interval (Pro) →
- Mortgage (P&I)
- −$1,038
- Tax from tax record
- −$249 /mo · $2,986/yr
- Insurance
- −$82
- HOA
- −$0
- Vacancy / Maint / Mgmt
- −$435
- Net cashflow
- $266
Break-even live
Sensitivity live
| Price | -10% $378 | -5% $322 | +0% $266 | +5% $210 | +10% $154 |
|---|---|---|---|---|---|
| Rent | -10% $103 | -5% $185 | +0% $266 | +5% $348 | +10% $430 |
| Rate | -1.0pp $366 | -0.5pp $317 | base $266 | +0.5pp $215 | +1.0pp $163 |
UW: 25.0% down · 7.5% · 30yr · 1.5% tax · 5.0% vac · 8.0% maint · 8.0% mgmt
Financing live
Cash to close
- Down payment
- $49,475
- Closing costs
- $5,937
- Reserves months
- —
- Total cash needed
- —
Loan-product check · same deal, 3 products live
Conventional
25% down · 7.5% · 30yr
- Down + closing
- —
- Monthly P&I
- —
- Monthly cashflow
- —
- DSCR
- —
- Eligible?
- —
Personal DTI + credit; lowest rate.
DSCR
20% down · 8.5% · 30yr
- Down + closing
- —
- Monthly P&I
- —
- Monthly cashflow
- —
- DSCR
- —
- Eligible?
- —
No personal income docs; deal must DSCR.
Hard money
10% down · 12.0% · 12mo
- Down + closing
- —
- Monthly P&I
- —
- Monthly cashflow
- —
- DSCR
- —
- Eligible?
- —
Short-term bridge; refi at stabilization.
Rent comps 4 comps
| Address | Beds | Baths | Sqft | Rent | $/sqft | DOM | Units | Dist |
|---|---|---|---|---|---|---|---|---|
| 603 Nokomis St Tecumseh, MI | 3.0 | 2.0 | 1620 | $2,500 | $1.54 | 45d | 1 | 1.26mi |
| 9103 N Union St #174 Tecumseh, MI | 3.0 | 2.0 | 1344 | $1,903 | $1.42 | 15d | 1 | 1.39mi |
| 9103 N Union St #165 Tecumseh, MI | 3.0 | 2.0 | 1248 | $1,848 | $1.48 | 15d | 1 | 1.39mi |
| 9115 N Union St Tecumseh, MI | 3.0 | 2.0 | 1408 | $1,876 | $1.33 | 15d | 4 | 1.44mi |
Listing history 50 events
-
2026-06-21days on market $197,900 Active 20 DOM
-
2026-06-18days on market $197,900 Active 17 DOM
-
2026-06-17days on market $197,900 Active 16 DOM
-
2026-06-16days on market $197,900 Active 15 DOM
-
2026-06-15pricedays on market $197,900 Active 14 DOM
-
2026-06-14days on market $209,900 Active 12 DOM
-
2026-06-13days on market $209,900 Active 11 DOM
-
2026-06-10days on market $209,900 Active 9 DOM
-
2026-06-09days on market $209,900 Active 8 DOM
-
2026-06-08days on market $209,900 Active 7 DOM
-
2026-06-07days on market $209,900 Active 6 DOM
-
2026-06-05days on market $209,900 Active 3 DOM
-
2026-06-03days on market $209,900 Active 2 DOM
-
2026-06-02days on market $209,900 Active 1 DOM
-
2026-06-01days on market $209,900 Active 67 DOM
Show marketing remark (831 chars)
Classic farmhouse charm with the updates that matter. This 1,802 sq ft home offers 3 bedrooms and 2 full baths, blending timeless character with everyday functionality. You'll love the original woodwork throughout - details you simply can't replicate - paired with an updated kitchen with cherry cabinets, island with butcher block counter top (needs staining) that makes the home move-in ready. The main floor features a convenient first-floor bedroom, ideal for guests or flexible living. Major mechanicals are already handled with a newer furnace, central air, and a durable steel roof installed in 2015 - so you can focus on making it your own, not fixing it up. Situated on a generous 49 x 190 lot, there's plenty of space to enjoy the outdoors, plus a 1.5-car detached garage for storage and convenience. - Electrical updated
-
2026-05-31days on market $209,900 Active 66 DOM
-
2026-05-30days on market $209,900 Active 65 DOM
-
2026-05-18price $209,900 810-char remark
-
2026-05-18price $209,900 840-char remark
-
2026-05-04price $219,900 810-char remark
-
2026-05-03price $219,900 840-char remark
-
2026-04-16price $227,900 810-char remark
-
2026-04-16price $227,900 840-char remark
-
2026-04-03price $239,900 810-char remark
-
2026-04-03price $239,900 840-char remark
-
2026-03-27$249,900 Active 810-char remark
-
2026-03-27$249,900 Active 840-char remark
-
2026-03-24historical $249,900 810-char remark
-
2021-04-19soldstatus $93,000
-
2021-04-16soldstatus $93,000 Sold
-
2021-04-16soldstatus $93,000 Closed
-
2021-03-26status Pending
-
2021-03-26status Pending
-
2021-01-13historical Contingent - Continue To Show
-
2021-01-13historical Keep Showing-Contgcy Appl
-
2020-06-19price $109,900
-
2020-06-18price $109,900
-
2020-02-19status Active
-
2020-02-19status Active
-
2020-01-24historical
-
2020-01-24historical
-
2020-01-22historical
-
2020-01-17$117,900 Active
-
2020-01-17$117,900 Active
-
2018-12-16status Pending
-
2018-12-15historical
-
2018-12-15historical
-
2018-12-10historical Keep Showing-Contgcy Appl
-
2018-12-07price $99,900
-
2018-09-11price $109,000
ⓘ Source: listings_history table (triggers on properties + properties_extension) + one-shot
backfill from property_details.listing_events for pre-trigger history.
Tax reassessment forecast MI · Partial reset (capped growth)
- Current annual tax
- $2,986 · $249/mo
- Projected year-2 tax
- $3,017 · $251/mo
- Expected delta
- +$31/yr (+$3/mo · 1.0%)
ⓘ Screening estimate from a state-policy table — verify with the county assessor before closing.
Climate risk First Street
- Flood 1/10 Low FEMA zone X (unshaded) · 0% chance over 30 yrs
- Wildfire 1/10 Low
- Heat 3/10 Moderate 7 d/yr ≥99°F today · 15 d/yr by 30 yrs out
- Wind 2/10 Low
- Air quality 2/10 Low 1 unhealthy d/yr today · 2 by 30 yrs out
Nearby sold comps map
Loading sold comps map…
Walkable amenities ~0.75 mi
Loading nearby amenities…
Taxation est. · year 1
- Rental income
- $24,844
- − Mortgage interest
- −$11,085
- − Property taxes
- −$2,986
- − Insurance
- −$990
- − Repairs & maintenance
- −$1,988
- − Management
- −$1,988
- − Depreciation
- −$5,757
- Taxable income
- $51
- Est. tax owed @ 24.0%
- −$12
- After-tax cash flow
- $3,185/yr
For passive investors: Depreciation is non-cash, so a rental often shows a tax loss while cash-flowing — sheltering income. Rental losses are passive: they offset passive income freely, and up to $25,000/yr can offset ordinary (W-2) income if you actively participate and your MAGI is under $100k (phasing out to $0 by $150k); unused losses carry forward. On sale, claimed depreciation is recaptured at up to 25%, and gains may owe capital-gains tax (a 1031 exchange can defer both). Figures are a year-1 estimate at your 24.0% rate — not tax advice; consult a CPA.
Schools (NCES district)
- District
- Tecumseh Public Schools
- NCES district ID
- 2633720
- Math proficiency
- 34% ▼ -5.00%
- Reading proficiency
- 48% ▼ -4.00%
- Median HH income
- $58,026
- Composite
- 36.04/100
- National rank
- #4775
- State rank
- #181 of 540 in MI
Livability — Tecumseh
- Score
- 78/100
- State rank
- #103
- US rank
- #2459
Category grades
Schools grade is shown separately in the Schools card above.
Census & demographics
- Census place
- Tecumseh, MI
- City population
- 14,331
- Population (ZIP)
- 14,331
Population outlook (Lenawee County) Hauer SSP2
- Today (2025)
- 95,497 people
- By 2030
- 92,722 · -2.9%
- By 2040
- 85,641 · -10.3%
- By 2050
- 77,971 · -18.4%
- By 2075
- 60,043 · -37.1%
- By 2100
- 41,468 · -56.6%
Race, ethnicity, and origin ACS 2023
- Neighborhood character
- Predominantly White (87%)
- Race & ethnicity
- White 87% Two or more races 8% Hispanic / Latino 7% Black 1%
- Hispanic origin (detail)
- Mexican 4% Puerto Rican 2%
- Common ancestry
- Romanian 5% Lithuanian 4% Slovak 2%
- Foreign-born
- 2% · Canada
- Languages at home
- 97% English-only · Spanish 2%
Political lean MEDSL · Lenawee
- 2024 margin
- Strong R (+23.0) · D 37.8% · R 60.8% · Other 1.4%
- 2008→2024 swing
- -28.1pp toward R · 2008: 5.1pp · 2024: -23.0pp
- All cycles
- 2024: R+23.0 2020: R+19.9 2016: R+21.1 2012: R+1.3 2008: D+5.1
Not yet ingested
- Civics
- —
Market trends
- HPI YoY
- ▼ -114.90%
- Current HPI
- 234.4935
- Rent YoY
- —
- Metro
- —
- State GDP YoY
- ▲ 1.37%
- F500 in state
- 28
Industry mix (Fortune 500 HQ in MI)
| Industry | F500 HQs | Revenue |
|---|---|---|
| Automotive Parts | 3 | $48B |
|
||
| Automotive | 2 | $372B |
|
||
| Chemicals | 1 | $45B |
|
||
| Automotive Retail | 1 | $29B |
|
||
| Healthcare / Medical Devices | 1 | $23B |
|
||
| Automotive Technology | 1 | $20B |
|
||
Price history
+183.1% since first listed47 events — show timeline
- 2026-06-14 Price Changed $197,900 REALCOMP
- 2026-06-12 Price Changed $197,900 MiRealSource-MiMLS
- 2026-06-01 Listed $209,900 REALCOMP
- 2026-06-01 Listing Removed — MiRealSource-MiMLS
- 2026-06-01 Listing Removed — REALCOMP
- 2026-06-01 Listed $209,900 MiRealSource-MiMLS
- 2026-05-18 Price Changed $209,900 MiRealSource-MiMLS
- 2026-05-18 Price Changed $209,900 REALCOMP
- 2026-05-04 Price Changed $219,900 MiRealSource-MiMLS
- 2026-05-03 Price Changed $219,900 REALCOMP
- 2026-04-16 Price Changed $227,900 MiRealSource-MiMLS
- 2026-04-16 Price Changed $227,900 REALCOMP
- 2026-04-03 Price Changed $239,900 MiRealSource-MiMLS
- 2026-04-03 Price Changed $239,900 REALCOMP
- 2026-03-27 Listed $249,900 MiRealSource-MiMLS
- 2026-03-27 Listed $249,900 REALCOMP
- 2026-03-24 Coming Soon — MiRealSource-MiMLS
- 2021-04-19 Sold (Public Records) $93,000 Public Records
- 2021-04-16 Sold (MLS) $93,000 MiRealSource-MiMLS
- 2021-04-16 Sold (MLS) $93,000 REALCOMP
- 2021-03-26 Pending — REALCOMP
- 2021-03-26 Pending — MiRealSource-MiMLS
- 2021-01-13 Contingent — REALCOMP
- 2021-01-13 Contingent — MiRealSource-MiMLS
- 2020-06-19 Price Changed $109,900 MiRealSource-MiMLS
- 2020-06-18 Price Changed $109,900 REALCOMP
- 2020-02-19 Relisted — REALCOMP
- 2020-02-19 Relisted — MiRealSource-MiMLS
- 2020-01-24 Listing Removed — REALCOMP
- 2020-01-24 Listing Removed — REALCOMP
- 2020-01-22 Listing Removed — MiRealSource-MiMLS
- 2020-01-17 Listed $117,900 MiRealSource-MiMLS
- 2020-01-17 Listed $117,900 REALCOMP
- 2018-12-16 Pending — MiRealSource-MiMLS
- 2018-12-15 Listing Removed — MiRealSource-MiMLS
- 2018-12-15 Listing Removed — REALCOMP
- 2018-12-10 Contingent — MiRealSource-MiMLS
- 2018-12-07 Price Changed $99,900 MiRealSource-MiMLS
- 2018-09-11 Price Changed $109,000 MiRealSource-MiMLS
- 2018-08-28 Relisted — MiRealSource-MiMLS
- 2018-08-08 Listing Removed — MiRealSource-MiMLS
- 2018-07-07 Listed $119,000 MiRealSource-MiMLS
- 2018-07-07 Listed $99,900 REALCOMP
- 2015-03-03 Listing Removed — MiRealSource-MiMLS
- 2015-03-03 Listing Removed — REALCOMP
- 2014-02-11 Listed $69,900 MiRealSource-MiMLS
- 2014-02-11 Listed $69,900 REALCOMP
Property tax history
+1.8%/yrLatest (2025): $2,986 · +8.6% YoY. Source: county tax records.
Cash-flow waterfall
monthlySold comps — $/sqft
last 12 mo · ≤1 miLoading sold comps…