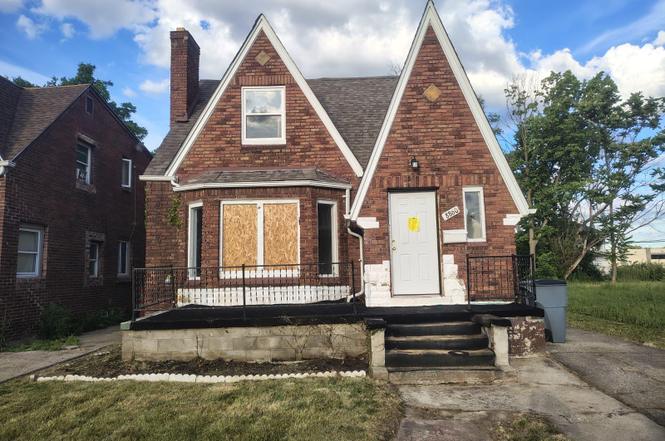
8860 Appoline St · Detroit, MI
Flood risk 1/10 · Minimal
- FEMA flood zone
- X (unshaded)
- Chance of flooding over 30 yrs
- 0.0%
- Est. flood insurance / yr
- $473 – $860
Fire risk 1/10 · Minimal
- Est. fire insurance / yr
- $784 – $1,456
Heat risk 3/10 · Minor
- Hot days now (above 97°F)
- 7 days/yr
- Hot days in 30 yrs
- 15 days/yr
Wind risk 2/10 · Minimal
- Chance of severe wind over 30 yrs
- —
Air-quality risk 3/10 · Minor
- Unhealthy air days now
- 2 days/yr
- Unhealthy air days in 30 yrs
- 5 days/yr
Risk factors via First Street. Map © Google.
Why this score? — see what drove the C grade
The composite is a weighted blend of 9 inputs, each scored 0–100. Each bar is that input's sub-score; the figure is the points it added to the 100-point composite (weight × sub-score).
- Cash flow +30.0/30.0
- 1% rule +10.0/10.0
- DSCR +10.0/10.0
- Livability +3.7/5.0
- Condition / age +2.5/5.0
- Rent growth +1.9/5.0
- Schools +1.3/10.0
- ARV discount +0.0/15.0
- Appreciation +0.0/10.0
$99,900
🖨 Deal sheet (PDF) 📄 Offer letter ✓ Due diligence
Listing remarks MLS
Welcome to 8860 Appoline Street, a spacious Detroit brick home offering plenty of potential and room to grow. Featuring 5 bedrooms, 1.5 bathrooms, and over 1,500 square feet of living space, this home provides a functional layout with generous room sizes and classic character throughout. Whether you're an owner-occupant looking to make it your own or an investor seeking your next opportunity, this property has strong potential in an established Detroit neighborhood. Conveniently located near major roads, schools, shopping, and everyday amenities. Don't miss your chance to bring your vision to this great Detroit opportunity. Buyer and buyer's agent to verify all information. Sold as is. Buyer and agent to verify all information.
Key facts
- 4,356 sq ft lot
- Built 1936
- Listed 4 days
Property features AI
Finance
- Financial info: Annual tax: $3,595
Exterior
- Parking: No garage
- Utilities: Public water; Public sewer
- Home design: Single-family residence; One level with ground-level entry
- Construction: Brick construction; Brick/mortar foundation; Built area above grade: 1,561 square feet
- Exterior features: Paved road access; Lot approximately 0.1 acre (35 x 125.75)
Interior
- Bathrooms: 1 full bathroom; 1 half bathroom
- Heating & cooling: Forced air heating (natural gas); No central cooling
- Interior features: Unfinished basement; Total of 5 rooms
Neighborhood map
What this means for you Summary
Snapshot
- This is a 5-bed/1.5-bath single-family listed at $100k.
Deal economics
- At list price, monthly cash flow is $700 ($8k/yr) — positive.
- The deal already cash-flows at list — no discount required.
- Meets the 1% rule at list price ($2k rent vs $100k).
- Cap rate 14.7% vs local median 10.0% in Detroit — top-decile yield for the area; either an underpriced asset or a hidden risk that comps aren't pricing in. Stress-test before assuming the spread holds.
Location & tenants
- Location reads 73/100 on livability (#218 in MI) — a middle-class / working-renter tenant base. Strengths: amenities A+, commute A+, cost of living A+; Watch: schools F, crime F, employment F.
- Detroit Public Schools Community District (urban): math 10% / reading 24% proficiency, ranked #499 of 540 in MI (top 92%) — low school quality limits family demand, transient renter base, plan for 1-2y turnover; 90% free/reduced lunch — lower-income household profile, screen leases tightly.
- Market conditions: Rents soft (-2.3%/yr); 367 active listings in the ZIP; 2 comparable units currently listed for rent nearby; lower-income renter base — watch delinquency; 2,639 units permitted in Wayne County in 2024 (1,216 in 5+ unit buildings).
- At $1,760/mo this rent would consume 69% of the median local household income ($31k/yr) (locally 4144% of renters already pay >50% of income on rent) — very limited rent-growth headroom before tenants either downsize or default.
Forward outlook
- Local home prices are declining (-3.0%/yr); year-one equity from $691 of loan paydown is wiped out by about $3k of value loss. Plan a longer hold.
- Wayne County population projected at -17% by 2050 — secular population decline; favor cash flow + early exit over multi-decade hold.
- At projected returns (-3.0% appreciation + 0.0% rent growth), your $28k cash investment doubles in ~5 years — after that, you're playing with house money.
Negotiation context
- Only 4 days on market — expect competitive offers; lowballing is unlikely to land.
- 19 sale attempts since 20y ago with the ask held roughly flat each time — persistent listings suggest the price (not the market) is what's stuck; bring a comps-based counter.
- Current owner paid $61k; list at $100k implies a 63% gain — meaningful room to come down on a strong offer.
Risks & watch-outs
- Watch-outs: built in 1936 — expect roof / HVAC / electrical / plumbing capex.
Questions for the listing agent
- Built in 1936 — when were the roof, HVAC, electrical panel, plumbing, and water heater last replaced?
- Is there a deadline driving the sale (1031 exchange, divorce, estate, relocation)? That informs how much negotiation room exists.
- Schools are F-rated, which usually means shorter tenancies and higher turnover. Who's the typical renter profile here, and what's been the actual vacancy rate?
- Crime grade is F in this area — have there been break-ins, vandalism, or insurance claims at this property in the last 3 years? What carrier currently insures it and at what premium?
- What's the average days-on-market for RENTAL listings here right now (not sales)? A rising rental-DOM trend means longer vacancies and softer asking-rent achievability than the comps imply.
- What's the recent tenant-quality profile in this submarket — average credit score on applications, eviction rate, late-payment / NSF rate, and stable-employment percentage? A property-management company in the area should have these aggregated.
- How much new for-sale + rental construction is in the pipeline within 1–3 miles? Heavy new supply typically softens prices + rents 12–24 months out; constrained supply supports both.
Investment metrics
- 1% rule
- 1.76% ✓
- Cap rate
- 14.70%
- Cash-on-cash
- 30.03%
- DSCR
- 2.34
- GRM
- 4.7
CMA / ARV
- ARV (on-the-fly)
- $76,489
- Comps found
- 12
Show comp detail 12 sales within ~0.75 mi
| Address | Dist | Beds/Ba | Sqft | Sold | Price | $/sf | Match |
|---|---|---|---|---|---|---|---|
| 8860 Appoline St | 0.00mi | 5/1.5 | 1,561 (0%) | 4mo | $61,272 | $39 | 97 |
| 9181 Pinehurst St | 0.23mi | 4/2.0 (-1) | 1,500 (-4%) | 12mo | $50,000 | $33 | 65 |
| 9169 Ward St | 0.27mi | 4/1.5 (-1) | 1,468 (-6%) | 10mo | $10,000 | $7 | 64 |
| 5801 Oakman Blvd | 0.33mi | 4/1.5 (-1) | 1,451 (-7%) | 5mo | $160,000 | $110 | 64 |
| 9231 Sorrento St | 0.27mi | 5/2.0 | 1,389 (-11%) | 7mo | $165,000 | $119 | 61 |
| 9300 Cheyenne St | 0.38mi | 4/2.0 (-1) | 1,487 (-5%) | 8mo | $72,200 | $49 | 61 |
| 8205 Normile St | 0.61mi | 5/1.5 | 1,648 (+6%) | 10mo | $76,000 | $46 | 54 |
| 9946 Manor St | 0.69mi | 4/2.0 (-1) | 1,635 (+5%) | 10mo | $41,000 | $25 | 44 |
| 7722 Miller Rd | 0.73mi | 4/2.0 (-1) | 1,526 (-2%) | 15mo | $190,000 | $125 | 43 |
| 8930 Schaefer Hwy | 0.44mi | 4/2.0 (-1) | 1,400 (-10%) | 20mo | $100,000 | $71 | 38 |
| 7741 Miller Rd | 0.72mi | 4/2.0 (-1) | 1,389 (-11%) | 7mo | $280,000 | $202 | 35 |
| 9590 Schaefer Hwy | 0.68mi | 4/1.0 (-1) | 1,351 (-14%) | 10mo | $50,750 | $38 | 30 |
Match score weights: distance 35% · size 25% · config 20% · recency 20%. Top-matched comps best support the ARV.
Projected returns pro-forma
-3.0% appreciation · 0.0% rent growth · sell at horizon
- IRR
- 21.2%
- Equity multiple
- 1.83×
- Total profit
- $23,260
- Equity at exit
- $14,895
- IRR
- 27.2%
- Equity multiple
- 3.07×
- Total profit
- $57,833
- Equity at exit
- $8,638
Cash invested: $27,972 (down + closing). Projections, not guarantees.
Landlord ↔ Tenant lean methodology
- Overall (STATE)
- 62 Landlord-Friendly
- State Michigan
- 62 Landlord-Friendly · EVEN
- County
- — inherits STATE
- City
- — inherits STATE
ZIP-level market 48228
- Rents YoY
- -2.3%
- Active inventory
- 367
- Price-to-rent
- 4.7×
Monthly cashflow live
- Estimated rent
- $1,760 medium interval (Pro) →
- Mortgage (P&I)
- −$524
- Tax est. 1.5%
- −$125 /mo · $1,498/yr
- Insurance
- −$42
- HOA
- −$0
- Vacancy / Maint / Mgmt
- −$370
- Net cashflow
- $700
Break-even live
Sensitivity live
| Price | -10% $769 | -5% $734 | +0% $700 | +5% $665 | +10% $631 |
|---|---|---|---|---|---|
| Rent | -10% $561 | -5% $630 | +0% $700 | +5% $769 | +10% $839 |
| Rate | -1.0pp $750 | -0.5pp $725 | base $700 | +0.5pp $674 | +1.0pp $648 |
UW: 25.0% down · 7.5% · 30yr · 1.5% tax · 5.0% vac · 8.0% maint · 8.0% mgmt
Financing live
Cash to close
- Down payment
- $24,975
- Closing costs
- $2,997
- Reserves months
- —
- Total cash needed
- —
Loan-product check · same deal, 3 products live
Conventional
25% down · 7.5% · 30yr
- Down + closing
- —
- Monthly P&I
- —
- Monthly cashflow
- —
- DSCR
- —
- Eligible?
- —
Personal DTI + credit; lowest rate.
DSCR
20% down · 8.5% · 30yr
- Down + closing
- —
- Monthly P&I
- —
- Monthly cashflow
- —
- DSCR
- —
- Eligible?
- —
No personal income docs; deal must DSCR.
Hard money
10% down · 12.0% · 12mo
- Down + closing
- —
- Monthly P&I
- —
- Monthly cashflow
- —
- DSCR
- —
- Eligible?
- —
Short-term bridge; refi at stabilization.
Rent comps 2 comps
| Address | Beds | Baths | Sqft | Rent | $/sqft | DOM | Units | Dist |
|---|---|---|---|---|---|---|---|---|
| 8143 Wisconsin St Detroit, MI | 4.0 | 1.0 | 1370 | $1,800 | $1.31 | 0d | 1 | 0.86mi |
| 8331 Whitcomb St Detroit, MI | 4.0 | 1.0 | 1342 | $1,350 | $1.01 | 23d | 1 | 1.37mi |
Listing history 3 events
-
2026-06-21days on market $99,900 Active 4 DOM
-
2026-06-17remarks 681-char remark
Show marketing remark (737 chars)
Welcome to 8860 Appoline Street, a spacious Detroit brick home offering plenty of potential and room to grow. Featuring 5 bedrooms, 1.5 bathrooms, and over 1,500 square feet of living space, this home provides a functional layout with generous room sizes and classic character throughout. Whether you're an owner-occupant looking to make it your own or an investor seeking your next opportunity, this property has strong potential in an established Detroit neighborhood. Conveniently located near major roads, schools, shopping, and everyday amenities. Don't miss your chance to bring your vision to this great Detroit opportunity. Buyer and buyer's agent to verify all information. Sold as is. Buyer and agent to verify all information.
-
2026-06-17$99,900 Active 1 DOM
Show marketing remark (737 chars)
Welcome to 8860 Appoline Street, a spacious Detroit brick home offering plenty of potential and room to grow. Featuring 5 bedrooms, 1.5 bathrooms, and over 1,500 square feet of living space, this home provides a functional layout with generous room sizes and classic character throughout. Whether you're an owner-occupant looking to make it your own or an investor seeking your next opportunity, this property has strong potential in an established Detroit neighborhood. Conveniently located near major roads, schools, shopping, and everyday amenities. Don't miss your chance to bring your vision to this great Detroit opportunity. Buyer and buyer's agent to verify all information. Sold as is. Buyer and agent to verify all information.
ⓘ Source: listings_history table (triggers on properties + properties_extension) + one-shot
backfill from property_details.listing_events for pre-trigger history.
Climate risk First Street
- Flood 1/10 Low FEMA zone X (unshaded) · 0% chance over 30 yrs
- Wildfire 1/10 Low
- Heat 3/10 Moderate 7 d/yr ≥97°F today · 15 d/yr by 30 yrs out
- Wind 2/10 Low
- Air quality 3/10 Moderate 2 unhealthy d/yr today · 5 by 30 yrs out
Nearby sold comps map
Loading sold comps map…
Walkable amenities ~0.75 mi
Loading nearby amenities…
Taxation est. · year 1
- Rental income
- $21,119
- − Mortgage interest
- −$5,596
- − Property taxes
- −$1,498
- − Insurance
- −$500
- − Repairs & maintenance
- −$1,690
- − Management
- −$1,690
- − Depreciation
- −$2,906
- Taxable income
- $7,240
- Est. tax owed @ 24.0%
- −$1,738
- After-tax cash flow
- $6,662/yr
For passive investors: Depreciation is non-cash, so a rental often shows a tax loss while cash-flowing — sheltering income. Rental losses are passive: they offset passive income freely, and up to $25,000/yr can offset ordinary (W-2) income if you actively participate and your MAGI is under $100k (phasing out to $0 by $150k); unused losses carry forward. On sale, claimed depreciation is recaptured at up to 25%, and gains may owe capital-gains tax (a 1031 exchange can defer both). Figures are a year-1 estimate at your 24.0% rate — not tax advice; consult a CPA.
Schools (NCES district)
- District
- Detroit Public Schools Community District
- NCES district ID
- 2601103
- Math proficiency
- 10% ▼ -2.00%
- Reading proficiency
- 24% ▲ 6.00%
- Median HH income
- $25,815
- Composite
- 13.06/100
- National rank
- #9564
- State rank
- #499 of 540 in MI
Livability — Detroit
- Score
- 73/100
- State rank
- #218
- US rank
- #5427
Category grades
Schools grade is shown separately in the Schools card above.
Census & demographics
- Census place
- Detroit, MI
- County
- Wayne County · 1,562,939 people
- City population
- 572,865
- Metro
- Detroit-Warren-Dearborn, MI
- Population (ZIP)
- 50,117
- Household income
- $30,680
- Rent vs Own
- Severe rent burden
- 4144.0
Population outlook (Wayne County) Hauer SSP2
- Today (2025)
- 1,675,273 people
- By 2030
- 1,620,300 · -3.3%
- By 2040
- 1,502,341 · -10.3%
- By 2050
- 1,384,039 · -17.4%
- By 2075
- 1,124,592 · -32.9%
- By 2100
- 881,193 · -47.4%
Race, ethnicity, and origin ACS 2023
- Neighborhood character
- Predominantly Black (71%)
- Race & ethnicity
- Black 71% White 16% Two or more races 7% Hispanic / Latino 6%
- Hispanic origin (detail)
- Mexican 3% Puerto Rican 2%
- Common ancestry
- Arab 2% Romanian 2% Lithuanian 1%
- Foreign-born
- 11% · Canada
- Languages at home
- 82% English-only · Arabic 11% Spanish 5%
Political lean MEDSL · Wayne
- 2024 margin
- Strong D (+29.0) · D 62.7% · R 33.7% · Other 3.6%
- 2008→2024 swing
- -20.5pp toward R · 2008: 49.5pp · 2024: 29.0pp
- All cycles
- 2024: D+29.0 2020: D+38.1 2016: D+37.3 2012: D+46.9 2008: D+49.5
Not yet ingested
- Civics
- —
Market trends
- HPI YoY
- ▼ -160.81%
- Current HPI
- 168.6843
- Rent YoY
- ▼ -2.30%
- Metro
- Detroit-Warren-Dearborn, MI
- State GDP YoY
- ▲ 1.37%
- F500 in state
- 28
Industry mix (Fortune 500 HQ in MI)
| Industry | F500 HQs | Revenue |
|---|---|---|
| Automotive Parts | 3 | $48B |
|
||
| Automotive | 2 | $372B |
|
||
| Chemicals | 1 | $45B |
|
||
| Automotive Retail | 1 | $29B |
|
||
| Healthcare / Medical Devices | 1 | $23B |
|
||
| Automotive Technology | 1 | $20B |
|
||
Price history
+375.7% since first listed48 events — show timeline
- 2026-06-17 Listed $99,900 REALCOMP
- 2026-06-17 Listed $99,900 MiRealSource-MiMLS
- 2026-03-02 Sold (MLS) $61,272 MiRealSource-MiMLS
- 2026-03-02 Sold (MLS) $61,272 REALCOMP
- 2026-02-06 Pending — MiRealSource-MiMLS
- 2026-02-06 Pending — REALCOMP
- 2026-01-29 Listed $75,000 MiRealSource-MiMLS
- 2026-01-29 Listed $75,000 REALCOMP
- 2024-12-17 Pending — REALCOMP
- 2024-03-14 Sold (Public Records) $150,000 Public Records
- 2024-03-08 Sold (MLS) $150,000 MiRealSource-MiMLS
- 2024-03-08 Sold (MLS) $150,000 REALCOMP
- 2024-01-23 Pending — REALCOMP
- 2024-01-23 Pending — MiRealSource-MiMLS
- 2024-01-23 Pending — REALCOMP
- 2024-01-22 Listing Removed — MiRealSource-MiMLS
- 2024-01-22 Listing Removed — MiRealSource-MiMLS
- 2024-01-22 Listing Removed — REALCOMP
- 2024-01-08 Relisted — MiRealSource-MiMLS
- 2024-01-08 Relisted — REALCOMP
- 2024-01-03 Listed $150,000 MiRealSource-MiMLS
- 2024-01-03 Listed $150,000 REALCOMP
- 2024-01-01 Listing Removed — MiRealSource-MiMLS
- 2024-01-01 Listing Removed — REALCOMP
- 2023-12-06 Listed $160,000 MiRealSource-MiMLS
- 2023-12-06 Listed $160,000 REALCOMP
- 2023-11-29 Coming Soon $160,000 MiRealSource-MiMLS
- 2023-11-29 Coming Soon $160,000 REALCOMP
- 2012-08-08 Listing Removed — MiRealSource-MiMLS
- 2012-06-15 Listing Removed — REALCOMP
- 2012-04-06 Listed $50 REALCOMP
- 2012-04-06 Listed $50 MiRealSource-MiMLS
- 2011-08-15 Listing Removed — REALCOMP
- 2011-08-15 Listing Removed — MiRealSource-MiMLS
- 2011-05-15 Listed $3,000 REALCOMP
- 2011-05-15 Listed $3,000 MiRealSource-MiMLS
- 2010-12-22 Listing Removed — REALCOMP
- 2010-09-22 Listed $8,000 REALCOMP
- 2009-05-01 Sold (MLS) $1,000 REALCOMP
- 2008-10-17 Listed $8,400 REALCOMP
- 2008-03-12 Listing Removed — MiRealSource-MiMLS
- 2008-03-09 Listing Removed — REALCOMP
- 2007-12-18 Listing Removed — REALCOMP
- 2007-12-18 Listed $39,564 REALCOMP
- 2007-12-18 Listed $39,564 MiRealSource-MiMLS
- 2006-09-22 Listed $44,800 REALCOMP
- 2001-11-06 Sold (Public Records) $94,000 Public Records
- 2000-11-28 Sold (Public Records) $21,000 Public Records
Property tax history
+26.6%/yrLatest (2025): $5,380 · +426.8% YoY. Source: county tax records.
Cash-flow waterfall
monthlySold comps — $/sqft
last 12 mo · ≤1 miLoading sold comps…