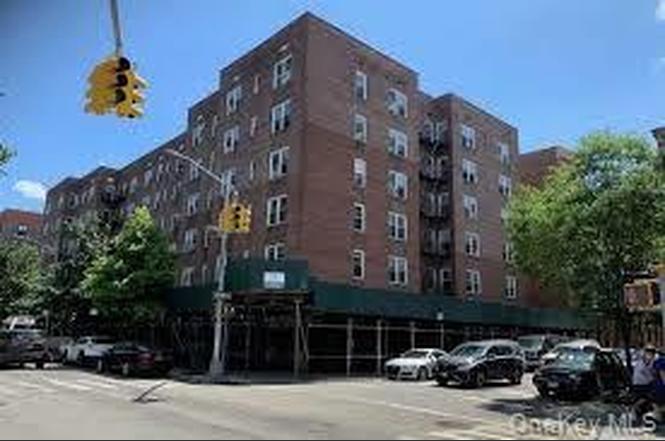
4240 Bowne St Unit 2j · New York, NY
Flood risk 1/10 · Minimal
- FEMA flood zone
- X (unshaded)
- Chance of flooding over 30 yrs
- 0.0%
- Est. flood insurance / yr
- $507 – $1,088
Fire risk 1/10 · Minimal
- Est. fire insurance / yr
- $691 – $1,283
Heat risk 6/10 · Moderate
- Hot days now (above 99°F)
- 7 days/yr
- Hot days in 30 yrs
- 14 days/yr
Wind risk 6/10 · Moderate
- Chance of severe wind over 30 yrs
- 27.0%
Air-quality risk 4/10 · Minor
- Unhealthy air days now
- 6 days/yr
- Unhealthy air days in 30 yrs
- 6 days/yr
Risk factors via First Street. Map © Google.
Why this score? — see what drove the F grade
The composite is a weighted blend of 9 inputs, each scored 0–100. Each bar is that input's sub-score; the figure is the points it added to the 100-point composite (weight × sub-score).
- ARV discount +7.5/15.0
- Appreciation +5.5/10.0
- Schools +5.0/10.0
- Livability +3.8/5.0
- Rent growth +3.5/5.0
- Cash flow +3.3/30.0
- 1% rule +2.8/10.0
- Condition / age +2.5/5.0
- DSCR +0.0/10.0
$359,000
🖨 Deal sheet (PDF) 📄 Offer letter ✓ Due diligence
Listing remarks
It is great located in the heart of Flushing. Full renovated flexible board facing east one large bedroom 1 bathroom co-op, 2 bedroom layout, eat in kitchen with window and hard wood floor, . Flexible board & Sunny apt on the second floor. Subletting immediately & Pets friendly. ( Cash Deal Only ) All rooms have window, about 900sqft, maintenance fee included heat, water, cooking gas and property tax. walking distant to all stores, supermarket, restaurants, schools and Means of transportation? Must see
Key facts
- Hard wood floor
- Full renovated
- Supermarket
Tags
Property features AI
Finance
- HOA & community: Building elevator(s); Association fees include gas, heat, hot water, water, sewer, trash, grounds care, exterior maintenance and other items
Exterior
- Parking: Parking waitlist; Parking fee applies
- Utilities: Electricity connected; Natural gas available; Water available; Sewer: other
- Home design: Stock cooperative
- Construction: Brick construction
- Exterior features: Brick exterior; Not waterfront
Interior
- Kitchen: Gas oven; Refrigerator
- Bedrooms: Entry level: 6
- Bathrooms: 1 full bathroom
- Heating & cooling: Wall/window air conditioning unit(s); Heating: other (see remarks)
- Interior features: Eat-in kitchen; Formal dining area; Multi/split levels; No basement; No attic; Total of 4 rooms
- Laundry & utility: No specific laundry details provided
Neighborhood map
What this means for you Summary
Snapshot
- This is a 1-bed/1.0-bath condo listed at $359k.
Deal economics
- At list price, monthly cash flow is $-1k ($-13k/yr) — negative.
- To cash-flow at today's rent, offer at most $319k (11.1% below list).
- To meet the 1% rule (rent ≥ 1% of price), the offer needs to be $279k (22.3% below list).
- Recommended offer: $279k (22.3% below list) — sets the bar for 1% rule.
Location & tenants
- Location reads 75/100 on livability (#268 in NY, #4,188 nationally) — a middle-class / working-renter tenant base. Strengths: amenities A+, commute A+, health & safety A; Watch: crime F, cost of living F.
- Zoned schools: Ps 20 John Bowne (math 58% / reading 55%, grade C+, #899 of 2,108 statewide, top 43%, 1,033 students, 87% FRL); Is 227 Louis Armstrong (math 52% / reading 69%, grade B+, #153 of 729 statewide, top 21%, 1,528 students, 68% FRL); Midwood High School (math 94% / reading 96%, grade A+, #83 of 1,100 statewide, top 8%, 4,062 students, 73% FRL).
- Market conditions: Rents rising (+3.9%/yr); 408 active listings in the ZIP; 40 comparable units currently listed for rent nearby; rentals at typical pace (median 27d on market — plan ~3-4 weeks tenant-placement turnaround); 5,302 units permitted in Queens County in 2024 (4,918 in 5+ unit buildings).
- At $2,791/mo this rent would consume 61% of the median local household income ($55k/yr) (locally 6765% of renters already pay >50% of income on rent) — very limited rent-growth headroom before tenants either downsize or default.
Forward outlook
- In year one you build about $6k of equity ($2k loan paydown + $4k appreciation (1.1% local appreciation)).
- Queens County population projected at +16% by 2050 — long-run rental-demand tailwind backs the buy-and-hold thesis.
- By year 6, paydown + projected appreciation supports a ~$36k cash-out refi (75% LTV) — recoverable capital for the next deal without selling this one.
Negotiation context
- It's been on market 432 days — a 12% lower offer ($316k) is reasonable based on typical stale-listing flexibility.
- 3 sale attempts since 10y ago with the ask held roughly flat each time — persistent listings suggest the price (not the market) is what's stuck; bring a comps-based counter.
Risks & watch-outs
- Watch-outs: HOA is 30% of rent; built in 1950 — expect roof / HVAC / electrical / plumbing capex.
- Climate carrying-cost: major wind risk, 27% chance of damaging wind over 30y; extreme-heat days projected 7→14/yr by 2055 (HVAC capex compounding) — expect insurance premiums to compound above CPI over the hold.
Questions for the listing agent
- What do current leases actually rent for vs. the listed asking? Can we see a recent rent roll and the last 12 months of T-12 income?
- It's been on market 432 days. Have you received any prior offers? Is the seller open to a 22% concession, seller financing, or rate buy-down credit?
- Built in 1950 — when were the roof, HVAC, electrical panel, plumbing, and water heater last replaced?
- What does the HOA fee cover, when was the last increase, and are there any pending special assessments or reserve-fund shortfalls?
- Any open or pending special assessments — roof, HVAC, plumbing, elevator, façade? What's the per-unit balance and payoff schedule, and is the seller paying it off at close or rolling it to the buyer?
- Why hasn't it sold? Are there any deal-killer items the seller is aware of (foundation, flood, title, zoning, code violations)?
- Is there a deadline driving the sale (1031 exchange, divorce, estate, relocation)? That informs how much negotiation room exists.
- Schools are B-rated — typically a magnet for longer-tenancy family renters. What's the average tenant stay here, and is there a school-zone premium baked into asking?
- Crime grade is F in this area — have there been break-ins, vandalism, or insurance claims at this property in the last 3 years? What carrier currently insures it and at what premium?
- The area grade is low — what's the realistic commute time and amenity access for the typical tenant pool here? Any planned neighborhood developments (good or bad) we should know about?
- What's the average days-on-market for RENTAL listings here right now (not sales)? A rising rental-DOM trend means longer vacancies and softer asking-rent achievability than the comps imply.
- What's the recent tenant-quality profile in this submarket — average credit score on applications, eviction rate, late-payment / NSF rate, and stable-employment percentage? A property-management company in the area should have these aggregated.
- How much new apartment / multifamily construction is in the pipeline within 1–3 miles? Heavy new supply (>2% of stock underway) typically softens rents 12–24 months out; light construction supports rent growth.
Investment metrics
- 1% rule
- 0.78% ✗
- Cap rate
- 2.57%
- Cash-on-cash
- -13.30%
- DSCR
- 0.41
- GRM
- 10.7
CMA / ARV
No comps found within radius.
Projected returns pro-forma
1.09% appreciation · 3.93% rent growth · sell at horizon
- IRR
- -11.6%
- Equity multiple
- 0.41×
- Total profit
- $-59,493
- Equity at exit
- $124,221
- IRR
- -4.8%
- Equity multiple
- 0.40×
- Total profit
- $-60,549
- Equity at exit
- $166,372
Cash invested: $100,520 (down + closing). Projections, not guarantees.
Landlord ↔ Tenant lean methodology
- Overall (CITY)
- 0 Strongly Tenant-Friendly
- State New York
- 15 Strongly Tenant-Friendly · D+10
- County
- — inherits STATE
- City New York
- 0 Strongly Tenant-Friendly · D+34
ZIP-level market 11355
- Home prices YoY
- 0.4%
- Rents YoY
- 3.9%
- Active inventory
- 408
- Price-to-rent
- 10.7×
Monthly cashflow live
- Estimated rent
- $2,791 high interval (Pro) →
- Mortgage (P&I)
- −$1,883
- Tax est. 1.5%
- −$449 /mo · $5,385/yr
- Insurance
- −$150
- HOA est. from 2 same-building comps
- −$838
- Lot rent
- −$0
- Vacancy / Maint / Mgmt
- −$586
- Net cashflow
- $-1,114
Break-even live
Sensitivity live
| Price | -10% $-866 | -5% $-990 | +0% $-1,114 | +5% $-1,238 | +10% $-1,362 |
|---|---|---|---|---|---|
| Rent | -10% $-1,335 | -5% $-1,224 | +0% $-1,114 | +5% $-1,004 | +10% $-894 |
| Rate | -1.0pp $-933 | -0.5pp $-1,023 | base $-1,114 | +0.5pp $-1,207 | +1.0pp $-1,302 |
UW: 25.0% down · 7.5% · 30yr · 1.5% tax · 5.0% vac · 8.0% maint · 8.0% mgmt
Financing live
Cash to close
- Down payment
- $89,750
- Closing costs
- $10,770
- Reserves months
- —
- Total cash needed
- —
Loan-product check · same deal, 3 products live
Conventional
25% down · 7.5% · 30yr
- Down + closing
- —
- Monthly P&I
- —
- Monthly cashflow
- —
- DSCR
- —
- Eligible?
- —
Personal DTI + credit; lowest rate.
DSCR
20% down · 8.5% · 30yr
- Down + closing
- —
- Monthly P&I
- —
- Monthly cashflow
- —
- DSCR
- —
- Eligible?
- —
No personal income docs; deal must DSCR.
Hard money
10% down · 12.0% · 12mo
- Down + closing
- —
- Monthly P&I
- —
- Monthly cashflow
- —
- DSCR
- —
- Eligible?
- —
Short-term bridge; refi at stabilization.
Rent comps 40 comps
| Address | Beds | Baths | Sqft | Rent | $/sqft | DOM | Units | Dist |
|---|---|---|---|---|---|---|---|---|
| 14427 Sanford Ave Unit 7G Flushing, NY | 2.0 | 1.0 | 655 | $3,500 | $5.34 | 27d | 1 | 0.26mi |
| 13618 Maple Ave Unit 5B Flushing, NY | 2.0 | 2.0 | 836 | $3,490 | $4.17 | 27d | 1 | 0.29mi |
| 14731 Barclay Ave Flushing, NY | 2.0 | 1.0 | 900 | $2,500 | $2.78 | 27d | 1 | 0.45mi |
| 133-08 41st Rd Flushing, NY | 2.0 | 1.0 | 700 | $2,300 | $3.29 | 27d | 1 | 0.47mi |
| 13835 39th Ave Flushing, NY | 2.0–3.0 | 2.0 | 1000 | $4,500 | $4.50 | 4d | 2 | 0.47mi |
| 13835 39th Ave Flushing, NY | 2.0 | 2.0 | 1014 | $4,350 | $4.29 | 27d | 2 | 0.47mi |
| 133-38 Avery Ave Unit 3F-B Flushing, NY | 2.0 | 2.0 | 884 | $2,600 | $2.94 | 26d | 1 | 0.49mi |
| 14238 37th Ave Unit 4C Flushing, NY | 2.0 | 2.0 | 820 | $2,800 | $3.41 | 27d | 1 | 0.50mi |
| 13239 Pople Ave Unit 6D Flushing, NY | 1.0 | 1.0 | 750 | $2,500 | $3.33 | 7d | 1 | 0.52mi |
| 14424 37th Ave Unit 5B Flushing, NY | 2.0 | 1.0 | 560 | $2,800 | $5.00 | 27d | 1 | 0.53mi |
| 149-08 41st Ave Unit 3rd Floor Flushing, NY | 1.0 | 1.0 | 675 | $1,850 | $2.74 | 21d | 1 | 0.54mi |
| 13675 37th Ave Unit 3H Flushing, NY | 1.0 | 1.0 | 750 | $3,500 | $4.67 | 1d | 1 | 0.54mi |
| 40-10 149th St Fl 1 Flushing, NY | 2.0 | 1.0 | 900 | $2,200 | $2.44 | 17d | 1 | 0.55mi |
| 13226 Avery Ave Unit 8A Flushing, NY | 2.0 | 2.0 | 725 | $2,800 | $3.86 | 6d | 1 | 0.55mi |
| 36-20 Parsons Blvd Unit 5D Flushing, NY | 2.0 | 1.0 | 900 | $2,600 | $2.89 | 17d | 1 | 0.55mi |
| 14489 38th Ave Unit 4C Flushing, NY | 1.0 | 1.0 | 790 | $2,400 | $3.04 | 27d | 1 | 0.56mi |
| 3641 Union St Unit 2B Flushing, NY | 2.0 | 1.0 | 968 | $3,100 | $3.20 | 27d | 1 | 0.56mi |
| 13222 41st Rd #501 Flushing, NY | 2.0 | 2.0 | 843 | $3,400 | $4.03 | 27d | 1 | 0.56mi |
| 3916 Prince St Flushing, NY | 1.0 | 1.0 | 530 | $2,900 | $5.47 | 17d | 2 | 0.56mi |
| 13208 Pople Ave Unit 4A Flushing, NY | 1.0 | 1.0 | 650 | $2,500 | $3.85 | 27d | 1 | 0.57mi |
| 13203 Sanford Ave Unit 7E Flushing, NY | 2.0 | 2.0 | 702 | $2,800 | $3.99 | 27d | 1 | 0.58mi |
| 4105 College Point Blvd Unit 5I Flushing, NY | 2.0 | 2.0 | 600 | $2,600 | $4.33 | 6d | 1 | 0.60mi |
| 4142 College Point Blvd Unit 6A Flushing, NY | 2.0 | 2.0 | 868 | $3,000 | $3.46 | 4d | 1 | 0.61mi |
| 13812 Northern Blvd Unit 7F Flushing, NY | 1.0 | 1.0 | 600 | $2,500 | $4.17 | 14d | 1 | 0.62mi |
| 141-25 Northern Blvd Unit A14 Flushing, NY | 1.0 | 1.0 | 880 | $2,350 | $2.67 | 13d | 1 | 0.63mi |
| 137-02 Northern Blvd Unit 6K Flushing, NY | 2.0 | 1.0 | 900 | $2,850 | $3.17 | 13d | 1 | 0.64mi |
| 137-02 Northern Blvd Apt 5B Flushing, NY | 2.0 | 1.0 | 900 | $2,900 | $3.22 | 0d | 1 | 0.64mi |
| 13327 39th Ave Unit 3N Flushing, NY | 1.0 | 1.0 | 720 | $3,600 | $5.00 | 27d | 1 | 0.66mi |
| 13702 Northern Blvd Flushing, NY | 1.0–2.0 | 1.0 | 850 | $2,550 | $3.00 | 0d | 2 | 0.66mi |
| 13702 Northern Blvd Flushing, NY | 1.0–2.0 | 1.0 | 850 | $2,600 | $3.06 | 10d | 2 | 0.66mi |
| 4022 College Point Blvd Flushing, NY | 1.0–2.0 | 1.0–2.0 | 983 | $3,200 | $3.25 | 27d | 2 | 0.66mi |
| 13101 40th Rd Unit 2P Flushing, NY | 1.0 | 1.0 | 761 | $3,300 | $4.34 | 27d | 1 | 0.67mi |
| 4028 College Point Blvd #912 Flushing, NY | 2.0 | 2.0 | 1083 | $4,200 | $3.88 | 27d | 1 | 0.67mi |
| 14809 Northern Blvd Flushing, NY | 2.0–3.0 | 2.0 | 1056 | $3,500 | $3.31 | 17d | 2 | 0.70mi |
| 13119 Fowler Ave Unit 7C Flushing, NY | 2.0 | 2.0 | 810 | $3,300 | $4.07 | 21d | 1 | 0.72mi |
| 150-01 Northern Blvd Flushing, NY | 2.0 | 2.0 | 850 | $2,800 | $3.29 | 27d | 1 | 0.75mi |
| 140-16 34th Ave Unit 308 Flushing, NY | — | 1.0 | 600 | $2,250 | $3.75 | 27d | 1 | 0.75mi |
| 140-16 34th Ave Unit 412 Flushing, NY | — | 1.0 | 600 | $2,250 | $3.75 | 8d | 1 | 0.75mi |
| 140-16 34th Ave Unit 1113 Flushing, NY | 2.0 | 1.0 | 900 | $3,000 | $3.33 | 27d | 1 | 0.75mi |
| 145-18 34th Ave Unit 8A Flushing, NY | 1.0 | 2.0 | 700 | $2,400 | $3.43 | 4d | 1 | 0.76mi |
HOA detail condo
- Monthly dues
- $0 · $0/yr
- Likely covers
- watergas
- Assessments
- None detected in remarks — confirm with the listing agent.
Listing history 10 events
-
2026-05-22soldstatus $359,000 Closed
-
2026-05-21status Pending
-
2025-11-26price $359,000
-
2025-09-09price $349,000
-
2025-09-09price $358,000
-
2025-03-15$369,000 Active
-
2018-09-01historical
-
2018-02-23$300,000 New
-
2016-10-12historical
-
2016-10-06$239,000 New
ⓘ Source: listings_history table (triggers on properties + properties_extension) + one-shot
backfill from property_details.listing_events for pre-trigger history.
Climate risk First Street
- Flood 1/10 Low FEMA zone X (unshaded) · 0% chance over 30 yrs
- Wildfire 1/10 Low
- Heat 6/10 Major 7 d/yr ≥99°F today · 14 d/yr by 30 yrs out
- Wind 6/10 Major 27% chance of damaging wind over 30 yrs
- Air quality 4/10 Moderate 6 unhealthy d/yr today · 6 by 30 yrs out
Nearby sold comps map
Loading sold comps map…
Walkable amenities ~0.75 mi
Loading nearby amenities…
Taxation est. · year 1
- Rental income
- $33,490
- − Mortgage interest
- −$20,110
- − Property taxes
- −$5,385
- − Insurance
- −$1,795
- − Repairs & maintenance
- −$2,679
- − Management
- −$2,679
- − HOA
- −$10,056
- − Depreciation
- −$10,444
- Taxable loss
- −$19,657
- Est. tax savings @ 24.0%
- +$4,718
- After-tax cash flow
- $-8,653/yr
For passive investors: Depreciation is non-cash, so a rental often shows a tax loss while cash-flowing — sheltering income. Rental losses are passive: they offset passive income freely, and up to $25,000/yr can offset ordinary (W-2) income if you actively participate and your MAGI is under $100k (phasing out to $0 by $150k); unused losses carry forward. On sale, claimed depreciation is recaptured at up to 25%, and gains may owe capital-gains tax (a 1031 exchange can defer both). Figures are a year-1 estimate at your 24.0% rate — not tax advice; consult a CPA.
Schools (NCES district)
No district data.
Livability — New York
- Score
- 75/100
- State rank
- #268
- US rank
- #4188
Category grades
Schools grade is shown separately in the Schools card above.
Census & demographics
- Census place
- New York, NY
- County
- Queens County · 1,914,869 people
- City population
- 7,731,280
- Metro
- New York-Newark-Jersey City, NY-NJ-PA
- Population (ZIP)
- 80,801
- Household income
- $55,326
- Rent vs Own
- Severe rent burden
- 6765.0
Population outlook (Queens County) Hauer SSP2
- Today (2025)
- 2,546,320 people
- By 2030
- 2,643,059 · +3.8%
- By 2040
- 2,815,563 · +10.6%
- By 2050
- 2,944,423 · +15.6%
- By 2075
- 3,123,338 · +22.7%
- By 2100
- 3,098,688 · +21.7%
Race, ethnicity, and origin ACS 2023
- Neighborhood character
- Predominantly Asian (75%)
- Race & ethnicity
- Asian 75% Hispanic / Latino 14% White 7% Two or more races 4% Black 2%
- Hispanic origin (detail)
- Mexican 2% Puerto Rican 2% Dominican 2%
- Common ancestry
- Scotch-Irish 1%
- Foreign-born
- 72% · China, Canada, South Korea
- Languages at home
- 16% English-only · Chinese 58% Spanish 12% Other Indo-European 6%
Political lean MEDSL · Queens
- 2024 margin
- Strong D (+24.6) · D 62.3% · R 37.7%
- 2008→2024 swing
- -26.2pp toward R · 2008: 50.8pp · 2024: 24.6pp
- All cycles
- 2024: D+24.6 2020: D+45.2 2016: D+53.4 2012: D+58.5 2008: D+50.8
Not yet ingested
- Civics
- —
Market trends
- HPI YoY
- ▲ 1.09%
- Current HPI
- 253.1482
- Rent YoY
- ▲ 3.93%
- Metro
- New York-Newark-Jersey City, NY-NJ-PA
- State GDP YoY
- ▲ 2.60%
- F500 in state
- 92
Industry mix (Fortune 500 HQ in NY)
| Industry | F500 HQs | Revenue |
|---|---|---|
| Financial Services | 10 | $950B |
|
||
| Consumer Goods | 9 | $162B |
|
||
| Insurance | 4 | $225B |
|
||
| Telecommunications | 2 | $144B |
|
||
| Pharmaceuticals | 2 | $112B |
|
||
| Media / Entertainment | 2 | $69B |
|
||
Price history
+50.2% since first listed10 events — show timeline
- 2026-05-22 Sold (MLS) $359,000 OneKey® MLS as Distributed by MLS Grid
- 2026-05-21 Pending — OneKey® MLS as Distributed by MLS Grid
- 2025-11-26 Price Changed $359,000 OneKey® MLS as Distributed by MLS Grid
- 2025-09-09 Price Changed $349,000 OneKey® MLS as Distributed by MLS Grid
- 2025-09-09 Price Changed $358,000 OneKey® MLS as Distributed by MLS Grid
- 2025-03-15 Listed $369,000 OneKey® MLS as Distributed by MLS Grid
- 2018-09-01 Listing Removed — OneKey® MLS as Distributed by MLS Grid
- 2018-02-23 Listed $300,000 OneKey® MLS as Distributed by MLS Grid
- 2016-10-12 Listing Removed — OneKey® MLS as Distributed by MLS Grid
- 2016-10-06 Listed $239,000 OneKey® MLS as Distributed by MLS Grid
Cash-flow waterfall
monthlySold comps — $/sqft
last 12 mo · ≤1 miLoading sold comps…