 🏗️ New Construction
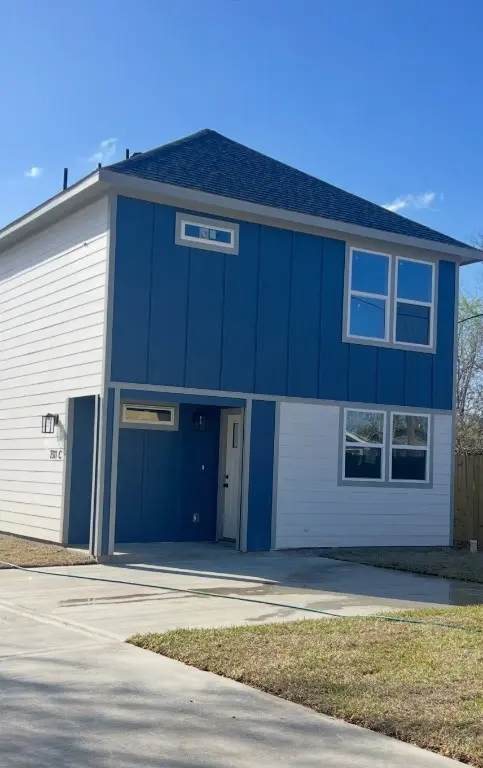
7311 Wileyvale St Unit B · Houston, TX
Flood risk 1/10 · Minimal
- FEMA flood zone
- X (unshaded)
- Chance of flooding over 30 yrs
- 0.0%
- Est. flood insurance / yr
- $507 – $1,088
Fire risk 1/10 · Minimal
- Est. fire insurance / yr
- $1,222 – $2,270
Heat risk 9/10 · Severe
- Hot days now (above 109°F)
- 7 days/yr
- Hot days in 30 yrs
- 23 days/yr
Wind risk 9/10 · Severe
- Chance of severe wind over 30 yrs
- 99.0%
Air-quality risk 3/10 · Minor
- Unhealthy air days now
- 2 days/yr
- Unhealthy air days in 30 yrs
- 3 days/yr
Risk factors via First Street. Map © Google.
Why this score? — see what drove the C grade
The composite is a weighted blend of 9 inputs, each scored 0–100. Each bar is that input's sub-score; the figure is the points it added to the 100-point composite (weight × sub-score).
- Cash flow +16.3/30.0
- Appreciation +9.3/10.0
- ARV discount +7.5/15.0
- DSCR +5.0/10.0
- 1% rule +4.8/10.0
- Condition / age +4.0/5.0
- Livability +3.7/5.0
- Schools +2.7/10.0
- Rent growth +2.6/5.0
$195,000
🖨 Deal sheet (PDF) 📄 Offer letter ✓ Due diligence
Listing remarks
This stunning home features an open-concept layout, perfect for modern living and entertaining. With three full bathrooms, there's plenty of space for everyone. The first-floor bedroom includes a full bath, making it an ideal guest suite or a private retreat. Spacious and inviting, this home is designed to meet all your needs.
Key facts
- 3,771 sq ft lot
- Built 2025
- Listed 47 days
Property features AI
Exterior
- Utilities: Public water; Public sewer
- Home design: Residential property; New construction (2025); Single-story entry (slab foundation)
- Construction: Cement siding; Composition roof; Slab foundation; Built in 2025; New construction by Europa Homes
- Exterior features: Located in a subdivision
Interior
- Kitchen: Dishwasher; Electric range; Microwave
- Bedrooms: 3 total rooms
- Bathrooms: 3 full bathrooms
- Heating & cooling: Central heating (electric); Central air (electric)
- Interior features: Kitchen/family room combo; Kitchen/dining combo; Dishwasher; Electric range; Microwave
- Laundry & utility: Washer hookup; Electric dryer hookup
Neighborhood map
What this means for you Summary
Snapshot
- This is a 3-bed/2.5-bath single-family listed at $195k. Condition is rated good.
Deal economics
- At list price, monthly cash flow is $111 ($1k/yr) — positive.
- The deal already cash-flows at list — no discount required.
- Meets the 1% rule at list price ($2k rent vs $195k).
- Recommended offer: $189k (3.0% below list) — sets the bar for market timing.
- Cap rate 6.9% vs local median 3.2% in Houston — top-decile yield for the area; either an underpriced asset or a hidden risk that comps aren't pricing in. Stress-test before assuming the spread holds.
Location & tenants
- Location reads 74/100 on livability (#184 in TX, #4,771 nationally) — a middle-class / working-renter tenant base. Strengths: amenities A+, cost of living A+, housing A+; Watch: crime F.
- Houston ISD (urban): math 27% / reading 35% proficiency, ranked #593 of 826 in TX (top 72%) — families likely to look elsewhere, expect single-tenant / working-renter base with shorter leases; 71% free/reduced lunch — lower-income household profile, screen leases tightly.
- Zoned schools: Cook Jr El (math 22% / reading 37%, grade F, #2,525 of 4,322 statewide, top 62%, 519 students, 96% FRL); Key Middle (math 10% / reading 20%, grade F, #1,569 of 1,662 statewide, top 95%, 615 students, 100% FRL); Kashmere H S (math 14% / reading 22%, grade F, #1,445 of 1,632 statewide, top 89%, 725 students, 96% FRL) — zoned schools average 97% FRL vs 71% district-wide (26 pts higher); higher-poverty schools than district average — tighter screening recommended.
- Market conditions: Rents flat; 377 active listings in the ZIP; 23 comparable units currently listed for rent nearby; rentals lingering (median 46d on market — plan ~5-8 weeks vacancy on turnover, expect pricing pressure); 57% of comp listings sitting > 30 days — soft ceiling on asking rent; 29,883 units permitted in Harris County in 2024 (8,621 in 5+ unit buildings).
- At $2,001/mo this rent would consume 50% of the median local household income ($48k/yr) (locally 1297% of renters already pay >50% of income on rent) — very limited rent-growth headroom before tenants either downsize or default.
Forward outlook
- In year one you build about $19k of equity ($1k loan paydown + $18k appreciation (8.7% local appreciation)).
- Harris County population projected at +47% by 2050 — long-run rental-demand tailwind backs the buy-and-hold thesis.
- At projected returns (8.7% appreciation + 0.4% rent growth), your $57k cash investment doubles in ~3 years — after that, you're playing with house money.
- By year 2, paydown + projected appreciation supports a ~$31k cash-out refi (75% LTV) — recoverable capital for the next deal without selling this one.
Negotiation context
- It's been on market 48 days — a 3% lower offer ($189k) is reasonable based on typical stale-listing flexibility.
- 3 sale attempts with the ask held roughly flat each time — persistent listings suggest the price (not the market) is what's stuck; bring a comps-based counter.
Risks & watch-outs
- Climate carrying-cost: severe wind risk, 99% chance of damaging wind over 30y; extreme-heat days projected 7→23/yr by 2055 (HVAC capex compounding) — expect insurance premiums to compound above CPI over the hold.
Questions for the listing agent
- It's been on market 48 days. Have you received any prior offers? Is the seller open to a 3% concession, seller financing, or rate buy-down credit?
- Is there a deadline driving the sale (1031 exchange, divorce, estate, relocation)? That informs how much negotiation room exists.
- Schools are D-rated, which usually means shorter tenancies and higher turnover. Who's the typical renter profile here, and what's been the actual vacancy rate?
- Crime grade is F in this area — have there been break-ins, vandalism, or insurance claims at this property in the last 3 years? What carrier currently insures it and at what premium?
- What's the average days-on-market for RENTAL listings here right now (not sales)? A rising rental-DOM trend means longer vacancies and softer asking-rent achievability than the comps imply.
- What's the recent tenant-quality profile in this submarket — average credit score on applications, eviction rate, late-payment / NSF rate, and stable-employment percentage? A property-management company in the area should have these aggregated.
- How much new for-sale + rental construction is in the pipeline within 1–3 miles? Heavy new supply typically softens prices + rents 12–24 months out; constrained supply supports both.
Investment metrics
- 1% rule
- 0.98% ✗
- Cap rate
- 6.94%
- Cash-on-cash
- 2.33%
- DSCR
- 1.10
- GRM
- 8.5
CMA / ARV
- ARV (median comp)
- $205,211
- List price
- $195,000
- Delta
- -4.98%
- Verdict
- FAIR
- Comps
- 20 within 1.0 mi
Show comp detail 12 sales within ~0.75 mi
| Address | Dist | Beds/Ba | Sqft | Sold | Price | $/sf | Match |
|---|---|---|---|---|---|---|---|
| 7311 Wileyvale Rd Unit A | 0.00mi | 3/3.0 | 1,280 (0%) | 6mo | $199,000 | $155 | 93 |
| 7312 Wileyvale Rd Unit D | 0.07mi | 3/3.0 | 1,192 (-7%) | 2mo | $199,000 | $167 | 82 |
| 7312 Wileyvale Dr Unit C | 0.07mi | 3/3.0 | 1,192 (-7%) | 2mo | $199,000 | $167 | 81 |
| 7309 Wileyvale St Unit B | 0.02mi | 3/3.0 | 1,221 (-5%) | 10mo | $209,000 | $171 | 81 |
| 7312 Wileyvale Dr Unit E | 0.05mi | 3/3.0 | 1,192 (-7%) | 6mo | $209,000 | $175 | 79 |
| 7312 Wileyvale Dr Unit A | 0.07mi | 3/3.0 | 1,192 (-7%) | 6mo | $209,000 | $175 | 79 |
| 5123 Denmark St | 0.13mi | 3/2.0 | 1,196 (-7%) | 5mo | $220,000 | $184 | 77 |
| 6905 Shotwell St | 0.36mi | 3/1.0 | 1,226 (-4%) | 8mo | $140,000 | $114 | 64 |
| 6713 Shotwell St | 0.43mi | 3/2.0 | 1,347 (+5%) | 7mo | $230,000 | $171 | 63 |
| 7302 Sandra St | 0.22mi | 3/1.0 | 1,460 (+14%) | 1mo | $239,900 | $164 | 60 |
| 7921 Pointer St | 0.61mi | 2/2.0 (-1) | 1,144 (-11%) | 1mo | $180,000 | $157 | 46 |
| 6217 Wipprecht St | 0.74mi | 2/2.0 (-1) | 1,128 (-12%) | 8mo | $140,000 | $124 | 32 |
Match score weights: distance 35% · size 25% · config 20% · recency 20%. Top-matched comps best support the ARV.
Projected returns pro-forma
8.65% appreciation · 0.44% rent growth · sell at horizon
- IRR
- 22.2%
- Equity multiple
- 2.66×
- Total profit
- $95,255
- Equity at exit
- $165,046
- IRR
- 19.4%
- Equity multiple
- 5.57×
- Total profit
- $262,540
- Equity at exit
- $336,740
Cash invested: $57,459 (down + closing). Projections, not guarantees.
Landlord ↔ Tenant lean methodology
- Overall (STATE)
- 87 Strongly Landlord-Friendly
- State Texas
- 87 Strongly Landlord-Friendly · R+5
- County
- — inherits STATE
- City
- — inherits STATE
ZIP-level market 77016
- Home prices YoY
- 2.8%
- Rents YoY
- 0.4%
- Active inventory
- 377
- Price-to-rent
- 8.1×
Monthly cashflow live
- Estimated rent
- $2,001 high interval (Pro) →
- Mortgage (P&I)
- −$1,076
- Tax from tax record
- −$308 /mo · $3,698/yr
- Insurance
- −$86
- HOA
- −$0
- Lot rent
- −$0
- Vacancy / Maint / Mgmt
- −$420
- Net cashflow
- $111
Break-even live
Sensitivity live
| Price | -10% $228 | -5% $169 | +0% $111 | +5% $53 | +10% $-5 |
|---|---|---|---|---|---|
| Rent | -10% $-47 | -5% $32 | +0% $111 | +5% $190 | +10% $269 |
| Rate | -1.0pp $215 | -0.5pp $164 | base $111 | +0.5pp $58 | +1.0pp $4 |
UW: 25.0% down · 7.5% · 30yr · 1.5% tax · 5.0% vac · 8.0% maint · 8.0% mgmt
Financing live
Cash to close
- Down payment
- $51,303
- Closing costs
- $6,156
- Reserves months
- —
- Total cash needed
- —
Loan-product check · same deal, 3 products live
Conventional
25% down · 7.5% · 30yr
- Down + closing
- —
- Monthly P&I
- —
- Monthly cashflow
- —
- DSCR
- —
- Eligible?
- —
Personal DTI + credit; lowest rate.
DSCR
20% down · 8.5% · 30yr
- Down + closing
- —
- Monthly P&I
- —
- Monthly cashflow
- —
- DSCR
- —
- Eligible?
- —
No personal income docs; deal must DSCR.
Hard money
10% down · 12.0% · 12mo
- Down + closing
- —
- Monthly P&I
- —
- Monthly cashflow
- —
- DSCR
- —
- Eligible?
- —
Short-term bridge; refi at stabilization.
Rent comps 23 comps
| Address | Beds | Baths | Sqft | Rent | $/sqft | DOM | Units | Dist |
|---|---|---|---|---|---|---|---|---|
| 7740 Wileyvale Rd Unit B Houston, TX | 3.0 | 2.0 | 1500 | $3,000 | $2.00 | 46d | 1 | 0.33mi |
| 5609 Denmark St Unit A Houston, TX | 3.0 | 2.0 | 1410 | $1,595 | $1.13 | 46d | 1 | 0.43mi |
| 4626 Shreveport Blvd Unit B Houston, TX | 3.0 | 2.0 | 1150 | $1,490 | $1.30 | 16d | 1 | 0.52mi |
| 6315 Sandra St Unit A Houston, TX | 3.0 | 2.0 | 1150 | $1,399 | $1.22 | 46d | 1 | 0.60mi |
| 4326 Plaag St Unit B Houston, TX | 3.0 | 2.5 | 1150 | $1,595 | $1.39 | 46d | 1 | 0.75mi |
| 8508 Wileyvale Rd Houston, TX | 2.0 | 2.0 | 1504 | $1,650 | $1.10 | 46d | 1 | 0.81mi |
| 8639 Peachtree St Unit A Houston, TX | 3.0 | 2.5 | 1150 | $1,750 | $1.52 | 46d | 1 | 0.93mi |
| 3812 Lynnfield St Houston, TX | 3.0 | 2.0 | 1298 | $1,545 | $1.19 | 7d | 1 | 1.04mi |
| 3810 Lynnfield St Houston, TX | 3.0 | 2.0 | 1298 | $1,599 | $1.23 | 17d | 1 | 1.05mi |
| 4030 Reid St Houston, TX | 3.0 | 2.0 | 1680 | $2,000 | $1.19 | 46d | 1 | 1.11mi |
| 7119 Bywood St Unit A Houston, TX | 3.0 | 2.5 | 1150 | $1,795 | $1.56 | 46d | 1 | 1.23mi |
| 3222 Bostic St Unit 1571615P Houston, TX | 3.0 | 2.5 | 1593 | $5,423 | $3.40 | 1d | 1 | 1.36mi |
| 5435 Pardee St Houston, TX | 2.0 | 1.0 | 1634 | $1,000 | $0.61 | 46d | 1 | 1.37mi |
| 8318 Curry Rd Houston, TX | 3.0 | 2.0 | 1558 | $2,299 | $1.48 | 46d | 1 | 1.39mi |
| 5414 Pardee St Houston, TX | 3.0 | 2.0 | 1100 | $1,500 | $1.36 | 46d | 1 | 1.40mi |
| 8320 Curry Rd Houston, TX | 3.0 | 2.5 | 1558 | $8,950 | $5.74 | 24d | 1 | 1.40mi |
| 8320 Curry Rd Unit 1391267P Houston, TX | 3.0 | 2.5 | 1550 | $5,033 | $3.25 | 1d | 1 | 1.40mi |
| 8322 Curry Rd Houston, TX | 3.0 | 2.5 | 1599 | $2,500 | $1.56 | 46d | 1 | 1.40mi |
| 3208 Bostic St Unit 1254540P Houston, TX | 3.0 | 2.0 | 1603 | $3,673 | $2.29 | 1d | 1 | 1.40mi |
| 8326 Curry Rd Unit 1227052P Houston, TX | 3.0 | 2.0 | 1270 | $3,317 | $2.61 | 1d | 1 | 1.41mi |
| 8326 Curry Rd Unit 1228882P Houston, TX | 3.0 | 2.0 | 1614 | $2,878 | $1.78 | 10d | 1 | 1.41mi |
| 7320 Jensen Dr Houston, TX | 1.0–3.0 | 1.0–2.0 | 935 | $1,176 | $1.26 | 4d | 5 | 1.47mi |
| 3107 Melbourne St Houston, TX | 3.0 | 1.0 | 956 | $1,500 | $1.57 | 46d | 1 | 1.50mi |
Listing history 20 events
-
2026-06-22days on market $195,000 Active 48 DOM
-
2026-06-21days on market $195,000 Active 47 DOM
-
2026-06-18days on market $195,000 Active 44 DOM
-
2026-06-17days on market $195,000 Active 43 DOM
-
2026-06-16days on market $195,000 Active 42 DOM
-
2026-06-15days on market $195,000 Active 41 DOM
-
2026-06-13days on market $195,000 Active 39 DOM
-
2026-06-10days on market $195,000 Active 35 DOM
-
2026-06-08days on market $195,000 Active 34 DOM
-
2026-06-07days on market $195,000 Active 33 DOM
-
2026-06-04days on market $195,000 Active 30 DOM
-
2026-06-01days on market $195,000 Active 27 DOM
-
2026-05-31days on market $195,000 Active 26 DOM
-
2026-05-05$199,000 Active 328-char remark
-
2025-12-25historical
-
2025-09-16price $199,000
-
2025-06-05historical $1,750
-
2025-03-27price $1,750
-
2025-03-26$1,700
-
2025-03-25$209,000 Active
ⓘ Source: listings_history table (triggers on properties + properties_extension) + one-shot
backfill from property_details.listing_events for pre-trigger history.
Tax reassessment forecast TX · Resets to sale price
- Current annual tax
- $3,698 · $308/mo
- Projected year-2 tax
- $3,698 · $308/mo
- Expected delta
- $0/yr ($0/mo · 0.0%)
ⓘ Screening estimate from a state-policy table — verify with the county assessor before closing.
Climate risk First Street
- Flood 1/10 Low FEMA zone X (unshaded) · 0% chance over 30 yrs
- Wildfire 1/10 Low
- Heat 9/10 Extreme 7 d/yr ≥109°F today · 23 d/yr by 30 yrs out
- Wind 9/10 Extreme 99% chance of damaging wind over 30 yrs
- Air quality 3/10 Moderate 2 unhealthy d/yr today · 3 by 30 yrs out
Nearby sold comps map
Loading sold comps map…
Walkable amenities ~0.75 mi
Loading nearby amenities…
Taxation est. · year 1
- Rental income
- $24,018
- − Mortgage interest
- −$11,495
- − Property taxes
- −$3,698
- − Insurance
- −$1,026
- − Repairs & maintenance
- −$1,921
- − Management
- −$1,921
- − Depreciation
- −$5,970
- Taxable loss
- −$2,014
- Est. tax savings @ 24.0%
- +$483
- After-tax cash flow
- $1,820/yr
For passive investors: Depreciation is non-cash, so a rental often shows a tax loss while cash-flowing — sheltering income. Rental losses are passive: they offset passive income freely, and up to $25,000/yr can offset ordinary (W-2) income if you actively participate and your MAGI is under $100k (phasing out to $0 by $150k); unused losses carry forward. On sale, claimed depreciation is recaptured at up to 25%, and gains may owe capital-gains tax (a 1031 exchange can defer both). Figures are a year-1 estimate at your 24.0% rate — not tax advice; consult a CPA.
Condition & rehab AI · 6 photos
This modern, move-in-ready home features an open-concept layout, three full bathrooms, and a well-maintained exterior. It offers a good starting point for potential buyers or tenants, with minor updates that could significantly enhance its value.
Value-add opportunities
- Both Painting the exterior and interior walls — Fresh paint can enhance curb appeal and interior aesthetics.
- Both Landscaping improvements — Enhanced landscaping can increase curb appeal and property value.
- Both Adding smart home features — Smart home features can increase property value and attract tech-savvy buyers/tenants.
- Both Upgrading the kitchen appliances — Modern appliances can make the kitchen more functional and appealing to potential buyers/tenants.
Renovation cost estimate screening
Value-add ROI direction
- Both Painting the exterior and interior walls — Fresh paint can enhance curb appeal and interior aesthetics. ↑
- Both Landscaping improvements — Enhanced landscaping can increase curb appeal and property value. ↑
- Both Adding smart home features — Smart home features can increase property value and attract tech-savvy buyers/tenants. ↑
- Both Upgrading the kitchen appliances — Modern appliances can make the kitchen more functional and appealing to potential buyers/tenants. ↑
ⓘ Cost ranges are severity-bucket heuristics (US national rule-of-thumb). Get contractor quotes + a written scope before underwriting a rehab budget.
Schools (NCES district)
- District
- Houston ISD
- NCES district ID
- 4823640
- Math proficiency
- 27% ▼ -18.00%
- Reading proficiency
- 35% ▼ -6.00%
- Median HH income
- $46,054
- Composite
- 26.63/100
- National rank
- #7173
- State rank
- #593 of 826 in TX
Livability — Houston
- Score
- 74/100
- State rank
- #184
- US rank
- #4771
Category grades
Schools grade is shown separately in the Schools card above.
Census & demographics
- Census place
- Houston, TX
- County
- Harris County · 4,702,590 people
- City population
- 3,226,434
- Metro
- Houston-The Woodlands-Sugar Land, TX
- Population (ZIP)
- 29,841
- Household income
- $47,677
- Rent vs Own
- Severe rent burden
- 1297.0
Population outlook (Harris County) Hauer SSP2
- Today (2025)
- 5,571,493 people
- By 2030
- 6,089,821 · +9.3%
- By 2040
- 7,142,806 · +28.2%
- By 2050
- 8,185,864 · +46.9%
- By 2075
- 10,574,329 · +89.8%
- By 2100
- 12,109,958 · +117.4%
Race, ethnicity, and origin ACS 2023
- Neighborhood character
- Majority Black (56%)
- Race & ethnicity
- Black 56% Hispanic / Latino 42% Two or more races 28%
- Hispanic origin (detail)
- Mexican 34%
- Foreign-born
- 18% · Canada
- Languages at home
- 61% English-only · Spanish 37%
Political lean MEDSL · Harris
- 2024 margin
- Lean D (+5.5) · D 52.0% · R 46.4% · Other 1.6%
- 2008→2024 swing
- +3.9pp toward D · 2008: 1.6pp · 2024: 5.5pp
- All cycles
- 2024: D+5.5 2020: D+13.3 2016: D+12.4 2012: D+0.1 2008: D+1.6
Not yet ingested
- Civics
- —
Market trends
- HPI YoY
- ▲ 8.65%
- Current HPI
- 315.6765
- Rent YoY
- ▲ 0.44%
- Metro
- Houston-The Woodlands-Sugar Land, TX
- State GDP YoY
- ▲ 3.95%
- F500 in state
- 110
Industry mix (Fortune 500 HQ in TX)
| Industry | F500 HQs | Revenue |
|---|---|---|
| Energy | 16 | $1,198B |
|
||
| Technology | 5 | $198B |
|
||
| Engineering / Construction | 4 | $72B |
|
||
| Energy Services | 3 | $60B |
|
||
| Utilities | 3 | $41B |
|
||
| Healthcare | 2 | $330B |
|
||
Price history
-6.7% since first listed8 events — show timeline
- 2026-05-28 Price Changed $195,000 HARMLS
- 2026-05-05 Listed $199,000 HARMLS
- 2025-12-25 Listing Removed — HARMLS
- 2025-09-16 Price Changed $199,000 HARMLS
- 2025-06-05 Rental Removed $1,750 HARMLS
- 2025-03-27 Price Changed $1,750 HARMLS
- 2025-03-26 Listed for Rent $1,700 HARMLS
- 2025-03-25 Listed $209,000 HARMLS
Cash-flow waterfall
monthlySold comps — $/sqft
last 12 mo · ≤1 miLoading sold comps…