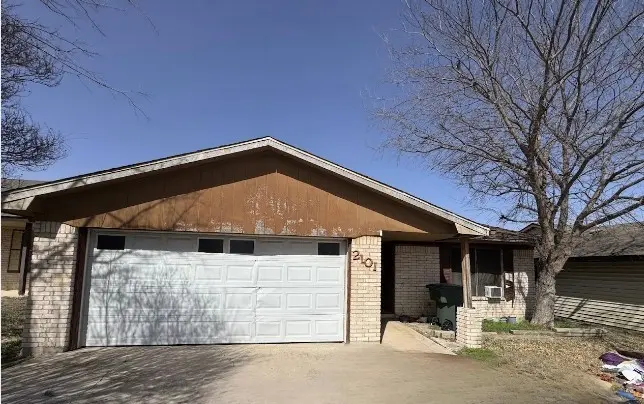
2101 Corona Dr · Killeen, TX
Flood risk 1/10 · Minimal
- FEMA flood zone
- X (unshaded)
- Chance of flooding over 30 yrs
- 0.0%
- Est. flood insurance / yr
- $507 – $1,088
Fire risk 3/10 · Minor
- Est. fire insurance / yr
- $1,222 – $2,270
Heat risk 8/10 · Major
- Hot days now (above 107°F)
- 7 days/yr
- Hot days in 30 yrs
- 24 days/yr
Wind risk 6/10 · Moderate
- Chance of severe wind over 30 yrs
- 56.0%
Air-quality risk 1/10 · Minimal
- Unhealthy air days now
- 0 days/yr
- Unhealthy air days in 30 yrs
- 0 days/yr
Risk factors via First Street. Map © Google.
Why this score? — see what drove the D grade
The composite is a weighted blend of 9 inputs, each scored 0–100. Each bar is that input's sub-score; the figure is the points it added to the 100-point composite (weight × sub-score).
- Cash flow +12.5/30.0
- ARV discount +9.7/15.0
- DSCR +3.7/10.0
- 1% rule +3.4/10.0
- Livability +3.2/5.0
- Schools +3.0/10.0
- Rent growth +2.8/5.0
- Condition / age +2.5/5.0
- Appreciation +0.0/10.0
$159,999
🖨 Deal sheet (PDF) 📄 Offer letter ✓ Due diligence
Listing remarks MLS
LOCATED IN KILLEEN! This three-bedroom home will need a little work, but it has a lot of potential. It is in Killeen, Texas which is located north of Austin, near Fort Cavazos and Texas A&M University - Central Texas. WE MAKE IT EASY TO OWN. This is a great opportunity! Don't wait, call us today to get more information on the owner's easy terms and smooth process that may be able to put the deed in your name and make this your dream home.
Key facts
- 6,146 sq ft lot
- 2 garage spots
- Built 1983
Neighborhood map
What this means for you Summary
Snapshot
- This is a 3-bed/2.0-bath single-family listed at $160k.
Deal economics
- At list price, monthly cash flow is $-23 ($-272/yr) — negative.
- To cash-flow at today's rent, offer at most $156k (2.5% below list).
- To meet the 1% rule (rent ≥ 1% of price), the offer needs to be $134k (16.1% below list).
- Recommended offer: $134k (16.1% below list) — sets the bar for 1% rule.
- Cap rate 6.1% vs local median 3.9% in Killeen — top-decile yield for the area; either an underpriced asset or a hidden risk that comps aren't pricing in. Stress-test before assuming the spread holds.
Location & tenants
- Location reads 63/100 on livability (#853 in TX) — a middle-class / working-renter tenant base. Strengths: cost of living A+, housing A+; Watch: amenities D, employment D, crime D-.
- Killeen ISD (urban): math 31% / reading 38% proficiency, ranked #524 of 826 in TX (top 63%) — families likely to look elsewhere, expect single-tenant / working-renter base with shorter leases.
- Zoned schools: Live Oak Ridge Middle (math 25% / reading 33%, grade F, #1,103 of 1,662 statewide, top 67%, 729 students, 74% FRL); Robert M Shoemaker H S (math 18% / reading 39%, grade F, #1,157 of 1,632 statewide, top 72%, 2,175 students, 60% FRL) — zoned schools average 67% FRL vs 47% district-wide (19 pts higher); higher-poverty schools than district average — tighter screening recommended.
- Market conditions: Rents rising (+1.1%/yr); 433 active listings in the ZIP; 40 comparable units currently listed for rent nearby; rentals at typical pace (median 26d on market — plan ~3-4 weeks tenant-placement turnaround); 3,222 units permitted in Bell County in 2024 (246 in 5+ unit buildings).
Forward outlook
- Local home prices are declining (-3.0%/yr); year-one equity from $1k of loan paydown is wiped out by about $5k of value loss. Plan a longer hold.
- Bell County population projected at +21% by 2050 — long-run rental-demand tailwind backs the buy-and-hold thesis.
Negotiation context
- It's been on market 431 days — a 12% lower offer ($141k) is reasonable based on typical stale-listing flexibility.
Risks & watch-outs
- Climate carrying-cost: major wind risk, 56% chance of damaging wind over 30y; extreme-heat days projected 7→24/yr by 2055 (HVAC capex compounding) — expect insurance premiums to compound above CPI over the hold.
Questions for the listing agent
- What do current leases actually rent for vs. the listed asking? Can we see a recent rent roll and the last 12 months of T-12 income?
- It's been on market 431 days. Have you received any prior offers? Is the seller open to a 16% concession, seller financing, or rate buy-down credit?
- Why hasn't it sold? Are there any deal-killer items the seller is aware of (foundation, flood, title, zoning, code violations)?
- Is there a deadline driving the sale (1031 exchange, divorce, estate, relocation)? That informs how much negotiation room exists.
- Schools are D-rated, which usually means shorter tenancies and higher turnover. Who's the typical renter profile here, and what's been the actual vacancy rate?
- Crime grade is D in this area — have there been break-ins, vandalism, or insurance claims at this property in the last 3 years? What carrier currently insures it and at what premium?
- The area grade is low — what's the realistic commute time and amenity access for the typical tenant pool here? Any planned neighborhood developments (good or bad) we should know about?
- What's the average days-on-market for RENTAL listings here right now (not sales)? A rising rental-DOM trend means longer vacancies and softer asking-rent achievability than the comps imply.
- What's the recent tenant-quality profile in this submarket — average credit score on applications, eviction rate, late-payment / NSF rate, and stable-employment percentage? A property-management company in the area should have these aggregated.
- How much new for-sale + rental construction is in the pipeline within 1–3 miles? Heavy new supply typically softens prices + rents 12–24 months out; constrained supply supports both.
Investment metrics
- 1% rule
- 0.84% ✗
- Cap rate
- 6.12%
- Cash-on-cash
- -0.61%
- DSCR
- 0.97
- GRM
- 9.9
CMA / ARV
- ARV (median comp)
- $168,088
- List price
- $159,999
- Delta
- -4.81%
- Verdict
- FAIR
- Comps
- 20 within 1.0 mi
Show comp detail 12 sales within ~0.75 mi
| Address | Dist | Beds/Ba | Sqft | Sold | Price | $/sf | Match |
|---|---|---|---|---|---|---|---|
| 1701 Bobby Lee Dr | 0.17mi | 3/2.5 | 1,413 (-0%) | 4mo | $130,000 | $92 | 87 |
| 1702 Big Bend Dr | 0.49mi | 3/2.0 | 1,444 (+2%) | 3mo | $162,500 | $113 | 71 |
| 1308 Goodhue Dr | 0.11mi | 3/2.0 | 1,248 (-12%) | 8mo | $183,000 | $147 | 69 |
| 2302 Bluebonnet Dr | 0.28mi | 3/2.0 | 1,289 (-9%) | 13mo | $187,690 | $146 | 62 |
| 3004 Tallwood Dr | 0.54mi | 4/2.0 (+1) | 1,412 (-0%) | 9mo | $224,900 | $159 | 62 |
| 3010 Westrim Dr | 0.60mi | 4/2.0 (+1) | 1,442 (+2%) | 5mo | $199,900 | $139 | 59 |
| 2205 Bluebonnet Dr | 0.25mi | 3/3.0 | 1,622 (+15%) | 3mo | $215,000 | $133 | 58 |
| 2702 Wildflower Dr | 0.46mi | 3/2.0 | 1,246 (-12%) | 4mo | $112,000 | $90 | 55 |
| 2701 Wildflower Dr | 0.48mi | 3/2.0 | 1,588 (+12%) | 4mo | $164,900 | $104 | 54 |
| 2806 Woodlands Dr | 0.48mi | 3/2.0 | 1,205 (-15%) | 7mo | $172,000 | $143 | 47 |
| 1310 Bonner Dr | 0.70mi | 3/2.0 | 1,204 (-15%) | 2mo | $155,000 | $129 | 41 |
| 1527 Ferndale Dr | 0.64mi | 4/3.0 (+1) | 1,608 (+14%) | 13mo | $175,000 | $109 | 27 |
Match score weights: distance 35% · size 25% · config 20% · recency 20%. Top-matched comps best support the ARV.
Projected returns pro-forma
-3.0% appreciation · 1.14% rent growth · sell at horizon
- IRR
- -19.4%
- Equity multiple
- 0.33×
- Total profit
- $-29,832
- Equity at exit
- $23,856
- IRR
- -16.4%
- Equity multiple
- 0.16×
- Total profit
- $-37,562
- Equity at exit
- $13,834
Cash invested: $44,800 (down + closing). Projections, not guarantees.
Landlord ↔ Tenant lean methodology
- Overall (STATE)
- 87 Strongly Landlord-Friendly
- State Texas
- 87 Strongly Landlord-Friendly · R+5
- County
- — inherits STATE
- City
- — inherits STATE
ZIP-level market 76549
- Home prices YoY
- -12.6%
- Rents YoY
- 1.1%
- Active inventory
- 433
- Price-to-rent
- 9.9×
Monthly cashflow live
- Estimated rent
- $1,342 high interval (Pro) →
- Mortgage (P&I)
- −$839
- Tax from tax record
- −$177 /mo · $2,130/yr
- Insurance
- −$67
- HOA
- −$0
- Vacancy / Maint / Mgmt
- −$282
- Net cashflow
- $-23
Break-even live
Sensitivity live
| Price | -10% $68 | -5% $23 | +0% $-23 | +5% $-68 | +10% $-113 |
|---|---|---|---|---|---|
| Rent | -10% $-129 | -5% $-76 | +0% $-23 | +5% $30 | +10% $83 |
| Rate | -1.0pp $58 | -0.5pp $18 | base $-23 | +0.5pp $-64 | +1.0pp $-106 |
UW: 25.0% down · 7.5% · 30yr · 1.5% tax · 5.0% vac · 8.0% maint · 8.0% mgmt
Financing live
Cash to close
- Down payment
- $40,000
- Closing costs
- $4,800
- Reserves months
- —
- Total cash needed
- —
Loan-product check · same deal, 3 products live
Conventional
25% down · 7.5% · 30yr
- Down + closing
- —
- Monthly P&I
- —
- Monthly cashflow
- —
- DSCR
- —
- Eligible?
- —
Personal DTI + credit; lowest rate.
DSCR
20% down · 8.5% · 30yr
- Down + closing
- —
- Monthly P&I
- —
- Monthly cashflow
- —
- DSCR
- —
- Eligible?
- —
No personal income docs; deal must DSCR.
Hard money
10% down · 12.0% · 12mo
- Down + closing
- —
- Monthly P&I
- —
- Monthly cashflow
- —
- DSCR
- —
- Eligible?
- —
Short-term bridge; refi at stabilization.
Rent comps 40 comps
| Address | Beds | Baths | Sqft | Rent | $/sqft | DOM | Units | Dist |
|---|---|---|---|---|---|---|---|---|
| 2104 Corona Dr Killeen, TX | 3.0 | 2.0 | 1480 | $1,450 | $0.98 | 25d | 1 | 0.04mi |
| 2104 Corona Dr Killeen, TX | 3.0 | 2.0 | 1480 | $1,450 | $0.98 | 23d | 1 | 0.04mi |
| 1304 Quail Cir Unit D Killeen, TX | 2.0 | 1.0 | 964 | $650 | $0.67 | 15d | 1 | 0.10mi |
| 1302 Quail Cir Unit B Killeen, TX | 2.0 | 1.0 | 900 | $800 | $0.89 | 25d | 1 | 0.10mi |
| 1806 Bobby Lee Dr Killeen, TX | 3.0 | 2.0 | 1220 | $1,295 | $1.06 | 25d | 1 | 0.11mi |
| 1305 Quail Cir Apt B Killeen, TX | 2.0 | 1.0 | 900 | $695 | $0.77 | 15d | 1 | 0.13mi |
| 2002 Hinkle Ave Killeen, TX | 3.0 | 2.0 | 1370 | $1,225 | $0.89 | 25d | 1 | 0.17mi |
| 1714 West Ln Killeen, TX | 2.0 | 1.0 | 899 | $1,200 | $1.33 | 45d | 1 | 0.20mi |
| 2211 Wheeler Ave Apt B Killeen, TX | 2.0 | 2.0 | 1168 | $1,050 | $0.90 | 15d | 1 | 0.20mi |
| 2404 Fieldstone Dr Killeen, TX | 3.0 | 2.0 | 1200 | $1,365 | $1.14 | 25d | 1 | 0.22mi |
| 1613 Bobby Lee Dr Killeen, TX | 3.0 | 2.5 | 1274 | $1,495 | $1.17 | 25d | 1 | 0.22mi |
| 2512 Schulze Dr Killeen, TX | 3.0 | 2.5 | 1638 | $1,450 | $0.89 | 25d | 1 | 0.25mi |
| 1213 Meadow Dr Killeen, TX | 3.0 | 2.0 | 1213 | $1,345 | $1.11 | 45d | 1 | 0.26mi |
| 1100 Willow Springs Rd Killeen, TX | 1.0–3.0 | 1.0–2.0 | 848 | $1,400 | $1.65 | 15d | 36 | 0.27mi |
| 2410 Grasslands Dr Killeen, TX | 3.0 | 2.0 | 1352 | $1,395 | $1.03 | 25d | 1 | 0.29mi |
| 2404 Bluebonnet Dr Killeen, TX | 3.0 | 2.0 | 1095 | $1,350 | $1.23 | 45d | 1 | 0.32mi |
| 1228 Chippendale Dr Killeen, TX | 3.0 | 2.0 | 1271 | $1,395 | $1.10 | 15d | 1 | 0.33mi |
| 2408 Bluebonnet Dr Killeen, TX | 3.0 | 2.5 | 1622 | $1,545 | $0.95 | 25d | 1 | 0.33mi |
| 2609 Bermuda Dr Unit C Killeen, TX | 2.0 | 1.5 | 1025 | $950 | $0.93 | 25d | 1 | 0.34mi |
| 1510 Westway Dr Killeen, TX | 3.0 | 2.0 | 1073 | $1,225 | $1.14 | 15d | 1 | 0.35mi |
| 2604 Woodlands Dr Killeen, TX | 3.0 | 2.0 | 1089 | $1,300 | $1.19 | 15d | 1 | 0.35mi |
| 2604 Woodlands Dr Killeen, TX | 3.0 | 2.0 | 1089 | $1,295 | $1.19 | 25d | 1 | 0.35mi |
| 1149 Royal Crest Dr Killeen, TX | 2.0 | 2.0 | 1291 | $1,095 | $0.85 | 25d | 1 | 0.35mi |
| 2501 Cactus Dr Killeen, TX | 3.0 | 2.5 | 1622 | $1,425 | $0.88 | 45d | 1 | 0.35mi |
| 1307 Linda Spur Killeen, TX | 3.0 | 2.0 | 1660 | $1,595 | $0.96 | 45d | 1 | 0.36mi |
| 2701 Bermuda Dr Unit A Killeen, TX | 2.0 | 1.5 | 924 | $949 | $1.03 | 45d | 1 | 0.37mi |
| 2701 Woodlands Dr Killeen, TX | 3.0 | 2.0 | 1293 | $1,495 | $1.16 | 25d | 1 | 0.38mi |
| 1109 Wales Dr Unit 1 Killeen, TX | 2.0 | 1.5 | 1160 | $995 | $0.86 | 45d | 1 | 0.38mi |
| 1109 Wales Dr Killeen, TX | 2.0 | 2.0 | 1160 | $995 | $0.86 | 45d | 1 | 0.38mi |
| 2412 Skylark Cir Killeen, TX | 2.0 | 1.5 | 1110 | $1,050 | $0.95 | 45d | 1 | 0.39mi |
| 2404 Windmill Dr Killeen, TX | 2.0 | 1.0 | 915 | $1,195 | $1.31 | 15d | 1 | 0.40mi |
| 1108 Royal Crest Dr Killeen, TX | 2.0 | 1.5 | 992 | $895 | $0.90 | 45d | 1 | 0.40mi |
| 1218 Westway Cir Killeen, TX | 2.0 | 1.5 | 1132 | $1,010 | $0.89 | 45d | 1 | 0.41mi |
| 1108 Ridgeway Dr Killeen, TX | 3.0 | 2.0 | 1295 | $1,345 | $1.04 | 25d | 1 | 0.42mi |
| 1520 McCarthy Ave Killeen, TX | 3.0 | 2.0 | 1789 | $1,275 | $0.71 | 25d | 1 | 0.43mi |
| 2505 Armadillo Dr Killeen, TX | 3.0 | 2.0 | 1118 | $1,400 | $1.25 | 45d | 1 | 0.45mi |
| 1204 Alta Vista Dr Killeen, TX | 4.0 | 2.0 | 1624 | $1,450 | $0.89 | 45d | 1 | 0.46mi |
| 1802 Big Bend Dr Killeen, TX | 3.0 | 2.0 | 1515 | $1,650 | $1.09 | 45d | 1 | 0.49mi |
| 1704 Big Bend Dr Killeen, TX | 3.0 | 2.0 | 1472 | $1,600 | $1.09 | 25d | 1 | 0.50mi |
| 1208 Ridgemont Dr Killeen, TX | 3.0 | 1.0 | 1224 | $1,150 | $0.94 | 25d | 1 | 0.51mi |
Listing history 18 events
-
2026-06-22days on market $159,999 Active 431 DOM
-
2026-06-18days on market $159,999 Active 428 DOM
-
2026-06-17days on market $159,999 Active 427 DOM
-
2026-06-16days on market $159,999 Active 426 DOM
-
2026-06-15days on market $159,999 Active 425 DOM
-
2026-06-14days on market $159,999 Active 423 DOM
-
2026-06-13days on market $159,999 Active 422 DOM
-
2026-06-10days on market $159,999 Active 420 DOM
-
2026-06-09days on market $159,999 Active 419 DOM
-
2026-06-08days on market $159,999 Active 418 DOM
-
2026-06-07days on market $159,999 Active 417 DOM
-
2026-06-03days on market $159,999 Active 413 DOM
-
2026-06-02days on market $159,999 Active 412 DOM
-
2026-06-01days on market $159,999 Active 411 DOM
-
2026-05-31days on market $159,999 Active 410 DOM
-
2026-05-30days on market $159,999 Active 409 DOM
-
2025-04-16$159,999 Active 447-char remark
Show marketing remark (447 chars)
LOCATED IN KILLEEN! This three-bedroom home will need a little work, but it has a lot of potential. It is in Killeen, Texas which is located north of Austin, near Fort Cavazos and Texas A&M University - Central Texas. WE MAKE IT EASY TO OWN. This is a great opportunity! Don't wait, call us today to get more information on the owner's easy terms and smooth process that may be able to put the deed in your name and make this your dream home.
-
1988-11-29soldstatus
ⓘ Source: listings_history table (triggers on properties + properties_extension) + one-shot
backfill from property_details.listing_events for pre-trigger history.
Tax reassessment forecast TX · Resets to sale price
- Current annual tax
- $2,130 · $177/mo
- Projected year-2 tax
- $2,928 · $244/mo
- Expected delta
- +$798/yr (+$67/mo · 37.5%)
ⓘ Screening estimate from a state-policy table — verify with the county assessor before closing.
Climate risk First Street
- Flood 1/10 Low FEMA zone X (unshaded) · 0% chance over 30 yrs
- Wildfire 3/10 Moderate
- Heat 8/10 Severe 7 d/yr ≥107°F today · 24 d/yr by 30 yrs out
- Wind 6/10 Major 56% chance of damaging wind over 30 yrs
- Air quality 1/10 Low 0 unhealthy d/yr today · 0 by 30 yrs out
Nearby sold comps map
Loading sold comps map…
Walkable amenities ~0.75 mi
Loading nearby amenities…
Taxation est. · year 1
- Rental income
- $16,109
- − Mortgage interest
- −$8,962
- − Property taxes
- −$2,130
- − Insurance
- −$800
- − Repairs & maintenance
- −$1,289
- − Management
- −$1,289
- − Depreciation
- −$4,655
- Taxable loss
- −$3,015
- Est. tax savings @ 24.0%
- +$724
- After-tax cash flow
- $451/yr
For passive investors: Depreciation is non-cash, so a rental often shows a tax loss while cash-flowing — sheltering income. Rental losses are passive: they offset passive income freely, and up to $25,000/yr can offset ordinary (W-2) income if you actively participate and your MAGI is under $100k (phasing out to $0 by $150k); unused losses carry forward. On sale, claimed depreciation is recaptured at up to 25%, and gains may owe capital-gains tax (a 1031 exchange can defer both). Figures are a year-1 estimate at your 24.0% rate — not tax advice; consult a CPA.
Schools (NCES district)
- District
- Killeen ISD
- NCES district ID
- 4825660
- Math proficiency
- 31% ▼ -16.00%
- Reading proficiency
- 38% ▼ -3.00%
- Median HH income
- $47,665
- Composite
- 29.69/100
- National rank
- #6458
- State rank
- #524 of 826 in TX
Livability — Killeen
- Score
- 63/100
- State rank
- #853
- US rank
- #15359
Category grades
Schools grade is shown separately in the Schools card above.
Census & demographics
- Census place
- Killeen, TX
- County
- Bell County · 345,090 people
- City population
- 163,398
- Metro
- Killeen-Temple, TX
- Population (ZIP)
- 56,038
- Household income
- $70,871
- Rent vs Own
- Severe rent burden
- 1874.0
Population outlook (Bell County) Hauer SSP2
- Today (2025)
- 371,114 people
- By 2030
- 389,104 · +4.8%
- By 2040
- 420,592 · +13.3%
- By 2050
- 447,779 · +20.7%
- By 2075
- 499,130 · +34.5%
- By 2100
- 505,680 · +36.3%
Race, ethnicity, and origin ACS 2023
- Neighborhood character
- Highly diverse neighborhood (Simpson 0.74)
- Race & ethnicity
- Black 35% White 27% Hispanic / Latino 26% Two or more races 16% Asian 4% Pacific Islander 1%
- Hispanic origin (detail)
- Mexican 13% Puerto Rican 9%
- Common ancestry
- Italian 3% Romanian 1% Slovak 1%
- Foreign-born
- 8% · Canada, Vietnam, South Korea
- Languages at home
- 77% English-only · Spanish 17% Tagalog/Filipino 1% German/W. Germanic 1%
Political lean MEDSL · Bell
- 2024 margin
- R (+16.2) · D 41.3% · R 57.6% · Other 1.1%
- 2008→2024 swing
- -6.5pp toward R · 2008: -9.8pp · 2024: -16.2pp
- All cycles
- 2024: R+16.2 2020: R+8.5 2016: R+15.1 2012: R+16.4 2008: R+9.8
Not yet ingested
- Civics
- —
Market trends
- HPI YoY
- ▼ -24.68%
- Current HPI
- 171.2708
- Rent YoY
- ▲ 1.14%
- Metro
- Killeen-Temple, TX
- State GDP YoY
- ▲ 3.95%
- F500 in state
- 110
Industry mix (Fortune 500 HQ in TX)
| Industry | F500 HQs | Revenue |
|---|---|---|
| Energy | 16 | $1,198B |
|
||
| Technology | 5 | $198B |
|
||
| Engineering / Construction | 4 | $72B |
|
||
| Energy Services | 3 | $60B |
|
||
| Utilities | 3 | $41B |
|
||
| Healthcare | 2 | $330B |
|
||
Price history
2 events — show timeline
- 2025-04-16 Listed $159,999 HARMLS
- 1988-11-29 Sold (Public Records) — Public Records
Property tax history
+0.2%/yrLatest (2025): $2,130 · -39.9% YoY. Source: county tax records.
Cash-flow waterfall
monthlySold comps — $/sqft
last 12 mo · ≤1 miLoading sold comps…