875 W Akoya Pearl Rd Unit 300B · St. George, UT
Flood risk No data
- FEMA flood zone
- —
- Chance of flooding over 30 yrs
- —
- Est. flood insurance / yr
- —
Fire risk No data
- Est. fire insurance / yr
- —
Heat risk No data
- Hot days now (above threshold)
- —
- Hot days in 30 yrs
- —
Wind risk No data
- Chance of severe wind over 30 yrs
- —
Air-quality risk No data
- Unhealthy air days now
- —
- Unhealthy air days in 30 yrs
- —
Risk factors via First Street. Map © Google.
Why this score? — see what drove the B- grade
The composite is a weighted blend of 9 inputs, each scored 0–100. Each bar is that input's sub-score; the figure is the points it added to the 100-point composite (weight × sub-score).
- Cash flow +30.0/30.0
- 1% rule +10.0/10.0
- DSCR +10.0/10.0
- ARV discount +7.5/15.0
- Schools +3.7/10.0
- Rent growth +2.6/5.0
- Livability +2.5/5.0
- Condition / age +2.5/5.0
- Appreciation +0.0/10.0
$109,990
🖨 Deal sheet 📄 Offer letter ✓ Due diligence
Listing remarks MLS
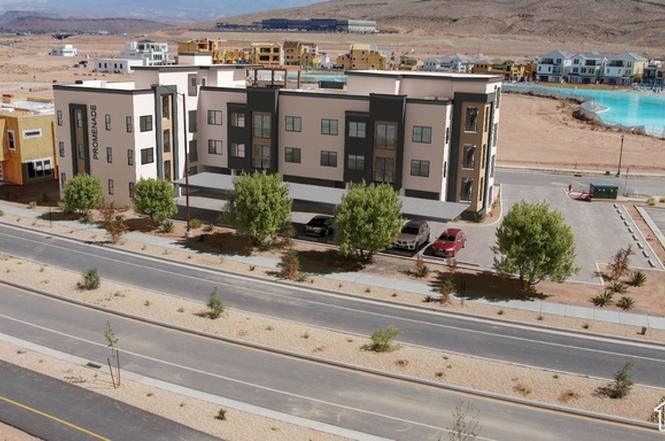
Come see the difference at that completely turn-key and professionally designed/furnished condo. Sold in Co-Ownership in a 1/8th ownership share. Enjoy 44+ nights per year to use for vacationing purposes or rent your nights out! With EmberFLEX you get to choose how you use your nights! Don't settle for imitations, as ownership in this home features full management, access to app based scheduling and a 24/7 in-market concierge that will be there if you ever have any issues with your home! It's like having access to a 5 star resort, expect, you own it! 3 King Bedrooms Sleeps 8 with Fold-Out Sofa. Estimated monthly operating cost for 1/8 Ownership is $369.
Key facts
- Access to resort
- $109 HOA
- Community pool
Tags
Property features AI
Finance
- Other: Short-term rentals allowed (zoned multi-family, short term rental permitted); Above-grade finished area approximately 1,231
- Financial info: Association fee collected quarterly
- HOA & community: Homeowners association with quarterly fee; Association amenities: clubhouse, pool, sauna, tennis courts, fire pit, barbecue, picnic area, biking trails, management; Subdivision: DESERT COLOR
Exterior
- Parking: Open/uncovered parking; RV parking
- Security: On-site security; Community security
- Utilities: Natural gas connected; Electricity connected; Sewer connected; Water connected (culinary)
- Home design: Condo, top-level unit; New construction (2023); Fractional ownership; Underground construction status noted; Accessible elevator installed; Flat roof
- Construction: Stucco construction
- Exterior features: Balcony; Outdoor lighting; Sliding glass doors; Spa; Mountain view; Curb and gutter; Paved roads; Sidewalks; Automatic full sprinkler system; Drip irrigation; Landscaping: full; Xeriscaped
Interior
- Kitchen: Built-in range/oven; Gas oven; Disposal
- Bedrooms: 3 bedrooms on the main level; Primary bedroom on the 1st floor
- Flooring: Carpet; Tile
- Bathrooms: 2 full bathrooms
- Heating & cooling: Gas central heating; Central air conditioning
- Interior features: Disposal; Built-in range/oven; Gas oven
- Laundry & utility: Gas dryer hookup
Neighborhood map
What this means for you Summary
Snapshot
- This is a 3-bed/2.0-bath condo listed at $110k.
Deal economics
- At list price, monthly cash flow is $884 ($11k/yr) — positive.
- The deal already cash-flows at list — no discount required.
- Meets the 1% rule at list price ($2k rent vs $110k).
- Recommended offer: $97k (12.0% below list) — sets the bar for market timing.
Location & tenants
- Location reads: area grade B — affects rentability + tenant quality, not the cash-flow math above.
- Washington District (urban): math 42% / reading 45% proficiency, ranked #37 of 80 in UT (top 46%) — families likely to look elsewhere, expect single-tenant / working-renter base with shorter leases.
- Zoned schools: Bloomington Hills School (math 47% / reading 47%, grade D-, #202 of 585 statewide, top 36%, 494 students, 43% FRL); Desert Hills High (math 47% / reading 58%, grade C-, #22 of 171 statewide, top 13%, 1,210 students, 15% FRL).
- Market conditions: Rents flat; 976 active listings in the ZIP; 4 comparable units currently listed for rent nearby; rentals at typical pace (median 21d on market — plan ~3-4 weeks tenant-placement turnaround); solid renter incomes; 3,140 units permitted in Washington County in 2024 (650 in 5+ unit buildings).
Forward outlook
- Local home prices are declining (-3.0%/yr); year-one equity from $760 of loan paydown is wiped out by about $3k of value loss. Plan a longer hold.
- Washington County population projected at +44% by 2050 — long-run rental-demand tailwind backs the buy-and-hold thesis.
- At projected returns (-3.0% appreciation + 0.2% rent growth), your $31k cash investment doubles in ~4 years — after that, you're playing with house money.
Negotiation context
- It's been on market 326 days — a 12% lower offer ($97k) is reasonable based on typical stale-listing flexibility.
- 4 sale attempts since 3y ago with the ask held roughly flat each time — persistent listings suggest the price (not the market) is what's stuck; bring a comps-based counter.
Questions for the listing agent
- It's been on market 326 days. Have you received any prior offers? Is the seller open to a 12% concession, seller financing, or rate buy-down credit?
- What does the HOA fee cover, when was the last increase, and are there any pending special assessments or reserve-fund shortfalls?
- Any open or pending special assessments — roof, HVAC, plumbing, elevator, façade? What's the per-unit balance and payoff schedule, and is the seller paying it off at close or rolling it to the buyer?
- Why hasn't it sold? Are there any deal-killer items the seller is aware of (foundation, flood, title, zoning, code violations)?
- Is there a deadline driving the sale (1031 exchange, divorce, estate, relocation)? That informs how much negotiation room exists.
- What's the average days-on-market for RENTAL listings here right now (not sales)? A rising rental-DOM trend means longer vacancies and softer asking-rent achievability than the comps imply.
- What's the recent tenant-quality profile in this submarket — average credit score on applications, eviction rate, late-payment / NSF rate, and stable-employment percentage? A property-management company in the area should have these aggregated.
- How much new apartment / multifamily construction is in the pipeline within 1–3 miles? Heavy new supply (>2% of stock underway) typically softens rents 12–24 months out; light construction supports rent growth.
Investment metrics
- 1% rule
- 2.02% ✓
- Cap rate
- 15.94%
- Cash-on-cash
- 34.45%
- DSCR
- 2.53
- GRM
- 4.1
CMA / ARV
No comps found within radius.
Projected returns pro-forma
-3.0% appreciation · 0.2% rent growth · sell at horizon
- IRR
- 26.5%
- Equity multiple
- 2.06×
- Total profit
- $32,513
- Equity at exit
- $16,400
- IRR
- 32.3%
- Equity multiple
- 3.52×
- Total profit
- $77,639
- Equity at exit
- $9,510
Cash invested: $30,797 (down + closing). Projections, not guarantees.
Landlord ↔ Tenant lean methodology
- Overall (STATE)
- 86 Strongly Landlord-Friendly
- State Utah
- 86 Strongly Landlord-Friendly · R+15
- County
- — inherits STATE
- City
- — inherits STATE
ZIP-level market 84790
- Rents YoY
- 0.2%
- Active inventory
- 976
- Price-to-rent
- 4.1×
Monthly cashflow live
- Estimated rent
- $2,219 medium interval (Pro) →
- Mortgage (P&I)
- −$577
- Tax est. 1.5%
- −$137 /mo · $1,650/yr
- Insurance
- −$46
- HOA
- −$109
- Vacancy / Maint / Mgmt
- −$466
- Net cashflow
- $884
Break-even live
UW: 25.0% down · 7.5% · 30yr · 1.5% tax · 5.0% vac · 8.0% maint · 8.0% mgmt
Financing live
Cash to close
- Down payment
- $27,498
- Closing costs
- $3,300
- Reserves months
- —
- Total cash needed
- —
Loan-product check · same deal, 3 products live
Conventional
25% down · 7.5% · 30yr
- Down + closing
- —
- Monthly P&I
- —
- Monthly cashflow
- —
- DSCR
- —
- Eligible?
- —
Personal DTI + credit; lowest rate.
DSCR
20% down · 8.5% · 30yr
- Down + closing
- —
- Monthly P&I
- —
- Monthly cashflow
- —
- DSCR
- —
- Eligible?
- —
No personal income docs; deal must DSCR.
Hard money
10% down · 12.0% · 12mo
- Down + closing
- —
- Monthly P&I
- —
- Monthly cashflow
- —
- DSCR
- —
- Eligible?
- —
Short-term bridge; refi at stabilization.
Rent comps 4 comps
| Address | Beds | Baths | Sqft | Rent | $/sqft | DOM | Units | Dist |
|---|---|---|---|---|---|---|---|---|
| 758 W Sunfire Ln Saint George, UT | 2.0 | 3.0 | 1406 | $2,000 | $1.42 | 21d | 1 | 0.14mi |
| 5544 S Ochre Ln Saint George, UT | 2.0 | 2.5 | 1478 | $2,425 | $1.64 | 21d | 1 | 0.18mi |
| 5801 S Garnet Dr St George, UT | 1.0–3.0 | 1.0–2.0 | 1132 | $1,950 | $1.72 | 13d | 4 | 0.33mi |
| 5088 S Desert Color Pkwy Saint George, UT | 3.0 | 1.0–2.0 | 883 | $2,309 | $2.61 | 13d | 47 | 0.48mi |
HOA detail condo
- Monthly dues
- $109 · $1,308/yr
- Likely covers
- doorman
- Assessments
- None detected in remarks — confirm with the listing agent.
Listing history 25 events
-
2026-06-19days on market $109,990 Active 326 DOM
-
2026-06-18days on market $109,990 Active 325 DOM
-
2026-06-17days on market $109,990 Active 324 DOM
-
2026-06-16days on market $109,990 Active 323 DOM
-
2026-06-15days on market $109,990 Active 322 DOM
-
2026-06-14days on market $109,990 Active 320 DOM
-
2026-06-13days on market $109,990 Active 319 DOM
-
2026-06-10days on market $109,990 Active 317 DOM
-
2026-06-09days on market $109,990 Active 316 DOM
-
2026-06-08days on market $109,990 Active 315 DOM
-
2026-06-07days on market $109,990 Active 314 DOM
-
2026-06-05days on market $109,990 Active 311 DOM
-
2026-06-02days on market $109,990 Active 309 DOM
-
2026-06-01days on market $109,990 Active 308 DOM
-
2026-05-31days on market $109,990 Active 307 DOM
-
2026-05-30days on market $109,990 Active 306 DOM
-
2025-07-28$109,990 Active
-
2025-07-21$109,990 Active 661-char remark
Show marketing remark (661 chars)
Come see the difference at that completely turn-key and professionally designed/furnished condo. Sold in Co-Ownership in a 1/8th ownership share. Enjoy 44+ nights per year to use for vacationing purposes or rent your nights out! With EmberFLEX you get to choose how you use your nights! Don't settle for imitations, as ownership in this home features full management, access to app based scheduling and a 24/7 in-market concierge that will be there if you ever have any issues with your home! It's like having access to a 5 star resort, expect, you own it! 3 King Bedrooms Sleeps 8 with Fold-Out Sofa. Estimated monthly operating cost for 1/8 Ownership is $369.
-
2025-06-08historical
-
2025-01-11price $109,990
-
2024-06-15price $219,980
-
2024-06-07$219,980 Active
-
2024-04-04historical
-
2023-07-27price $114,437
-
2023-04-03$103,782 Active
ⓘ Source: listings_history table (triggers on properties + properties_extension) + one-shot
backfill from property_details.listing_events for pre-trigger history.
Nearby sold comps map
Loading sold comps map…
Walkable amenities ~0.75 mi
Loading nearby amenities…
Taxation est. · year 1
- Rental income
- $26,633
- − Mortgage interest
- −$6,161
- − Property taxes
- −$1,650
- − Insurance
- −$550
- − Repairs & maintenance
- −$2,131
- − Management
- −$2,131
- − HOA
- −$1,308
- − Depreciation
- −$3,200
- Taxable income
- $9,503
- Est. tax owed @ 24.0%
- −$2,281
- After-tax cash flow
- $8,330/yr
For passive investors: Depreciation is non-cash, so a rental often shows a tax loss while cash-flowing — sheltering income. Rental losses are passive: they offset passive income freely, and up to $25,000/yr can offset ordinary (W-2) income if you actively participate and your MAGI is under $100k (phasing out to $0 by $150k); unused losses carry forward. On sale, claimed depreciation is recaptured at up to 25%, and gains may owe capital-gains tax (a 1031 exchange can defer both). Figures are a year-1 estimate at your 24.0% rate — not tax advice; consult a CPA.
Schools (NCES district)
- District
- Washington District
- NCES district ID
- 4901140
- Math proficiency
- 42% ▼ -3.00%
- Reading proficiency
- 45% ▼ -3.00%
- Median HH income
- $50,861
- Composite
- 37.47/100
- National rank
- #4408
- State rank
- #37 of 80 in UT
Livability — St. George
No livability data for this city. (Only ~50 U.S. cities are tracked.)
Census & demographics
- Census place
- St. George, UT
- County
- Washington County · 179,216 people
- City population
- 101,579
- Metro
- St. George, UT
- Population (ZIP)
- 55,892
- Household income
- $91,054
- Rent vs Own
- Severe rent burden
- 1359.0
Population outlook (Washington County) Hauer SSP2
- Today (2025)
- 193,324 people
- By 2030
- 211,699 · +9.5%
- By 2040
- 246,449 · +27.5%
- By 2050
- 278,447 · +44.0%
- By 2075
- 342,734 · +77.3%
- By 2100
- 382,815 · +98.0%
Race, ethnicity, and origin ACS 2023
- Neighborhood character
- Predominantly White (83%)
- Race & ethnicity
- White 83% Hispanic / Latino 11% Two or more races 7% Native American 1%
- Hispanic origin (detail)
- Mexican 7%
- Common ancestry
- Slovak 5% Italian 2% Portuguese 2%
- Foreign-born
- 6% · Canada, Dominican Republic
- Languages at home
- 89% English-only · Spanish 8% Other Asian/Pacific 1%
Political lean MEDSL · Washington
- 2024 margin
- Solid R (+52.3) · D 23.0% · R 75.2% · Other 1.8%
- 2008→2024 swing
- +1.2pp toward D · 2008: -53.5pp · 2024: -52.3pp
- All cycles
- 2024: R+52.3 2020: R+51.7 2016: R+52.1 2012: R+67.0 2008: R+53.5
Not yet ingested
- Civics
- —
Market trends
- HPI YoY
- ▼ -210.13%
- Current HPI
- 218.2317
- Rent YoY
- ▲ 0.20%
- Metro
- St. George, UT
- State GDP YoY
- ▲ 3.54%
- F500 in state
- 2
Industry mix (Fortune 500 HQ in UT)
| Industry | F500 HQs | Revenue |
|---|---|---|
| Financial Services | 1 | $3B |
|
||
Price history
+6.0% since first listed9 events — show timeline
- 2025-07-28 Listed $109,990 WFRMLS
- 2025-07-21 Listed $109,990 WCBOR
- 2025-06-08 Listing Removed — WFRMLS
- 2025-01-11 Price Changed $109,990 WFRMLS
- 2024-06-15 Price Changed $219,980 WCBOR
- 2024-06-07 Listed $219,980 WFRMLS
- 2024-04-04 Listing Removed — WFRMLS
- 2023-07-27 Price Changed $114,437 WFRMLS
- 2023-04-03 Listed $103,782 WFRMLS
Cash-flow waterfall
monthlySold comps — $/sqft
last 12 mo · ≤1 miLoading sold comps…