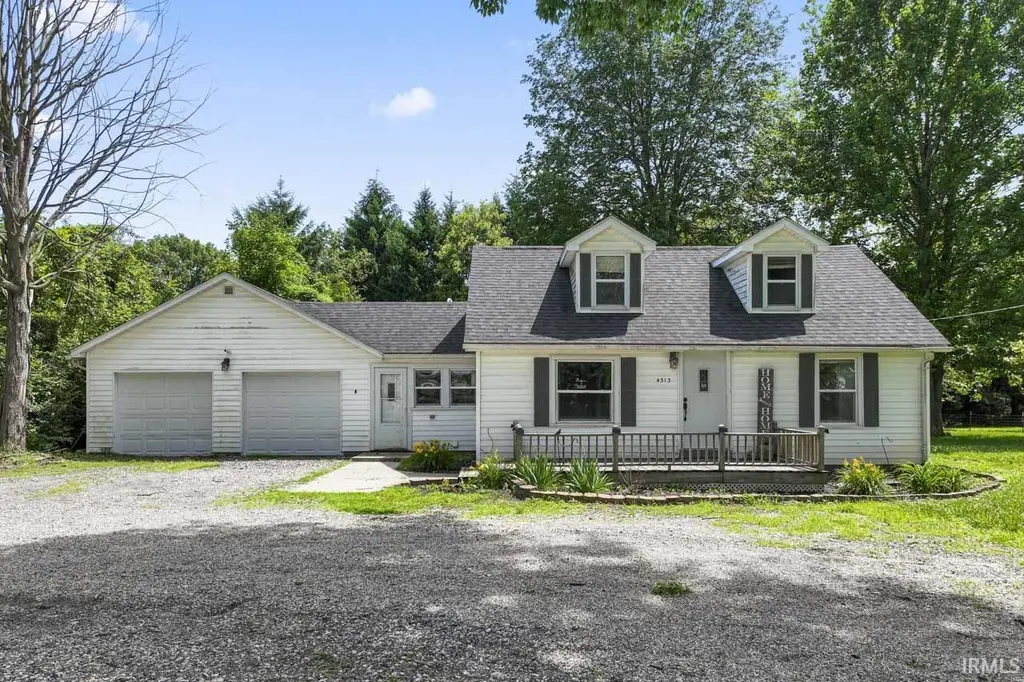
4313 W 100 N · Kokomo, IN
Flood risk 1/10 · Minimal
- FEMA flood zone
- X (unshaded)
- Chance of flooding over 30 yrs
- 0.0%
- Est. flood insurance / yr
- $507 – $1,088
Fire risk 1/10 · Minimal
- Est. fire insurance / yr
- $717 – $1,331
Heat risk 3/10 · Minor
- Hot days now (above 101°F)
- 7 days/yr
- Hot days in 30 yrs
- 17 days/yr
Wind risk 2/10 · Minimal
- Chance of severe wind over 30 yrs
- 1.0%
Air-quality risk 3/10 · Minor
- Unhealthy air days now
- 1 days/yr
- Unhealthy air days in 30 yrs
- 3 days/yr
Risk factors via First Street. Map © Google.
Why this score? — see what drove the D+ grade
The composite is a weighted blend of 9 inputs, each scored 0–100. Each bar is that input's sub-score; the figure is the points it added to the 100-point composite (weight × sub-score).
- ARV discount +15.0/15.0
- Cash flow +14.1/30.0
- Schools +4.6/10.0
- DSCR +4.3/10.0
- Livability +3.4/5.0
- 1% rule +2.8/10.0
- Condition / age +2.5/5.0
- Rent growth +2.1/5.0
- Appreciation +0.0/10.0
$169,900
🖨 Deal sheet (PDF) 📄 Offer letter ✓ Due diligence
Listing remarks MLS
Newly remodeled 1374 Sq. Ft. , 1.5 story home on a large. 63 acre lot surrounded by trees in Northwestern School district. Home offers 4 Bedrooms and 1 full bath. Beautiful laminate floors, tiled kitchen floors. Upstairs 4th Bedroom could be either a bedroom or a playroom. Roof new in 2019, well pump new in 2020. Home is located one driveway past Four Mile Hill S/D. Property to the west with garage is not included in sale.
Key facts
- New well pump
- Open-concept kitchen
- Side yard
Tags
Property features AI
Finance
- Other: Residential property
Exterior
- Parking: Attached garage; 2 garage spaces; Garage door opener; Off-street parking; Gravel driveway
- Utilities: Private water source; Septic tank
- Home design: Single-family residence (site-built); One-story
- Construction: Vinyl siding; Asphalt roof; Built as site-built home
- Exterior features: Chain link fencing; Level, landscaped lot; Lot dimensions approximately 125 x 220
Interior
- Kitchen: Microwave; Refrigerator; Electric range
- Bedrooms: Total rooms: 7
- Flooring: Carpet; Tile; Vinyl
- Bathrooms: 1 full bathroom (main level)
- Heating & cooling: Natural gas forced air heating; Central air conditioning
- Interior features: Open floorplan; Laminate counters; Water softener (owned); Crawl space
- Laundry & utility: Laundry on main level; Gas water heater; Water heater
Neighborhood map
What this means for you Summary
Snapshot
- This is a 3-bed/1.0-bath single-family listed at $170k.
Deal economics
- At list price, monthly cash flow is $26 ($312/yr) — positive.
- The deal already cash-flows at list — no discount required.
- To meet the 1% rule (rent ≥ 1% of price), the offer needs to be $133k (21.9% below list).
- Recommended offer: $133k (21.9% below list) — sets the bar for 1% rule.
- Cap rate 6.5% vs local median 5.1% in Kokomo — meaningfully above typical; check what's discounted (condition, days-on-market, listing class) to confirm the premium yield is real.
Location & tenants
- Location reads 68/100 on livability (#227 in IN) — a middle-class / working-renter tenant base. Strengths: cost of living A+, housing A+, health & safety A; Watch: crime D, amenities F, commute F.
- Northwestern School Corporation (rural): math 50% / reading 53% proficiency, ranked #35 of 301 in IN (top 12%) — acceptable for families but not a draw, mixed tenant base, ~2y average lease; only 20% free/reduced lunch — higher-income household profile.
- Zoned schools: Northwestern Elementary School (math 50% / reading 50%, grade D+, #275 of 994 statewide, top 28%, 677 students, 28% FRL); Northwestern Middle School (math 51% / reading 51%, grade C, #40 of 330 statewide, top 12%, 285 students, 30% FRL); Northwestern Senior High School (math 52% / reading 82%, grade B, #24 of 369 statewide, top 7%, 580 students, 24% FRL).
- Market conditions: Rents soft (-1.5%/yr); 246 active listings in the ZIP; 194 units permitted in Howard County in 2024 (0 in 5+ unit buildings).
Forward outlook
- Local home prices are declining (-3.0%/yr); year-one equity from $1k of loan paydown is wiped out by about $5k of value loss. Plan a longer hold.
- Howard County population projected at -11% by 2050 — secular population decline; favor cash flow + early exit over multi-decade hold.
Negotiation context
- Only 6 days on market — expect competitive offers; lowballing is unlikely to land.
- 3 sale attempts since 12y ago; this cycle's ask has dropped $9k (5%) from the opening price — seller is motivated, your offer sets the floor, not the list.
- Current owner paid $147k; 16% above their basis — modest negotiation headroom, anchor on the comps not their cost.
Risks & watch-outs
- Watch-outs: built in 1950 — expect roof / HVAC / electrical / plumbing capex.
Questions for the listing agent
- Built in 1950 — when were the roof, HVAC, electrical panel, plumbing, and water heater last replaced?
- Is there a deadline driving the sale (1031 exchange, divorce, estate, relocation)? That informs how much negotiation room exists.
- Schools are F-rated, which usually means shorter tenancies and higher turnover. Who's the typical renter profile here, and what's been the actual vacancy rate?
- Crime grade is D in this area — have there been break-ins, vandalism, or insurance claims at this property in the last 3 years? What carrier currently insures it and at what premium?
- The area grade is low — what's the realistic commute time and amenity access for the typical tenant pool here? Any planned neighborhood developments (good or bad) we should know about?
- What's the average days-on-market for RENTAL listings here right now (not sales)? A rising rental-DOM trend means longer vacancies and softer asking-rent achievability than the comps imply.
- What's the recent tenant-quality profile in this submarket — average credit score on applications, eviction rate, late-payment / NSF rate, and stable-employment percentage? A property-management company in the area should have these aggregated.
- How much new for-sale + rental construction is in the pipeline within 1–3 miles? Heavy new supply typically softens prices + rents 12–24 months out; constrained supply supports both.
Investment metrics
- 1% rule
- 0.78% ✗
- Cap rate
- 6.48%
- Cash-on-cash
- 0.66%
- DSCR
- 1.03
- GRM
- 10.7
CMA / ARV
- ARV (on-the-fly)
- $240,450
- Comps found
- 5
Show comp detail 5 sales within ~0.75 mi
| Address | Dist | Beds/Ba | Sqft | Sold | Price | $/sf | Match |
|---|---|---|---|---|---|---|---|
| 942 N 400 W | 0.34mi | 3/2.0 | 1,474 (+7%) | 23mo | $260,000 | $176 | 49 |
| 4504 Parkwood Dr | 0.72mi | 3/2.0 | 1,488 (+8%) | 8mo | $250,000 | $168 | 42 |
| 3839 W 100 N | 0.48mi | 3/1.0 | 1,530 (+11%) | 22mo | $343,450 | $224 | 40 |
| 904 Pinoak Dr | 0.71mi | 4/2.0 (+1) | 1,488 (+8%) | 11mo | $259,900 | $175 | 35 |
| 4408 Rosewood Dr | 0.73mi | 4/2.0 (+1) | 1,568 (+14%) | 5mo | $259,900 | $166 | 29 |
Match score weights: distance 35% · size 25% · config 20% · recency 20%. Top-matched comps best support the ARV.
Projected returns pro-forma
-3.0% appreciation · 0.0% rent growth · sell at horizon
- IRR
- -18.3%
- Equity multiple
- 0.37×
- Total profit
- $-29,834
- Equity at exit
- $25,333
- IRR
- -16.9%
- Equity multiple
- 0.18×
- Total profit
- $-39,164
- Equity at exit
- $14,690
Cash invested: $47,572 (down + closing). Projections, not guarantees.
Landlord ↔ Tenant lean methodology
- Overall (STATE)
- 90 Strongly Landlord-Friendly
- State Indiana
- 90 Strongly Landlord-Friendly · R+11
- County
- — inherits STATE
- City
- — inherits STATE
ZIP-level market 46901
- Home prices YoY
- -24.4%
- Rents YoY
- -1.5%
- Active inventory
- 246
- Price-to-rent
- 10.7×
Monthly cashflow live
- Estimated rent
- $1,326 medium interval (Pro) →
- Mortgage (P&I)
- −$891
- Tax from tax record
- −$60 /mo · $719/yr
- Insurance
- −$71
- HOA
- −$0
- Vacancy / Maint / Mgmt
- −$278
- Net cashflow
- $26
Break-even live
Sensitivity live
| Price | -10% $122 | -5% $74 | +0% $26 | +5% $-22 | +10% $-70 |
|---|---|---|---|---|---|
| Rent | -10% $-79 | -5% $-26 | +0% $26 | +5% $78 | +10% $131 |
| Rate | -1.0pp $112 | -0.5pp $69 | base $26 | +0.5pp $-18 | +1.0pp $-63 |
UW: 25.0% down · 7.5% · 30yr · 1.5% tax · 5.0% vac · 8.0% maint · 8.0% mgmt
Financing live
Cash to close
- Down payment
- $42,475
- Closing costs
- $5,097
- Reserves months
- —
- Total cash needed
- —
Loan-product check · same deal, 3 products live
Conventional
25% down · 7.5% · 30yr
- Down + closing
- —
- Monthly P&I
- —
- Monthly cashflow
- —
- DSCR
- —
- Eligible?
- —
Personal DTI + credit; lowest rate.
DSCR
20% down · 8.5% · 30yr
- Down + closing
- —
- Monthly P&I
- —
- Monthly cashflow
- —
- DSCR
- —
- Eligible?
- —
No personal income docs; deal must DSCR.
Hard money
10% down · 12.0% · 12mo
- Down + closing
- —
- Monthly P&I
- —
- Monthly cashflow
- —
- DSCR
- —
- Eligible?
- —
Short-term bridge; refi at stabilization.
Listing history 6 events
-
2026-06-21days on market $169,900 Active 6 DOM
-
2026-06-19pricedays on market $169,900 Active 4 DOM
-
2026-06-18days on market $179,000 Active 3 DOM
-
2026-06-17days on market $179,000 Active 2 DOM
-
2026-06-15remarks 699-char remark
-
2026-06-15$179,000 Active 1 DOM
ⓘ Source: listings_history table (triggers on properties + properties_extension) + one-shot
backfill from property_details.listing_events for pre-trigger history.
Tax reassessment forecast IN · Partial reset (capped growth)
- Current annual tax
- $719 · $60/mo
- Projected year-2 tax
- $1,081 · $90/mo
- Expected delta
- +$363/yr (+$30/mo · 50.5%)
ⓘ Screening estimate from a state-policy table — verify with the county assessor before closing.
Climate risk First Street
- Flood 1/10 Low FEMA zone X (unshaded) · 0% chance over 30 yrs
- Wildfire 1/10 Low
- Heat 3/10 Moderate 7 d/yr ≥101°F today · 17 d/yr by 30 yrs out
- Wind 2/10 Low 100% chance of damaging wind over 30 yrs
- Air quality 3/10 Moderate 1 unhealthy d/yr today · 3 by 30 yrs out
Nearby sold comps map
Loading sold comps map…
Walkable amenities ~0.75 mi
Loading nearby amenities…
Taxation est. · year 1
- Rental income
- $15,914
- − Mortgage interest
- −$9,517
- − Property taxes
- −$719
- − Insurance
- −$850
- − Repairs & maintenance
- −$1,273
- − Management
- −$1,273
- − Depreciation
- −$4,943
- Taxable loss
- −$2,660
- Est. tax savings @ 24.0%
- +$638
- After-tax cash flow
- $951/yr
For passive investors: Depreciation is non-cash, so a rental often shows a tax loss while cash-flowing — sheltering income. Rental losses are passive: they offset passive income freely, and up to $25,000/yr can offset ordinary (W-2) income if you actively participate and your MAGI is under $100k (phasing out to $0 by $150k); unused losses carry forward. On sale, claimed depreciation is recaptured at up to 25%, and gains may owe capital-gains tax (a 1031 exchange can defer both). Figures are a year-1 estimate at your 24.0% rate — not tax advice; consult a CPA.
Schools (NCES district)
- District
- Northwestern School Corporation
- NCES district ID
- 1802040
- Math proficiency
- 50% ▲ 2.00%
- Reading proficiency
- 53% ▬ 0.00%
- Median HH income
- $68,602
- Composite
- 45.8/100
- National rank
- #2559
- State rank
- #35 of 301 in IN
Livability — Kokomo
- Score
- 68/100
- State rank
- #227
- US rank
- #9912
Category grades
Schools grade is shown separately in the Schools card above.
Census & demographics
- County
- Howard County · 75,099 people
- City population
- 75,099
- Metro
- Kokomo, IN
- Population (ZIP)
- 38,082
- Household income
- $60,495
- Rent vs Own
- Severe rent burden
- 1116.0
Population outlook (Howard County) Hauer SSP2
- Today (2025)
- 81,522 people
- By 2030
- 80,104 · -1.7%
- By 2040
- 76,708 · -5.9%
- By 2050
- 72,880 · -10.6%
- By 2075
- 64,016 · -21.5%
- By 2100
- 51,705 · -36.6%
Race, ethnicity, and origin ACS 2023
- Neighborhood character
- Predominantly White (83%)
- Race & ethnicity
- White 83% Black 9% Two or more races 5% Hispanic / Latino 4%
- Common ancestry
- Italian 2% Romanian 2% Slovak 1%
- Foreign-born
- 1% · Canada
- Languages at home
- 96% English-only · German/W. Germanic 1% Spanish 1%
Political lean MEDSL · Howard
- 2024 margin
- Solid R (+35.3) · D 31.4% · R 66.7% · Other 1.8%
- 2008→2024 swing
- -29.1pp toward R · 2008: -6.2pp · 2024: -35.3pp
- All cycles
- 2024: R+35.3 2020: R+32.4 2016: R+33.9 2012: R+14.3 2008: R+6.2
Not yet ingested
- Civics
- —
Market trends
- HPI YoY
- ▼ -78.40%
- Current HPI
- 242.2565
- Rent YoY
- ▼ -1.47%
- Metro
- Kokomo, IN
- State GDP YoY
- ▲ 2.90%
- F500 in state
- 18
Industry mix (Fortune 500 HQ in IN)
| Industry | F500 HQs | Revenue |
|---|---|---|
| Industrial Machinery | 2 | $37B |
|
||
| Healthcare | 1 | $177B |
|
||
| Pharmaceuticals | 1 | $45B |
|
||
| Metals / Steel | 1 | $18B |
|
||
| Agriculture | 1 | $17B |
|
||
| Packaging | 1 | $12B |
|
||
Price history
+110.6% since first listed5 events — show timeline
- 2026-06-15 Listed $179,000 IRMLS
- 2020-07-24 Sold (MLS) $147,000 IRMLS
- 2020-06-22 Listed $145,000 IRMLS
- 2014-11-12 Listed $85,000 IRMLS
- 2014-11-12 Sold (MLS) $85,000 IRMLS
Property tax history
-3.6%/yrLatest (2024): $719 · +13.8% YoY. Source: county tax records.
Cash-flow waterfall
monthlySold comps — $/sqft
last 12 mo · ≤1 miLoading sold comps…