2074 W Green St · Franklinton, NC
Flood risk 1/10 · Minimal
- FEMA flood zone
- X (unshaded)
- Chance of flooding over 30 yrs
- 0.0%
- Est. flood insurance / yr
- $507 – $1,088
Fire risk 3/10 · Minor
- Est. fire insurance / yr
- $906 – $1,684
Heat risk 6/10 · Moderate
- Hot days now (above 105°F)
- 7 days/yr
- Hot days in 30 yrs
- 17 days/yr
Wind risk 2/10 · Minimal
- Chance of severe wind over 30 yrs
- —
Air-quality risk 2/10 · Minimal
- Unhealthy air days now
- 1 days/yr
- Unhealthy air days in 30 yrs
- 1 days/yr
Risk factors via First Street. Map © Google.
Why this score? — see what drove the D grade
The composite is a weighted blend of 9 inputs, each scored 0–100. Each bar is that input's sub-score; the figure is the points it added to the 100-point composite (weight × sub-score).
- Cash flow +9.2/30.0
- Appreciation +9.2/10.0
- ARV discount +7.4/15.0
- Livability +3.1/5.0
- Schools +3.0/10.0
- DSCR +2.6/10.0
- Rent growth +2.5/5.0
- Condition / age +2.5/5.0
- 1% rule +1.5/10.0
$275,000
🖨 Deal sheet (PDF) 📄 Offer letter ✓ Due diligence
Listing remarks
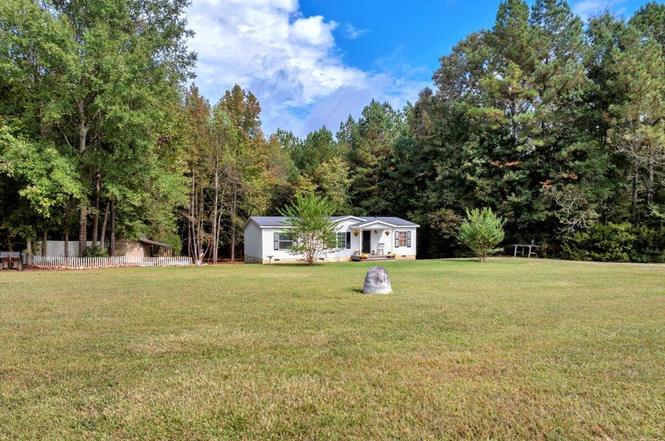
Discover country living at its best at 2074 W Green Street in Franklinton. Set on just over 3 acres, this charming 3-bedroom, 2-bath home offers the perfect combination of space, privacy, and opportunity to enjoy life outdoors. The property is home to established fruit trees--plum, peach, apple, and pear--already producing and ready to harvest. Open land, mature trees, and multiple pens make this property ideal for gardening, small animals, or creating your own backyard retreat. Inside, the home offers a comfortable layout with natural light and peaceful views in every direction. Enjoy the quiet of country living while being just a short drive to the vibrant downtown areas of Franklinton an
Key facts
- Open land
- Natural light
- Multiple pens
Tags
Neighborhood map
What this means for you Summary
Snapshot
- This is a 3-bed/2.0-bath manufactured listed at $275k.
Deal economics
- At list price, monthly cash flow is $-209 ($-3k/yr) — negative.
- To cash-flow at today's rent, offer at most $238k (13.4% below list).
- To meet the 1% rule (rent ≥ 1% of price), the offer needs to be $180k (34.5% below list).
- Recommended offer: $180k (34.5% below list) — sets the bar for 1% rule.
- Cap rate 5.4% vs local median 3.1% in Franklinton — top-decile yield for the area; either an underpriced asset or a hidden risk that comps aren't pricing in. Stress-test before assuming the spread holds.
Location & tenants
- Location reads 61/100 on livability (#491 in NC) — a middle-class / working-renter tenant base. Strengths: cost of living A+, housing A+; Watch: crime D, amenities F, commute F.
- Franklin County Schools (rural): math 34% / reading 37% proficiency, ranked #128 of 178 in NC (top 72%) — families likely to look elsewhere, expect single-tenant / working-renter base with shorter leases.
- Zoned schools: Franklinton Elementary (math 29% / reading 25%, grade F, #1,033 of 1,410 statewide, top 76%, 522 students, 81% FRL); Franklinton Middle (math 26% / reading 27%, grade F, #381 of 475 statewide, top 81%, 247 students, 78% FRL); Franklinton High (math 57% / reading 60%, grade C, #235 of 535 statewide, top 45%, 1,182 students, 48% FRL).
- Market conditions: 251 active listings in the ZIP; 948 units permitted in Franklin County in 2024 (0 in 5+ unit buildings).
Forward outlook
- In year one you build about $25k of equity ($2k loan paydown + $23k appreciation (8.4% local appreciation)).
- Franklin County population projected at +13% by 2050 — modest demand growth; plan on rents tracking national, not racing it.
- By year 2, paydown + projected appreciation supports a ~$40k cash-out refi (75% LTV) — recoverable capital for the next deal without selling this one.
Negotiation context
- It's been on market 199 days — a 12% lower offer ($242k) is reasonable based on typical stale-listing flexibility.
- 5 sale attempts since 21y ago; this cycle's ask has dropped $25k (8%) from the opening price — seller is motivated, your offer sets the floor, not the list.
- Current owner paid $91k; list at $275k implies a 202% gain — meaningful room to come down on a strong offer.
Risks & watch-outs
- Climate carrying-cost: extreme-heat days projected 7→17/yr by 2055 (HVAC capex compounding) — expect insurance premiums to compound above CPI over the hold.
Questions for the listing agent
- What do current leases actually rent for vs. the listed asking? Can we see a recent rent roll and the last 12 months of T-12 income?
- It's been on market 199 days. Have you received any prior offers? Is the seller open to a 35% concession, seller financing, or rate buy-down credit?
- Why hasn't it sold? Are there any deal-killer items the seller is aware of (foundation, flood, title, zoning, code violations)?
- Is there a deadline driving the sale (1031 exchange, divorce, estate, relocation)? That informs how much negotiation room exists.
- Schools are F-rated, which usually means shorter tenancies and higher turnover. Who's the typical renter profile here, and what's been the actual vacancy rate?
- Crime grade is D in this area — have there been break-ins, vandalism, or insurance claims at this property in the last 3 years? What carrier currently insures it and at what premium?
- The area grade is low — what's the realistic commute time and amenity access for the typical tenant pool here? Any planned neighborhood developments (good or bad) we should know about?
- What's the average days-on-market for RENTAL listings here right now (not sales)? A rising rental-DOM trend means longer vacancies and softer asking-rent achievability than the comps imply.
- What's the recent tenant-quality profile in this submarket — average credit score on applications, eviction rate, late-payment / NSF rate, and stable-employment percentage? A property-management company in the area should have these aggregated.
- How much new for-sale + rental construction is in the pipeline within 1–3 miles? Heavy new supply typically softens prices + rents 12–24 months out; constrained supply supports both.
Investment metrics
- 1% rule
- 0.65% ✗
- Cap rate
- 5.38%
- Cash-on-cash
- -3.25%
- DSCR
- 0.86
- GRM
- 12.7
CMA / ARV
- ARV (on-the-fly)
- $274,428
- Comps found
- 1
Show comp detail 1 sale within ~0.75 mi
| Address | Dist | Beds/Ba | Sqft | Sold | Price | $/sf | Match |
|---|---|---|---|---|---|---|---|
| 2074 W Green St | 0.00mi | 3/2.0 | 1,188 (0%) | 1mo | $275,000 | $231 | 99 |
Match score weights: distance 35% · size 25% · config 20% · recency 20%. Top-matched comps best support the ARV.
Projected returns pro-forma
8.42% appreciation · 3.0% rent growth · sell at horizon
- IRR
- 18.5%
- Equity multiple
- 2.39×
- Total profit
- $107,304
- Equity at exit
- $216,856
- IRR
- 17.3%
- Equity multiple
- 5.17×
- Total profit
- $321,417
- Equity at exit
- $438,249
Cash invested: $77,000 (down + closing). Projections, not guarantees.
Landlord ↔ Tenant lean methodology
- Overall (STATE)
- 85 Strongly Landlord-Friendly
- State North Carolina
- 85 Strongly Landlord-Friendly · R+3
- County
- — inherits STATE
- City
- — inherits STATE
ZIP-level market 27525
- Home prices YoY
- 3.0%
- Active inventory
- 251
- Price-to-rent
- 12.7×
Monthly cashflow live
- Estimated rent
- $1,801 medium interval (Pro) →
- Mortgage (P&I)
- −$1,442
- Tax from tax record
- −$75 /mo · $894/yr
- Insurance
- −$115
- HOA
- −$0
- Vacancy / Maint / Mgmt
- −$378
- Net cashflow
- $-209
Break-even live
Sensitivity live
| Price | -10% $-53 | -5% $-131 | +0% $-209 | +5% $-287 | +10% $-364 |
|---|---|---|---|---|---|
| Rent | -10% $-351 | -5% $-280 | +0% $-209 | +5% $-138 | +10% $-67 |
| Rate | -1.0pp $-70 | -0.5pp $-139 | base $-209 | +0.5pp $-280 | +1.0pp $-353 |
UW: 25.0% down · 7.5% · 30yr · 1.5% tax · 5.0% vac · 8.0% maint · 8.0% mgmt
Financing live
Cash to close
- Down payment
- $68,750
- Closing costs
- $8,250
- Reserves months
- —
- Total cash needed
- —
Loan-product check · same deal, 3 products live
Conventional
25% down · 7.5% · 30yr
- Down + closing
- —
- Monthly P&I
- —
- Monthly cashflow
- —
- DSCR
- —
- Eligible?
- —
Personal DTI + credit; lowest rate.
DSCR
20% down · 8.5% · 30yr
- Down + closing
- —
- Monthly P&I
- —
- Monthly cashflow
- —
- DSCR
- —
- Eligible?
- —
No personal income docs; deal must DSCR.
Hard money
10% down · 12.0% · 12mo
- Down + closing
- —
- Monthly P&I
- —
- Monthly cashflow
- —
- DSCR
- —
- Eligible?
- —
Short-term bridge; refi at stabilization.
Listing history 2 events
-
2026-05-31remarks 699-char remark
-
2026-05-31$275,000 Pending 199 DOM
ⓘ Source: listings_history table (triggers on properties + properties_extension) + one-shot
backfill from property_details.listing_events for pre-trigger history.
Tax reassessment forecast NC · Resets to sale price
- Current annual tax
- $894 · $75/mo
- Projected year-2 tax
- $2,255 · $188/mo
- Expected delta
- +$1,361/yr (+$113/mo · 152.2%)
ⓘ Screening estimate from a state-policy table — verify with the county assessor before closing.
Climate risk First Street
- Flood 1/10 Low FEMA zone X (unshaded) · 0% chance over 30 yrs
- Wildfire 3/10 Moderate
- Heat 6/10 Major 7 d/yr ≥105°F today · 17 d/yr by 30 yrs out
- Wind 2/10 Low
- Air quality 2/10 Low 1 unhealthy d/yr today · 1 by 30 yrs out
Nearby sold comps map
Loading sold comps map…
Walkable amenities ~0.75 mi
Loading nearby amenities…
Taxation est. · year 1
- Rental income
- $21,607
- − Mortgage interest
- −$15,404
- − Property taxes
- −$894
- − Insurance
- −$1,375
- − Repairs & maintenance
- −$1,729
- − Management
- −$1,729
- − Depreciation
- −$8,000
- Taxable loss
- −$7,524
- Est. tax savings @ 24.0%
- +$1,806
- After-tax cash flow
- $-700/yr
For passive investors: Depreciation is non-cash, so a rental often shows a tax loss while cash-flowing — sheltering income. Rental losses are passive: they offset passive income freely, and up to $25,000/yr can offset ordinary (W-2) income if you actively participate and your MAGI is under $100k (phasing out to $0 by $150k); unused losses carry forward. On sale, claimed depreciation is recaptured at up to 25%, and gains may owe capital-gains tax (a 1031 exchange can defer both). Figures are a year-1 estimate at your 24.0% rate — not tax advice; consult a CPA.
Schools (NCES district)
- District
- Franklin County Schools
- NCES district ID
- 3701530
- Math proficiency
- 34% ▬ 0.00%
- Reading proficiency
- 37% ▼ -4.00%
- Median HH income
- $44,630
- Composite
- 30.25/100
- National rank
- #6286
- State rank
- #128 of 178 in NC
Livability — Franklinton
- Score
- 61/100
- State rank
- #491
- US rank
- #18002
Category grades
Schools grade is shown separately in the Schools card above.
Census & demographics
- County
- Franklin County · 64,885 people
- City population
- 17,110
- Metro
- Raleigh-Cary, NC
- Population (ZIP)
- 17,110
- Household income
- $73,036
- Rent vs Own
- Severe rent burden
- 446.0
Population outlook (Franklin County) Hauer SSP2
- Today (2025)
- 69,848 people
- By 2030
- 72,480 · +3.8%
- By 2040
- 76,682 · +9.8%
- By 2050
- 78,993 · +13.1%
- By 2075
- 82,888 · +18.7%
- By 2100
- 80,784 · +15.7%
Race, ethnicity, and origin ACS 2023
- Neighborhood character
- Predominantly White (66%)
- Race & ethnicity
- White 66% Black 24% Hispanic / Latino 6% Two or more races 5%
- Hispanic origin (detail)
- Mexican 3% Cuban 2%
- Common ancestry
- Slovak 3% Serbian 2% Italian 2%
- Foreign-born
- 3% · Canada
- Languages at home
- 94% English-only · Spanish 3% German/W. Germanic 1%
Political lean MEDSL · Franklin
- 2024 margin
- R (+13.6) · D 42.7% · R 56.3%
- 2008→2024 swing
- -12.9pp toward R · 2008: -0.7pp · 2024: -13.6pp
- All cycles
- 2024: R+13.6 2020: R+13.4 2016: R+11.7 2012: R+4.2 2008: R+0.7
Not yet ingested
- Civics
- —
Market trends
- HPI YoY
- ▲ 8.42%
- Current HPI
- 294.1531
- Rent YoY
- —
- Metro
- Raleigh-Cary, NC
- State GDP YoY
- ▲ 3.28%
- F500 in state
- 26
Industry mix (Fortune 500 HQ in NC)
| Industry | F500 HQs | Revenue |
|---|---|---|
| Financial Services | 2 | $213B |
|
||
| Retail | 2 | $95B |
|
||
| Industrial Conglomerate | 1 | $38B |
|
||
| Metals / Steel | 1 | $35B |
|
||
| Utilities | 1 | $30B |
|
||
| Industrial Machinery | 1 | $19B |
|
||
Price history
+221.6% since first listed13 events — show timeline
- 2026-04-26 Pending — TMLS
- 2026-03-25 Price Changed $275,000 TMLS
- 2025-11-25 Price Changed $290,000 TMLS
- 2025-10-09 Listed $300,000 TMLS
- 2007-08-01 Sold (Public Records) $91,000 Public Records
- 2007-06-14 Listed $89,900 TMLS
- 2007-06-05 Listing Removed — TMLS
- 2006-12-04 Listed $89,900 TMLS
- 2005-11-30 Sold (Public Records) $86,500 Public Records
- 2005-11-30 Sold (MLS) $86,500 AMLSNC
- 2005-11-30 Sold (MLS) $86,500 TMLS
- 2005-07-28 Listed $85,500 AMLSNC
- 2005-07-28 Listed $85,500 TMLS
Property tax history
-1.4%/yrLatest (2025): $894 · +0.8% YoY. Source: county tax records.
Cash-flow waterfall
monthlySold comps — $/sqft
last 12 mo · ≤1 miLoading sold comps…