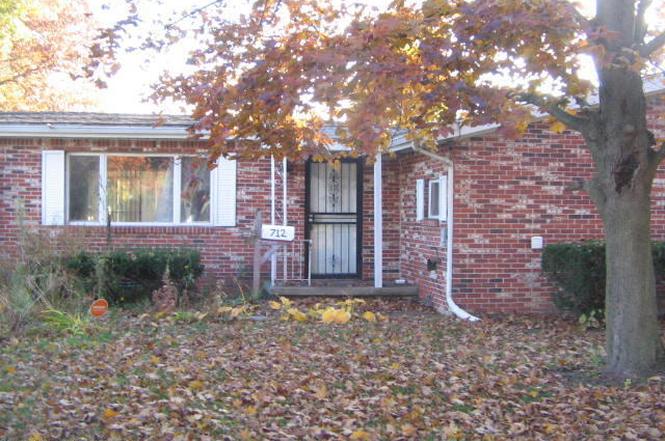
712 Underwood Ave · Toledo, OH
Flood risk 1/10 · Minimal
- FEMA flood zone
- X (unshaded)
- Chance of flooding over 30 yrs
- 0.0%
- Est. flood insurance / yr
- $507 – $1,088
Fire risk 1/10 · Minimal
- Est. fire insurance / yr
- $713 – $1,323
Heat risk 3/10 · Minor
- Hot days now (above 101°F)
- 7 days/yr
- Hot days in 30 yrs
- 16 days/yr
Wind risk 2/10 · Minimal
- Chance of severe wind over 30 yrs
- —
Air-quality risk 2/10 · Minimal
- Unhealthy air days now
- 1 days/yr
- Unhealthy air days in 30 yrs
- 2 days/yr
Risk factors via First Street. Map © Google.
Why this score? — see what drove the B- grade
The composite is a weighted blend of 9 inputs, each scored 0–100. Each bar is that input's sub-score; the figure is the points it added to the 100-point composite (weight × sub-score).
- Cash flow +24.8/30.0
- ARV discount +14.6/15.0
- DSCR +8.0/10.0
- 1% rule +6.2/10.0
- Rent growth +4.5/5.0
- Livability +3.3/5.0
- Condition / age +2.5/5.0
- Schools +1.6/10.0
- Appreciation +0.0/10.0
$114,900
🖨 Deal sheet 📄 Offer letter ✓ Due diligence
Listing remarks MLS
Estate property on the corner of Victory and Underwood. Nice brick home located on two lots. 3 Large bed rooms, large Master bedroom, large family room with wood floors, 2 car attached garage., screen porch attached to family room. Custom Brick Barbecue Gill and New sump pump drainage. Motivate Seller!
Key facts
- 4,900 sq ft lot
- 2 garage spots
- Built 1956
Neighborhood map
What this means for you Summary
Snapshot
- This is a 3-bed/1.5-bath single-family listed at $115k.
Deal economics
- At list price, monthly cash flow is $243 ($3k/yr) — positive.
- The deal already cash-flows at list — no discount required.
- Meets the 1% rule at list price ($1k rent vs $115k).
- Recommended offer: $111k (3.0% below list) — sets the bar for market timing.
Location & tenants
- Location reads 66/100 on livability (#645 in OH) — a middle-class / working-renter tenant base. Strengths: cost of living A+, housing A+, health & safety A+; Watch: amenities C-, crime F, commute F.
- Toledo City (urban): math 15% / reading 24% proficiency, ranked #634 of 656 in OH (top 97%) — low school quality limits family demand, transient renter base, plan for 1-2y turnover; 72% free/reduced lunch — lower-income household profile, screen leases tightly.
- Zoned schools: Keyser Elementary School (math 8% / reading 12%, grade F, #1,471 of 1,584 statewide, top 95%, 306 students, 0% FRL); Rogers High School (math 8% / reading 27%, grade F, #689 of 781 statewide, top 90%, 721 students, 0% FRL) — zoned schools average 0% FRL vs 72% district-wide (72 pts lower); this property's tenant base skews higher-income than the district average.
- Market conditions: Rents rising fast (+8.2%/yr); 83 active listings in the ZIP; 13 comparable units currently listed for rent nearby; rentals lingering (median 44d on market — plan ~5-8 weeks vacancy on turnover, expect pricing pressure); 54% of comp listings sitting > 30 days — soft ceiling on asking rent; lower-income renter base — watch delinquency; 415 units permitted in Lucas County in 2024 (122 in 5+ unit buildings).
- This rent runs 37% of the median local income ($41k/yr) — at the standard rent-burdened threshold; future hikes will face affordability resistance.
Forward outlook
- Local home prices are declining (-3.0%/yr); year-one equity from $794 of loan paydown is wiped out by about $3k of value loss. Plan a longer hold.
- Lucas County population projected at -16% by 2050 — secular population decline; favor cash flow + early exit over multi-decade hold.
- At projected returns (-3.0% appreciation + 8.0% rent growth), your $32k cash investment doubles in ~8 years — after that, you're playing with house money.
Negotiation context
- It's been on market 48 days — a 3% lower offer ($111k) is reasonable based on typical stale-listing flexibility.
- 2 sale attempts since 13y ago; this cycle's ask has dropped $15k (12%) from the opening price — seller is motivated, your offer sets the floor, not the list.
- Current owner paid $43k; list at $115k implies a 167% gain — meaningful room to come down on a strong offer.
Risks & watch-outs
- Watch-outs: built in 1956 — expect roof / HVAC / electrical / plumbing capex.
Questions for the listing agent
- It's been on market 48 days. Have you received any prior offers? Is the seller open to a 3% concession, seller financing, or rate buy-down credit?
- Built in 1956 — when were the roof, HVAC, electrical panel, plumbing, and water heater last replaced?
- Is there a deadline driving the sale (1031 exchange, divorce, estate, relocation)? That informs how much negotiation room exists.
- Schools are D-rated, which usually means shorter tenancies and higher turnover. Who's the typical renter profile here, and what's been the actual vacancy rate?
- Crime grade is F in this area — have there been break-ins, vandalism, or insurance claims at this property in the last 3 years? What carrier currently insures it and at what premium?
- What's the average days-on-market for RENTAL listings here right now (not sales)? A rising rental-DOM trend means longer vacancies and softer asking-rent achievability than the comps imply.
- What's the recent tenant-quality profile in this submarket — average credit score on applications, eviction rate, late-payment / NSF rate, and stable-employment percentage? A property-management company in the area should have these aggregated.
- How much new for-sale + rental construction is in the pipeline within 1–3 miles? Heavy new supply typically softens prices + rents 12–24 months out; constrained supply supports both.
Investment metrics
- 1% rule
- 1.12% ✓
- Cap rate
- 8.84%
- Cash-on-cash
- 9.08%
- DSCR
- 1.40
- GRM
- 7.5
CMA / ARV
- ARV (on-the-fly)
- $136,448
- Comps found
- 12
Show comp detail 12 sales within ~0.75 mi
| Address | Dist | Beds/Ba | Sqft | Sold | Price | $/sf | Match |
|---|---|---|---|---|---|---|---|
| 712 Underwood Ave | 0.00mi | 3/1.0 | 1,312 (0%) | 1mo | $80,000 | $61 | 97 |
| 904 Mackow Dr | 0.16mi | 3/1.0 | 1,369 (+4%) | 9mo | $147,000 | $107 | 76 |
| 2901 Avondale Ave | 0.25mi | 3/2.0 | 1,293 (-1%) | 11mo | $107,000 | $83 | 75 |
| 735 Brookley Blvd | 0.06mi | 3/1.0 | 1,200 (-8%) | 9mo | $130,000 | $108 | 73 |
| 3226 Inverness Ave | 0.34mi | 3/2.5 | 1,266 (-4%) | 3mo | $113,300 | $89 | 72 |
| 1006 Brookley Blvd | 0.23mi | 3/1.0 | 1,232 (-6%) | 10mo | $175,000 | $142 | 68 |
| 732 Moran Ave | 0.14mi | 3/2.0 | 1,145 (-13%) | 8mo | $152,000 | $133 | 64 |
| 802 Cuthbert Rd | 0.36mi | 3/2.0 | 1,443 (+10%) | 7mo | $150,000 | $104 | 59 |
| 823 N Byrne Rd | 0.52mi | 2/1.0 (-1) | 1,245 (-5%) | 2mo | $112,500 | $90 | 58 |
| 1023 Underwood Ave | 0.25mi | 4/2.0 (+1) | 1,192 (-9%) | 11mo | $139,900 | $117 | 57 |
| 914 Turner Ave | 0.30mi | 2/1.0 (-1) | 1,174 (-10%) | 9mo | $35,000 | $30 | 54 |
| 830 N Byrne Rd | 0.49mi | 3/1.0 | 1,157 (-12%) | 4mo | $105,000 | $91 | 52 |
Match score weights: distance 35% · size 25% · config 20% · recency 20%. Top-matched comps best support the ARV.
Projected returns pro-forma
-3.0% appreciation · 8.0% rent growth · sell at horizon
- IRR
- 2.8%
- Equity multiple
- 1.11×
- Total profit
- $3,666
- Equity at exit
- $17,132
- IRR
- 16.6%
- Equity multiple
- 2.68×
- Total profit
- $54,008
- Equity at exit
- $9,934
Cash invested: $32,172 (down + closing). Projections, not guarantees.
Landlord ↔ Tenant lean methodology
- Overall (STATE)
- 73 Landlord-Friendly
- State Ohio
- 73 Landlord-Friendly · R+6
- County
- — inherits STATE
- City
- — inherits STATE
ZIP-level market 43607
- Home prices YoY
- -27.5%
- Rents YoY
- 8.2%
- Active inventory
- 83
- Price-to-rent
- 7.5×
Monthly cashflow live
- Estimated rent
- $1,282 high interval (Pro) →
- Mortgage (P&I)
- −$603
- Tax from tax record
- −$119 /mo · $1,425/yr
- Insurance
- −$48
- HOA
- −$0
- Vacancy / Maint / Mgmt
- −$269
- Net cashflow
- $243
Break-even live
UW: 25.0% down · 7.5% · 30yr · 1.5% tax · 5.0% vac · 8.0% maint · 8.0% mgmt
Financing live
Cash to close
- Down payment
- $28,725
- Closing costs
- $3,447
- Reserves months
- —
- Total cash needed
- —
Loan-product check · same deal, 3 products live
Conventional
25% down · 7.5% · 30yr
- Down + closing
- —
- Monthly P&I
- —
- Monthly cashflow
- —
- DSCR
- —
- Eligible?
- —
Personal DTI + credit; lowest rate.
DSCR
20% down · 8.5% · 30yr
- Down + closing
- —
- Monthly P&I
- —
- Monthly cashflow
- —
- DSCR
- —
- Eligible?
- —
No personal income docs; deal must DSCR.
Hard money
10% down · 12.0% · 12mo
- Down + closing
- —
- Monthly P&I
- —
- Monthly cashflow
- —
- DSCR
- —
- Eligible?
- —
Short-term bridge; refi at stabilization.
Rent comps 13 comps
| Address | Beds | Baths | Sqft | Rent | $/sqft | DOM | Units | Dist |
|---|---|---|---|---|---|---|---|---|
| 932 Turner Ave Toledo, OH | 2.0 | 1.0 | 960 | $1,295 | $1.35 | 14d | 1 | 0.34mi |
| 536 Carver Blvd Toledo, OH | 3.0 | 1.0 | 1204 | $1,195 | $0.99 | 23d | 1 | 1.03mi |
| 2637 Greenway St Toledo, OH | 2.0 | 1.0 | 1082 | $900 | $0.83 | 44d | 1 | 1.13mi |
| 1133 Parkside Blvd Toledo, OH | 2.0 | 1.0 | 960 | $850 | $0.89 | 44d | 1 | 1.15mi |
| 2030 Wyndhurst Rd Toledo, OH | 2.0 | 1.0 | 1042 | $950 | $0.91 | 44d | 1 | 1.17mi |
| 2037 Alvin St Toledo, OH | 3.0 | 1.0 | 1260 | $1,175 | $0.93 | 44d | 1 | 1.19mi |
| 2314 Airline Ave Toledo, OH | 3.0 | 1.0 | 1123 | $1,478 | $1.32 | 23d | 1 | 1.24mi |
| 915 Woodstock Ave Toledo, OH | 3.0 | 1.5 | 1500 | $1,100 | $0.73 | 23d | 1 | 1.27mi |
| 2535 W Bancroft St Unit 8 Toledo, OH | 2.0 | 1.0 | 900 | $895 | $0.99 | 44d | 1 | 1.29mi |
| 307 Danberry St Toledo, OH | 2.0 | 1.0 | 988 | $950 | $0.96 | 44d | 1 | 1.39mi |
| 569 Colima Dr Toledo, OH | 3.0 | 1.0 | 1253 | $1,300 | $1.04 | 23d | 1 | 1.43mi |
| 581 Colima Dr Toledo, OH | 2.0 | 1.0 | 900 | $1,100 | $1.22 | 14d | 1 | 1.45mi |
| 619 Durango Dr Toledo, OH | 3.0 | 1.0 | 1276 | $1,350 | $1.06 | 44d | 1 | 1.46mi |
Listing history 9 events
-
2026-03-18status Pending
-
2026-03-07price $114,900
-
2026-01-29$129,900 Active
-
2025-10-14price $18,000 306-char remark
Show marketing remark (306 chars)
Estate property on the corner of Victory and Underwood. Nice brick home located on two lots. 3 Large bed rooms, large Master bedroom, large family room with wood floors, 2 car attached garage., screen porch attached to family room. Custom Brick Barbecue Gill and New sump pump drainage. Motivate Seller!
-
2014-07-30soldstatus $43,000
-
2014-03-28soldstatus $18,000 306-char remark
Show marketing remark (306 chars)
Estate property on the corner of Victory and Underwood. Nice brick home located on two lots. 3 Large bed rooms, large Master bedroom, large family room with wood floors, 2 car attached garage., screen porch attached to family room. Custom Brick Barbecue Gill and New sump pump drainage. Motivate Seller!
-
2014-03-28soldstatus $18,000
Show marketing remark (306 chars)
Estate property on the corner of Victory and Underwood. Nice brick home located on two lots. 3 Large bed rooms, large Master bedroom, large family room with wood floors, 2 car attached garage., screen porch attached to family room. Custom Brick Barbecue Gill and New sump pump drainage. Motivate Seller!
-
2014-03-19price $25,000 306-char remark
Show marketing remark (306 chars)
Estate property on the corner of Victory and Underwood. Nice brick home located on two lots. 3 Large bed rooms, large Master bedroom, large family room with wood floors, 2 car attached garage., screen porch attached to family room. Custom Brick Barbecue Gill and New sump pump drainage. Motivate Seller!
-
2013-11-08$25,000 306-char remark
Show marketing remark (306 chars)
Estate property on the corner of Victory and Underwood. Nice brick home located on two lots. 3 Large bed rooms, large Master bedroom, large family room with wood floors, 2 car attached garage., screen porch attached to family room. Custom Brick Barbecue Gill and New sump pump drainage. Motivate Seller!
ⓘ Source: listings_history table (triggers on properties + properties_extension) + one-shot
backfill from property_details.listing_events for pre-trigger history.
Tax reassessment forecast OH · Partial reset (capped growth)
- Current annual tax
- $1,425 · $119/mo
- Projected year-2 tax
- $1,609 · $134/mo
- Expected delta
- +$184/yr (+$15/mo · 12.9%)
ⓘ Screening estimate from a state-policy table — verify with the county assessor before closing.
Climate risk First Street
- Flood 1/10 Low FEMA zone X (unshaded) · 0% chance over 30 yrs
- Wildfire 1/10 Low
- Heat 3/10 Moderate 7 d/yr ≥101°F today · 16 d/yr by 30 yrs out
- Wind 2/10 Low
- Air quality 2/10 Low 1 unhealthy d/yr today · 2 by 30 yrs out
Nearby sold comps map
Loading sold comps map…
Walkable amenities ~0.75 mi
Loading nearby amenities…
Taxation est. · year 1
- Rental income
- $15,382
- − Mortgage interest
- −$6,436
- − Property taxes
- −$1,425
- − Insurance
- −$574
- − Repairs & maintenance
- −$1,231
- − Management
- −$1,231
- − Depreciation
- −$3,343
- Taxable income
- $1,142
- Est. tax owed @ 24.0%
- −$274
- After-tax cash flow
- $2,647/yr
For passive investors: Depreciation is non-cash, so a rental often shows a tax loss while cash-flowing — sheltering income. Rental losses are passive: they offset passive income freely, and up to $25,000/yr can offset ordinary (W-2) income if you actively participate and your MAGI is under $100k (phasing out to $0 by $150k); unused losses carry forward. On sale, claimed depreciation is recaptured at up to 25%, and gains may owe capital-gains tax (a 1031 exchange can defer both). Figures are a year-1 estimate at your 24.0% rate — not tax advice; consult a CPA.
Schools (NCES district)
- District
- Toledo City
- NCES district ID
- 3904490
- Math proficiency
- 15% ▼ -16.00%
- Reading proficiency
- 24% ▼ -13.00%
- Median HH income
- $32,137
- Composite
- 15.76/100
- National rank
- #9276
- State rank
- #634 of 656 in OH
Livability — Toledo
- Score
- 66/100
- State rank
- #645
- US rank
- #11442
Category grades
Schools grade is shown separately in the Schools card above.
Census & demographics
- Census place
- Toledo, OH
- County
- Lucas County · 380,724 people
- City population
- 280,811
- Metro
- Toledo, OH
- Population (ZIP)
- 19,469
- Household income
- $41,335
- Rent vs Own
- Severe rent burden
- 1157.0
Population outlook (Lucas County) Hauer SSP2
- Today (2025)
- 420,751 people
- By 2030
- 410,187 · -2.5%
- By 2040
- 384,019 · -8.7%
- By 2050
- 355,125 · -15.6%
- By 2075
- 291,683 · -30.7%
- By 2100
- 233,670 · -44.5%
Race, ethnicity, and origin ACS 2023
- Neighborhood character
- Diverse neighborhood (Simpson 0.57)
- Race & ethnicity
- Black 59% White 27% Two or more races 6% Hispanic / Latino 6% Asian 3%
- Hispanic origin (detail)
- Mexican 3% Puerto Rican 2%
- Common ancestry
- Lithuanian 2% Romanian 2% Slovak 1%
- Foreign-born
- 4% · Canada
- Languages at home
- 94% English-only · Other Indo-European 1% Spanish 1% Russian/Polish/Slavic 1%
Political lean MEDSL · Lucas
- 2024 margin
- D (+12.6) · D 55.8% · R 43.2%
- 2008→2024 swing
- -18.9pp toward R · 2008: 31.4pp · 2024: 12.6pp
- All cycles
- 2024: D+12.6 2020: D+16.8 2016: D+17.4 2012: D+30.4 2008: D+31.4
Not yet ingested
- Civics
- —
Market trends
- HPI YoY
- ▼ -66.58%
- Current HPI
- 175.2772
- Rent YoY
- ▲ 8.19%
- Metro
- Toledo, OH
- State GDP YoY
- ▲ 1.98%
- F500 in state
- 48
Industry mix (Fortune 500 HQ in OH)
| Industry | F500 HQs | Revenue |
|---|---|---|
| Insurance | 3 | $145B |
|
||
| Industrial Machinery | 3 | $49B |
|
||
| Financial Services | 3 | $24B |
|
||
| Consumer Goods | 2 | $93B |
|
||
| Aerospace / Defense | 2 | $47B |
|
||
| Utilities | 2 | $33B |
|
||
Price history
+359.6% since first listed9 events — show timeline
- 2026-03-18 Pending — NORIS
- 2026-03-07 Price Changed $114,900 NORIS
- 2026-01-29 Listed $129,900 NORIS
- 2025-10-14 Price Changed $18,000 NORIS
- 2014-07-30 Sold (Public Records) $43,000 Public Records
- 2014-03-28 Sold (Public Records) $18,000 Public Records
- 2014-03-28 Sold (MLS) $18,000 NORIS
- 2014-03-19 Price Changed $25,000 NORIS
- 2013-11-08 Listed $25,000 NORIS
Property tax history
+6.3%/yrLatest (2025): $1,425 · -0.0% YoY. Source: county tax records.
Cash-flow waterfall
monthlySold comps — $/sqft
last 12 mo · ≤1 miLoading sold comps…