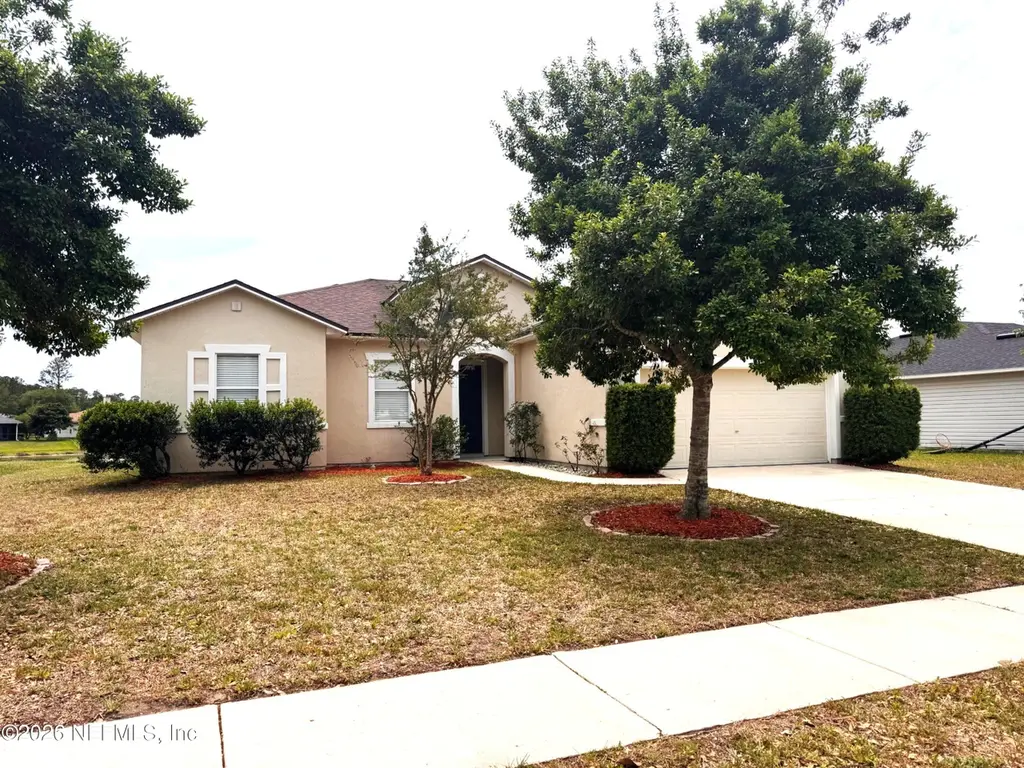
76236 Long Pond Loop · Yulee, FL
Flood risk 1/10 · Minimal
- FEMA flood zone
- X (unshaded)
- Chance of flooding over 30 yrs
- 0.0%
- Est. flood insurance / yr
- $507 – $1,088
Fire risk 7/10 · Major
- Est. fire insurance / yr
- $947 – $1,759
Heat risk 9/10 · Severe
- Hot days now (above 106°F)
- 7 days/yr
- Hot days in 30 yrs
- 20 days/yr
Wind risk 9/10 · Severe
- Chance of severe wind over 30 yrs
- 99.0%
Air-quality risk 5/10 · Moderate
- Unhealthy air days now
- 6 days/yr
- Unhealthy air days in 30 yrs
- 7 days/yr
Risk factors via First Street. Map © Google.
Why this score? — see what drove the D+ grade
The composite is a weighted blend of 9 inputs, each scored 0–100. Each bar is that input's sub-score; the figure is the points it added to the 100-point composite (weight × sub-score).
- Cash flow +10.4/30.0
- Appreciation +10.0/10.0
- ARV discount +8.4/15.0
- Schools +6.0/10.0
- Livability +3.3/5.0
- Rent growth +3.2/5.0
- DSCR +3.0/10.0
- 1% rule +2.9/10.0
- Condition / age +2.5/5.0
$314,999
🖨 Deal sheet 📄 Offer letter ✓ Due diligence
Listing remarks
FALL IN LOVE with the possibilities of this home's perfect location, offering 3 bedrooms and 2 full baths! The wide open family space overlooking the lake will be sure to make you smile. Split bedroom design, plenty of space to roam (indoors & outdoors), and the canvas to make it feel like home awaits! Quiet, established neighborhood, low HOA fees, and NO CDD fees! BONUS is it's just minutes from rated A schools, the very desirable Wildlight community, dining, shopping, military bases, the interstate, hospitals and even the airport! At this price, you do not want to walk. .. . RUN to take a peek today! * * * Sellers are offering a $10,000 credit to be used as the lucky buyer sees f
Key facts
- Low hoa fees
- Split bedroom design
- No cdd fees
Tags
Property features AI
Finance
- HOA & community: Homeowners association with $300 annual fee; Not a senior community
Exterior
- Parking: 2-car garage
- Utilities: Electricity connected; Sewer connected; Water connected
- Home design: Single family residence; Residential use
- Construction: Stucco construction
- Exterior features: Shingle roof; 0.2-acre lot
Interior
- Kitchen: Dishwasher; Electric range; Refrigerator
- Bedrooms: 3 bedrooms
- Flooring: Carpet; Tile; Vinyl
- Bathrooms: 2 full bathrooms
- Heating & cooling: Central heating; Central air conditioning
- Interior features: Entrance foyer; Pantry; Primary bathroom with tub and separate shower
- Laundry & utility: In-unit laundry
Neighborhood map
What this means for you Summary
Snapshot
- This is a 3-bed/2.0-bath single-family listed at $315k.
Deal economics
- At list price, monthly cash flow is $-165 ($-2k/yr) — negative.
- To cash-flow at today's rent, offer at most $286k (9.2% below list).
- To meet the 1% rule (rent ≥ 1% of price), the offer needs to be $250k (20.5% below list).
- Recommended offer: $250k (20.5% below list) — sets the bar for 1% rule.
- Cap rate 5.7% vs local median 3.4% in Yulee — top-decile yield for the area; either an underpriced asset or a hidden risk that comps aren't pricing in. Stress-test before assuming the spread holds.
Location & tenants
- Location reads 66/100 on livability (#605 in FL) — a middle-class / working-renter tenant base. Strengths: housing A+, cost of living A-, crime B+; Watch: amenities F, commute F, health & safety F.
- Nassau (town): math 74% / reading 65% proficiency, ranked #4 of 73 in FL (top 6%) — acceptable for families but not a draw, mixed tenant base, ~2y average lease.
- Market conditions: Rents rising (+2.9%/yr); 596 active listings in the ZIP; 5 comparable units currently listed for rent nearby; rentals at typical pace (median 24d on market — plan ~3-4 weeks tenant-placement turnaround); solid renter incomes; 953 units permitted in Nassau County in 2024 (24 in 5+ unit buildings).
- This rent runs 32% of the median local income ($93k/yr) — at the standard rent-burdened threshold; future hikes will face affordability resistance.
Forward outlook
- In year one you build about $34k of equity ($2k loan paydown + $32k appreciation (10.0% local appreciation)).
- Nassau County population projected at +17% by 2050 — long-run rental-demand tailwind backs the buy-and-hold thesis.
- By year 2, paydown + projected appreciation supports a ~$54k cash-out refi (75% LTV) — recoverable capital for the next deal without selling this one.
Negotiation context
- Only 13 days on market — expect competitive offers; lowballing is unlikely to land.
- 6 sale attempts since 19y ago with the ask held roughly flat each time — persistent listings suggest the price (not the market) is what's stuck; bring a comps-based counter.
- Current owner paid $157k; list at $315k implies a 101% gain — meaningful room to come down on a strong offer.
Risks & watch-outs
- Climate carrying-cost: severe wind risk, 99% chance of damaging wind over 30y; major wildfire risk; extreme-heat days projected 7→20/yr by 2055 (HVAC capex compounding) — expect insurance premiums to compound above CPI over the hold.
Questions for the listing agent
- What do current leases actually rent for vs. the listed asking? Can we see a recent rent roll and the last 12 months of T-12 income?
- What does the HOA fee cover, when was the last increase, and are there any pending special assessments or reserve-fund shortfalls?
- Is there a deadline driving the sale (1031 exchange, divorce, estate, relocation)? That informs how much negotiation room exists.
- Schools are B-rated — typically a magnet for longer-tenancy family renters. What's the average tenant stay here, and is there a school-zone premium baked into asking?
- The area grade is low — what's the realistic commute time and amenity access for the typical tenant pool here? Any planned neighborhood developments (good or bad) we should know about?
- What's the average days-on-market for RENTAL listings here right now (not sales)? A rising rental-DOM trend means longer vacancies and softer asking-rent achievability than the comps imply.
- What's the recent tenant-quality profile in this submarket — average credit score on applications, eviction rate, late-payment / NSF rate, and stable-employment percentage? A property-management company in the area should have these aggregated.
- How much new for-sale + rental construction is in the pipeline within 1–3 miles? Heavy new supply typically softens prices + rents 12–24 months out; constrained supply supports both.
Investment metrics
- 1% rule
- 0.79% ✗
- Cap rate
- 5.67%
- Cash-on-cash
- -2.24%
- DSCR
- 0.90
- GRM
- 10.5
CMA / ARV
- ARV (on-the-fly)
- $321,230
- Comps found
- 12
Show comp detail 12 sales within ~0.75 mi
| Address | Dist | Beds/Ba | Sqft | Sold | Price | $/sf | Match |
|---|---|---|---|---|---|---|---|
| 76264 Long Pond Loop | 0.03mi | 3/2.0 | 1,875 (+6%) | 5mo | $327,000 | $174 | 84 |
| 86811 Cartesian Pointe Dr | 0.07mi | 3/2.0 | 1,917 (+9%) | 7mo | $350,000 | $183 | 77 |
| 76073 Long Pond Loop | 0.13mi | 3/4.0 | 1,710 (-3%) | 6mo | $305,000 | $178 | 76 |
| 86648 Cartesian Pointe Dr | 0.18mi | 3/2.0 | 1,941 (+10%) | 1mo | $320,000 | $165 | 74 |
| 75168 Nassau Station Way | 0.20mi | 4/2.0 (+1) | 1,856 (+5%) | 7mo | $365,000 | $197 | 71 |
| 76087 Long Pond Loop | 0.12mi | 3/2.0 | 1,596 (-10%) | 11mo | $329,000 | $206 | 69 |
| 77854 Lumber Creek Blvd | 0.46mi | 4/2.0 (+1) | 1,843 (+4%) | 2mo | $315,000 | $171 | 65 |
| 77814 Lumber Creek Blvd | 0.55mi | 3/2.0 | 1,629 (-8%) | 1mo | $288,000 | $177 | 60 |
| 77812 Lumber Creek Blvd | 0.56mi | 4/2.0 (+1) | 1,854 (+5%) | 1mo | $337,500 | $182 | 59 |
| 77799 Lumber Creek Blvd | 0.60mi | 3/2.0 | 1,629 (-8%) | 1mo | $298,000 | $183 | 59 |
| 77795 Lumber Creek Blvd | 0.61mi | 4/2.0 (+1) | 1,854 (+5%) | 4mo | $325,000 | $175 | 55 |
| 77422 Lumber Creek Blvd | 0.73mi | 3/2.0 | 1,543 (-13%) | 2mo | $320,000 | $207 | 43 |
Match score weights: distance 35% · size 25% · config 20% · recency 20%. Top-matched comps best support the ARV.
Projected returns pro-forma
10.0% appreciation · 2.88% rent growth · sell at horizon
- IRR
- 22.6%
- Equity multiple
- 2.82×
- Total profit
- $160,780
- Equity at exit
- $283,776
- IRR
- 20.2%
- Equity multiple
- 6.46×
- Total profit
- $481,144
- Equity at exit
- $611,974
Cash invested: $88,200 (down + closing). Projections, not guarantees.
Landlord ↔ Tenant lean methodology
- Overall (STATE)
- 87 Strongly Landlord-Friendly
- State Florida
- 87 Strongly Landlord-Friendly · R+3
- County
- — inherits STATE
- City
- — inherits STATE
ZIP-level market 32097
- Home prices YoY
- 19.5%
- Rents YoY
- 2.9%
- Active inventory
- 596
- Price-to-rent
- 10.5×
Monthly cashflow live
- Estimated rent
- $2,503 high interval (Pro) →
- Mortgage (P&I)
- −$1,652
- Tax from tax record
- −$334 /mo · $4,007/yr
- Insurance
- −$131
- HOA
- −$25
- Vacancy / Maint / Mgmt
- −$526
- Net cashflow
- $-165
Break-even live
UW: 25.0% down · 7.5% · 30yr · 1.5% tax · 5.0% vac · 8.0% maint · 8.0% mgmt
Financing live
Cash to close
- Down payment
- $78,750
- Closing costs
- $9,450
- Reserves months
- —
- Total cash needed
- —
Loan-product check · same deal, 3 products live
Conventional
25% down · 7.5% · 30yr
- Down + closing
- —
- Monthly P&I
- —
- Monthly cashflow
- —
- DSCR
- —
- Eligible?
- —
Personal DTI + credit; lowest rate.
DSCR
20% down · 8.5% · 30yr
- Down + closing
- —
- Monthly P&I
- —
- Monthly cashflow
- —
- DSCR
- —
- Eligible?
- —
No personal income docs; deal must DSCR.
Hard money
10% down · 12.0% · 12mo
- Down + closing
- —
- Monthly P&I
- —
- Monthly cashflow
- —
- DSCR
- —
- Eligible?
- —
Short-term bridge; refi at stabilization.
Rent comps 5 comps
| Address | Beds | Baths | Sqft | Rent | $/sqft | DOM | Units | Dist |
|---|---|---|---|---|---|---|---|---|
| 76031 Long Pond Loop Yulee, FL | 3.0 | 2.5 | 2459 | $2,500 | $1.02 | 16d | 1 | 0.17mi |
| 77822 Lumber Creek Blvd Yulee, FL | 3.0 | 2.0 | 1543 | $2,200 | $1.43 | 23d | 1 | 0.52mi |
| 78295 Saddle Rock Rd Yulee, FL | 4.0 | 2.0 | 1846 | $2,191 | $1.19 | 23d | 1 | 0.55mi |
| 86215 Buggy Ct Yulee, FL | 3.0 | 2.0 | 1675 | $2,295 | $1.37 | 20d | 1 | 0.82mi |
| 86467 Moonlit Walk Cir Yulee, FL | 4.0 | 3.0 | 2010 | $3,100 | $1.54 | 23d | 1 | 1.46mi |
HOA detail
- Monthly dues
- $25 · $300/yr
Listing history 15 events
-
2026-05-19status Pending
-
2026-05-06$314,999 Active
-
2026-05-06$314,999 Active
-
2023-05-05historical
-
2023-03-18price $315,000
-
2023-02-07price $315,000
-
2023-01-16$325,000 Active
-
2023-01-16$325,000 Active
-
2008-08-19soldstatus $157,000
-
2008-08-15soldstatus $157,000
-
2008-03-10$157,000
-
2007-07-21historical
-
2007-02-09$249,900
-
2006-04-06soldstatus $218,900
-
2004-12-30soldstatus $2,314,100
ⓘ Source: listings_history table (triggers on properties + properties_extension) + one-shot
backfill from property_details.listing_events for pre-trigger history.
Tax reassessment forecast FL · Resets to sale price
- Current annual tax
- $4,007 · $334/mo
- Projected year-2 tax
- $4,007 · $334/mo
- Expected delta
- $0/yr ($0/mo · 0.0%)
ⓘ Screening estimate from a state-policy table — verify with the county assessor before closing.
Climate risk First Street
- Flood 1/10 Low FEMA zone X (unshaded) · 0% chance over 30 yrs
- Wildfire 7/10 Severe
- Heat 9/10 Extreme 7 d/yr ≥106°F today · 20 d/yr by 30 yrs out
- Wind 9/10 Extreme 99% chance of damaging wind over 30 yrs
- Air quality 5/10 Major 6 unhealthy d/yr today · 7 by 30 yrs out
Nearby sold comps map
Loading sold comps map…
Walkable amenities ~0.75 mi
Loading nearby amenities…
Taxation est. · year 1
- Rental income
- $30,035
- − Mortgage interest
- −$17,645
- − Property taxes
- −$4,007
- − Insurance
- −$1,575
- − Repairs & maintenance
- −$2,403
- − Management
- −$2,403
- − HOA
- −$300
- − Depreciation
- −$9,164
- Taxable loss
- −$7,461
- Est. tax savings @ 24.0%
- +$1,791
- After-tax cash flow
- $-186/yr
For passive investors: Depreciation is non-cash, so a rental often shows a tax loss while cash-flowing — sheltering income. Rental losses are passive: they offset passive income freely, and up to $25,000/yr can offset ordinary (W-2) income if you actively participate and your MAGI is under $100k (phasing out to $0 by $150k); unused losses carry forward. On sale, claimed depreciation is recaptured at up to 25%, and gains may owe capital-gains tax (a 1031 exchange can defer both). Figures are a year-1 estimate at your 24.0% rate — not tax advice; consult a CPA.
Schools (NCES district)
- District
- Nassau
- NCES district ID
- 1201350
- Math proficiency
- 74% ▼ -2.00%
- Reading proficiency
- 65% ▼ -2.00%
- Median HH income
- $58,267
- Composite
- 59.79/100
- National rank
- #899
- State rank
- #4 of 73 in FL
Livability — Yulee
- Score
- 66/100
- State rank
- #605
- US rank
- #11615
Category grades
Schools grade is shown separately in the Schools card above.
Census & demographics
- County
- Nassau County · 67,729 people
- City population
- 26,700
- Metro
- Jacksonville, FL
- Population (ZIP)
- 26,700
- Household income
- $93,161
- Rent vs Own
- Severe rent burden
- 404.0
Population outlook (Nassau County) Hauer SSP2
- Today (2025)
- 88,419 people
- By 2030
- 92,679 · +4.8%
- By 2040
- 99,257 · +12.3%
- By 2050
- 103,378 · +16.9%
- By 2075
- 109,726 · +24.1%
- By 2100
- 107,006 · +21.0%
Race, ethnicity, and origin ACS 2023
- Neighborhood character
- Predominantly White (75%)
- Race & ethnicity
- White 75% Two or more races 9% Black 9% Hispanic / Latino 8% Asian 1% Native American 1%
- Hispanic origin (detail)
- Mexican 2% Puerto Rican 2%
- Common ancestry
- Lithuanian 4% Italian 3% Romanian 2%
- Foreign-born
- 4% · Canada, Vietnam
- Languages at home
- 93% English-only · Spanish 5% Vietnamese 1%
Political lean MEDSL · Nassau
- 2024 margin
- Solid R (+46.9) · D 26.1% · R 73.1%
- 2008→2024 swing
- -3.1pp toward R · 2008: -43.8pp · 2024: -46.9pp
- All cycles
- 2024: R+46.9 2020: R+45.9 2016: R+50.2 2012: R+48.6 2008: R+43.8
Not yet ingested
- Civics
- —
Market trends
- HPI YoY
- ▲ 49.35%
- Current HPI
- 301.9299
- Rent YoY
- ▲ 2.88%
- Metro
- Jacksonville, FL
- State GDP YoY
- ▲ 3.28%
- F500 in state
- 36
Industry mix (Fortune 500 HQ in FL)
| Industry | F500 HQs | Revenue |
|---|---|---|
| Industrial Technology | 2 | $29B |
|
||
| Insurance | 2 | $17B |
|
||
| Retail | 1 | $60B |
|
||
| Technology Distribution | 1 | $58B |
|
||
| Homebuilding | 1 | $35B |
|
||
| Technology Manufacturing | 1 | $35B |
|
||
Price history
-86.4% since first listed15 events — show timeline
- 2026-05-19 Pending — realMLS
- 2026-05-06 Listed $314,999 realMLS
- 2026-05-06 Listed $314,999 AINCAR
- 2023-05-05 Listing Removed — realMLS
- 2023-03-18 Price Changed $315,000 realMLS
- 2023-02-07 Price Changed $315,000 AINCAR
- 2023-01-16 Listed $325,000 realMLS
- 2023-01-16 Listed $325,000 AINCAR
- 2008-08-19 Sold (Public Records) $157,000 Public Records
- 2008-08-15 Sold (MLS) $157,000 AINCAR
- 2008-03-10 Listed $157,000 AINCAR
- 2007-07-21 Listing Removed — realMLS
- 2007-02-09 Listed $249,900 realMLS
- 2006-04-06 Sold (Public Records) $218,900 Public Records
- 2004-12-30 Sold (Public Records) $2,314,100 Public Records
Property tax history
+7.0%/yrLatest (2025): $4,007 · +4.0% YoY. Source: county tax records.
Cash-flow waterfall
monthlySold comps — $/sqft
last 12 mo · ≤1 miLoading sold comps…