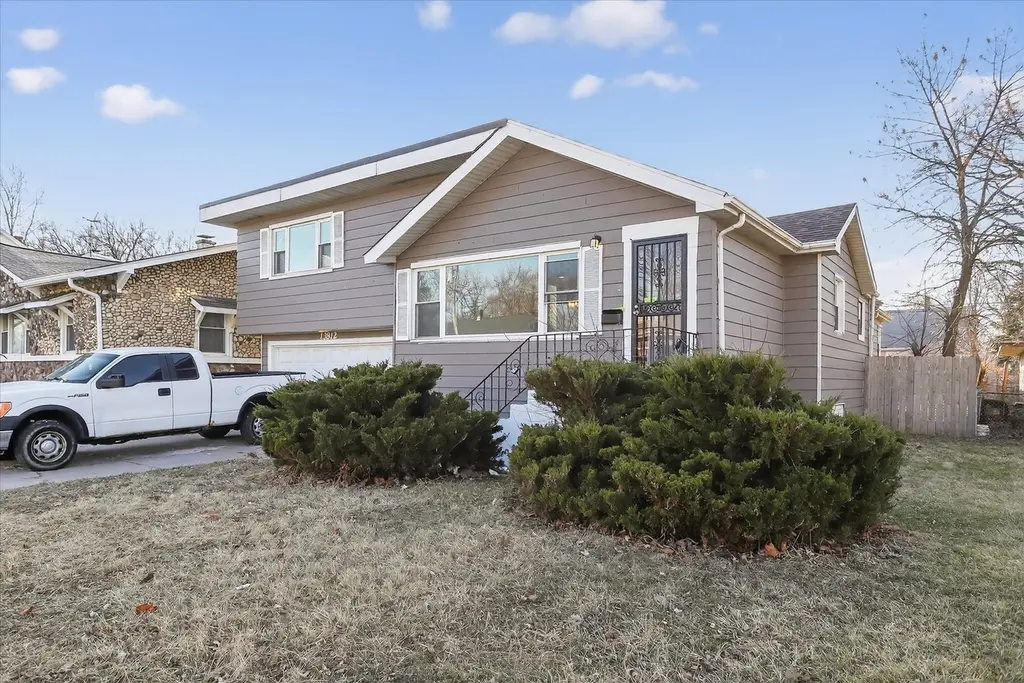
13812 Kanawha Ave · Dolton, IL
Flood risk 3/10 · Minor
- FEMA flood zone
- X (unshaded)
- Chance of flooding over 30 yrs
- 0.2%
- Est. flood insurance / yr
- $473 – $860
Fire risk 1/10 · Minimal
- Est. fire insurance / yr
- $804 – $1,492
Heat risk 3/10 · Minor
- Hot days now (above 101°F)
- 7 days/yr
- Hot days in 30 yrs
- 15 days/yr
Wind risk 2/10 · Minimal
- Chance of severe wind over 30 yrs
- —
Air-quality risk 4/10 · Minor
- Unhealthy air days now
- 4 days/yr
- Unhealthy air days in 30 yrs
- 5 days/yr
Risk factors via First Street. Map © Google.
Why this score? — see what drove the D- grade
The composite is a weighted blend of 9 inputs, each scored 0–100. Each bar is that input's sub-score; the figure is the points it added to the 100-point composite (weight × sub-score).
- Cash flow +15.3/30.0
- Rent growth +4.9/5.0
- 1% rule +4.7/10.0
- DSCR +4.7/10.0
- Livability +3.7/5.0
- Condition / age +2.5/5.0
- Schools +0.7/10.0
- ARV discount +0.0/15.0
- Appreciation +0.0/10.0
$269,000
🖨 Deal sheet (PDF) 📄 Offer letter ✓ Due diligence
Listing remarks
Move right in to this fully updated 2-story home featuring 5 bedrooms, 3 modern baths, and hardwood floors throughout. Enjoy a stunning kitchen with white 42-inch soft-close cabinets, granite counters, and stainless steel appliances. The oversized deck overlooks a spacious backyard-perfect for entertaining. Additional highlights include a full basement and 2-car garage. A stylish blend of comfort and convenience awaits
Key facts
- Spacious backyard
- Oversized deck
- Full basement
Tags
Property features AI
Finance
- Other: Living area reported as estimated
- HOA & community: No master association fee required
Exterior
- Parking: Attached garage (2 garage spaces, 2 total parking spaces)
- Utilities: Public water; Public sewer
- Home design: Detached single-family home; 2-story; Fee simple ownership; Rehab completed in 2022; Property age 100+ years; Built before 1978
- Construction: Vinyl siding construction
- Exterior features: Lot dimensions approximately 25 x 125; Lot smaller than 0.25 acre; Vinyl siding
Interior
- Kitchen: Kitchen on main level (approx. 12 x 14)
- Bedrooms: 5 bedrooms (Master on second floor; additional bedrooms on main and second floors); Bedroom sizes include: 16 x 18 (Master), 16 x 16, 12 x 14, 12 x 12, 12 x 10
- Bathrooms: 3 full bathrooms (including at least one basement bathroom)
- Heating & cooling: Natural gas heating; Central air conditioning
- Interior features: Finished full basement; 9 total rooms
- Laundry & utility: Laundry room in basement (approx. 8 x 6)
Neighborhood map
What this means for you Summary
Snapshot
- This is a 4-bed/2.5-bath single-family listed at $269k.
Deal economics
- At list price, monthly cash flow is $99 ($1k/yr) — positive.
- The deal already cash-flows at list — no discount required.
- To meet the 1% rule (rent ≥ 1% of price), the offer needs to be $261k (3.1% below list).
- Recommended offer: $261k (3.1% below list) — sets the bar for 1% rule.
- Cap rate 6.7% vs local median 9.3% in Dolton — below-typical yield; the buyer is paying a premium for something (appreciation thesis, condition, location) that the cap rate doesn't capture.
Location & tenants
- Location reads 74/100 on livability (#263 in IL, #4,883 nationally) — a middle-class / working-renter tenant base. Strengths: commute A+, cost of living A+, housing A+; Watch: employment C-, health & safety C-, crime D-.
- Thornton Twp Hsd 205 (suburban): math 7% / reading 8% proficiency, ranked #594 of 620 in IL (top 96%) — low school quality limits family demand, transient renter base, plan for 1-2y turnover.
- Zoned schools: Lincoln Elementary School (math 24% / reading 24%, grade F, #850 of 2,056 statewide, top 45%, 342 students, 0% FRL); Lincoln Junior High School (150 students, 0% FRL); Thornridge High School (math 8% / reading 8%, grade F, #589 of 693 statewide, top 86%, 1,057 students, 0% FRL).
- Market conditions: Rents rising fast (+9.7%/yr); 129 active listings in the ZIP; 8 comparable units currently listed for rent nearby; rentals at typical pace (median 27d on market — plan ~3-4 weeks tenant-placement turnaround); 6,272 units permitted in Cook County in 2024 (4,658 in 5+ unit buildings).
- At $2,608/mo this rent would consume 54% of the median local household income ($58k/yr) (locally 919% of renters already pay >50% of income on rent) — very limited rent-growth headroom before tenants either downsize or default.
Forward outlook
- Local home prices are declining (-3.0%/yr); year-one equity from $2k of loan paydown is wiped out by about $8k of value loss. Plan a longer hold.
Negotiation context
- It's been on market 50 days — a 3% lower offer ($261k) is reasonable based on typical stale-listing flexibility.
- 7 sale attempts since 18y ago with the ask held roughly flat each time — persistent listings suggest the price (not the market) is what's stuck; bring a comps-based counter.
- Current owner paid $75k; list at $269k implies a 259% gain — meaningful room to come down on a strong offer.
Risks & watch-outs
- Watch-outs: built in 1920 — expect roof / HVAC / electrical / plumbing capex.
Questions for the listing agent
- It's been on market 50 days. Have you received any prior offers? Is the seller open to a 3% concession, seller financing, or rate buy-down credit?
- Built in 1920 — when were the roof, HVAC, electrical panel, plumbing, and water heater last replaced?
- Is there a deadline driving the sale (1031 exchange, divorce, estate, relocation)? That informs how much negotiation room exists.
- Schools are F-rated, which usually means shorter tenancies and higher turnover. Who's the typical renter profile here, and what's been the actual vacancy rate?
- Crime grade is D in this area — have there been break-ins, vandalism, or insurance claims at this property in the last 3 years? What carrier currently insures it and at what premium?
- The area grade is low — what's the realistic commute time and amenity access for the typical tenant pool here? Any planned neighborhood developments (good or bad) we should know about?
- What's the average days-on-market for RENTAL listings here right now (not sales)? A rising rental-DOM trend means longer vacancies and softer asking-rent achievability than the comps imply.
- What's the recent tenant-quality profile in this submarket — average credit score on applications, eviction rate, late-payment / NSF rate, and stable-employment percentage? A property-management company in the area should have these aggregated.
- How much new for-sale + rental construction is in the pipeline within 1–3 miles? Heavy new supply typically softens prices + rents 12–24 months out; constrained supply supports both.
Investment metrics
- 1% rule
- 0.97% ✗
- Cap rate
- 6.73%
- Cash-on-cash
- 1.57%
- DSCR
- 1.07
- GRM
- 8.6
CMA / ARV
- ARV (on-the-fly)
- $198,202
- Comps found
- 12
Show comp detail 12 sales within ~0.75 mi
| Address | Dist | Beds/Ba | Sqft | Sold | Price | $/sf | Match |
|---|---|---|---|---|---|---|---|
| 13809 Forest Ave | 0.11mi | 5/2.0 (+1) | 1,907 (+9%) | 8mo | $175,000 | $92 | 66 |
| 13331 S Calumet Ave | 0.65mi | 3/2.0 (-1) | 1,705 (-3%) | 2mo | $200,000 | $117 | 56 |
| 14048 Park Ave | 0.34mi | 3/1.0 (-1) | 1,591 (-9%) | 2mo | $36,000 | $23 | 56 |
| 21 E 140th Ct | 0.66mi | 5/2.0 (+1) | 1,830 (+4%) | 1mo | $206,000 | $113 | 54 |
| 423 E 144th St | 0.75mi | 4/3.0 | 1,896 (+8%) | 3mo | $85,000 | $45 | 47 |
| 13903 S Dearborn St | 0.73mi | 4/2.0 | 1,700 (-3%) | 14mo | $215,000 | $126 | 47 |
| 14326 Irving Ave | 0.74mi | 4/2.0 | 1,597 (-9%) | 3mo | $195,000 | $122 | 46 |
| 504 144th St | 0.71mi | 4/1.5 | 1,619 (-8%) | 7mo | $67,000 | $41 | 44 |
| 13228 S Rhodes Ave | 0.73mi | 3/2.0 (-1) | 1,600 (-9%) | 3mo | $175,000 | $109 | 42 |
| 13235 S Vernon Ave | 0.69mi | 3/1.5 (-1) | 1,642 (-6%) | 10mo | $175,000 | $107 | 40 |
| 14115 S Wabash Ave | 0.73mi | 3/2.0 (-1) | 1,600 (-9%) | 8mo | $237,000 | $148 | 38 |
| 759 Mcarthur Ct | 0.72mi | 3/2.0 (-1) | 1,500 (-14%) | 5mo | $269,000 | $179 | 31 |
Match score weights: distance 35% · size 25% · config 20% · recency 20%. Top-matched comps best support the ARV.
Projected returns pro-forma
-3.0% appreciation · 8.0% rent growth · sell at horizon
- IRR
- -8.0%
- Equity multiple
- 0.69×
- Total profit
- $-23,412
- Equity at exit
- $40,109
- IRR
- 7.3%
- Equity multiple
- 1.68×
- Total profit
- $50,855
- Equity at exit
- $23,258
Cash invested: $75,320 (down + closing). Projections, not guarantees.
Landlord ↔ Tenant lean methodology
- Overall (STATE)
- 43 Moderately Tenant-Leaning
- State Illinois
- 43 Moderately Tenant-Leaning · D+7
- County
- — inherits STATE
- City
- — inherits STATE
ZIP-level market 60419
- Home prices YoY
- -25.7%
- Rents YoY
- 9.7%
- Active inventory
- 129
- Price-to-rent
- 8.6×
Monthly cashflow live
- Estimated rent
- $2,608 high interval (Pro) →
- Mortgage (P&I)
- −$1,411
- Tax from tax record
- −$438 /mo · $5,261/yr
- Insurance
- −$112
- HOA
- −$0
- Vacancy / Maint / Mgmt
- −$548
- Net cashflow
- $99
Break-even live
Sensitivity live
| Price | -10% $251 | -5% $175 | +0% $99 | +5% $23 | +10% $-53 |
|---|---|---|---|---|---|
| Rent | -10% $-107 | -5% $-4 | +0% $99 | +5% $202 | +10% $305 |
| Rate | -1.0pp $234 | -0.5pp $167 | base $99 | +0.5pp $29 | +1.0pp $-42 |
UW: 25.0% down · 7.5% · 30yr · 1.5% tax · 5.0% vac · 8.0% maint · 8.0% mgmt
Financing live
Cash to close
- Down payment
- $67,250
- Closing costs
- $8,070
- Reserves months
- —
- Total cash needed
- —
Loan-product check · same deal, 3 products live
Conventional
25% down · 7.5% · 30yr
- Down + closing
- —
- Monthly P&I
- —
- Monthly cashflow
- —
- DSCR
- —
- Eligible?
- —
Personal DTI + credit; lowest rate.
DSCR
20% down · 8.5% · 30yr
- Down + closing
- —
- Monthly P&I
- —
- Monthly cashflow
- —
- DSCR
- —
- Eligible?
- —
No personal income docs; deal must DSCR.
Hard money
10% down · 12.0% · 12mo
- Down + closing
- —
- Monthly P&I
- —
- Monthly cashflow
- —
- DSCR
- —
- Eligible?
- —
Short-term bridge; refi at stabilization.
Rent comps 8 comps
| Address | Beds | Baths | Sqft | Rent | $/sqft | DOM | Units | Dist |
|---|---|---|---|---|---|---|---|---|
| 14124 Manor Ave Dolton, IL | 3.0 | 2.0 | 1440 | $2,390 | $1.66 | 26d | 1 | 0.50mi |
| 19 E 140th Ct Riverdale, IL | 3.0 | 2.0 | 2076 | $2,231 | $1.07 | 9d | 1 | 0.66mi |
| 13903 S State St Riverdale, IL | 4.0 | 1.5 | 2300 | $2,650 | $1.15 | 26d | 1 | 0.67mi |
| 13708 S Wentworth Ave Riverdale, IL | 3.0 | 1.5 | 1500 | $2,200 | $1.47 | 24d | 1 | 0.95mi |
| 14505 Minerva Ave Dolton, IL | 4.0 | 2.0 | 2100 | $2,500 | $1.19 | 26d | 1 | 1.30mi |
| 14433 Woodlawn Ave Dolton, IL | 4.0 | 2.0 | 1300 | $2,000 | $1.54 | 20d | 1 | 1.36mi |
| 14916 Langley Ave Dolton, IL | 3.0 | 1.5 | 1418 | $2,500 | $1.76 | 26d | 1 | 1.47mi |
| 14844 Wabash Ave Dolton, IL | 3.0 | 1.5 | 1277 | $2,320 | $1.82 | 26d | 1 | 1.48mi |
Listing history 39 events
-
2026-06-21days on market $269,000 Active 50 DOM
-
2026-06-18days on market $269,000 Active 47 DOM
-
2026-06-17days on market $269,000 Active 46 DOM
-
2026-06-16days on market $269,000 Active 45 DOM
-
2026-06-15days on market $269,000 Active 44 DOM
-
2026-06-13days on market $269,000 Active 42 DOM
-
2026-06-13days on market $269,000 Active 41 DOM
-
2026-06-09days on market $269,000 Active 38 DOM
-
2026-06-08days on market $269,000 Active 37 DOM
-
2026-06-07days on market $269,000 Active 36 DOM
-
2026-06-04days on market $269,000 Active 33 DOM
-
2026-06-03days on market $269,000 Active 32 DOM
-
2026-06-02days on market $269,000 Active 31 DOM
-
2026-06-01days on market $269,000 Active 30 DOM
-
2026-05-31days on market $269,000 Active 29 DOM
-
2026-05-02$269,000 Active
-
2025-02-26historical
-
2024-12-23Active
-
2023-09-13historical
-
2023-09-05Active
-
2022-02-10soldstatus $75,000 Closed
-
2021-12-14soldstatus $73,000
-
2021-10-21status Pending
-
2021-10-21status Active Under Contract
-
2021-09-20$75,000 Active
-
2010-03-18soldstatus $27,750 Closed Sale
-
2009-12-30historical Contingent
-
2009-12-17$27,750 New
-
2009-01-02historical
-
2008-12-12price
-
2008-12-12status
-
2008-12-12historical
-
2008-11-24price
-
2008-11-12price
-
2008-11-04price
-
2008-10-14price
-
2008-10-03
-
2004-11-10soldstatus $128,000
-
1990-11-01soldstatus $71,000
ⓘ Source: listings_history table (triggers on properties + properties_extension) + one-shot
backfill from property_details.listing_events for pre-trigger history.
Tax reassessment forecast IL · Partial reset (capped growth)
- Current annual tax
- $5,261 · $438/mo
- Projected year-2 tax
- $5,684 · $474/mo
- Expected delta
- +$422/yr (+$35/mo · 8.0%)
ⓘ Screening estimate from a state-policy table — verify with the county assessor before closing.
Climate risk First Street
- Flood 3/10 Moderate FEMA zone X (unshaded) · 20% chance over 30 yrs
- Wildfire 1/10 Low
- Heat 3/10 Moderate 7 d/yr ≥101°F today · 15 d/yr by 30 yrs out
- Wind 2/10 Low
- Air quality 4/10 Moderate 4 unhealthy d/yr today · 5 by 30 yrs out
Nearby sold comps map
Loading sold comps map…
Walkable amenities ~0.75 mi
Loading nearby amenities…
Taxation est. · year 1
- Rental income
- $31,292
- − Mortgage interest
- −$15,068
- − Property taxes
- −$5,261
- − Insurance
- −$1,345
- − Repairs & maintenance
- −$2,503
- − Management
- −$2,503
- − Depreciation
- −$7,825
- Taxable loss
- −$3,215
- Est. tax savings @ 24.0%
- +$772
- After-tax cash flow
- $1,958/yr
For passive investors: Depreciation is non-cash, so a rental often shows a tax loss while cash-flowing — sheltering income. Rental losses are passive: they offset passive income freely, and up to $25,000/yr can offset ordinary (W-2) income if you actively participate and your MAGI is under $100k (phasing out to $0 by $150k); unused losses carry forward. On sale, claimed depreciation is recaptured at up to 25%, and gains may owe capital-gains tax (a 1031 exchange can defer both). Figures are a year-1 estimate at your 24.0% rate — not tax advice; consult a CPA.
Schools (NCES district)
- District
- Thornton Twp Hsd 205
- NCES district ID
- 1738970
- Math proficiency
- 7% ▬ 0.00%
- Reading proficiency
- 8% ▼ -2.00%
- Median HH income
- $43,392
- Composite
- 6.92/100
- National rank
- #9976
- State rank
- #594 of 620 in IL
Livability — Dolton
- Score
- 74/100
- State rank
- #263
- US rank
- #4883
Category grades
Schools grade is shown separately in the Schools card above.
Census & demographics
- Census place
- Dolton, IL
- County
- Cook County · 4,486,803 people
- City population
- 20,825
- Metro
- Chicago-Naperville-Elgin, IL-IN-WI
- Population (ZIP)
- 20,825
- Household income
- $57,887
- Rent vs Own
- Severe rent burden
- 919.0
Population outlook (Cook County) Hauer SSP2
- Today (2025)
- 5,347,519 people
- By 2030
- 5,357,703 · +0.2%
- By 2040
- 5,324,924 · -0.4%
- By 2050
- 5,230,762 · -2.2%
- By 2075
- 4,785,735 · -10.5%
- By 2100
- 4,188,836 · -21.7%
Race, ethnicity, and origin ACS 2023
- Neighborhood character
- Predominantly Black (91%)
- Race & ethnicity
- Black 91% White 4% Two or more races 3% Hispanic / Latino 1%
- Common ancestry
- Romanian 1% Hispanic 1%
- Foreign-born
- 3% · Canada
- Languages at home
- 95% English-only · French/Haitian/Cajun 2% Spanish 1%
Political lean MEDSL · Cook
- 2024 margin
- Solid D (+42.0) · D 70.4% · R 28.4% · Other 1.2%
- 2008→2024 swing
- -11.4pp toward R · 2008: 53.4pp · 2024: 42.0pp
- All cycles
- 2024: D+42.0 2020: D+50.3 2016: D+53.0 2012: D+49.4 2008: D+53.4
Not yet ingested
- Civics
- —
Market trends
- HPI YoY
- ▼ -66.88%
- Current HPI
- 193.2346
- Rent YoY
- ▲ 9.65%
- Metro
- Chicago-Naperville-Elgin, IL-IN-WI
- State GDP YoY
- ▲ 1.59%
- F500 in state
- 60
Industry mix (Fortune 500 HQ in IL)
| Industry | F500 HQs | Revenue |
|---|---|---|
| Insurance | 4 | $201B |
|
||
| Consumer Goods | 4 | $87B |
|
||
| Industrial Machinery | 3 | $64B |
|
||
| Healthcare | 2 | $55B |
|
||
| Retail / Pharmacy | 1 | $148B |
|
||
| Agriculture / Food | 1 | $86B |
|
||
Price history
+278.9% since first listed24 events — show timeline
- 2026-05-02 Listed $269,000 MRED as Distributed by MLS Grid
- 2025-02-26 Listing Removed — MRED as Distributed by MLS Grid
- 2024-12-23 Listed — MRED as Distributed by MLS Grid
- 2023-09-13 Listing Removed — MRED as Distributed by MLS Grid
- 2023-09-05 Listed — MRED as Distributed by MLS Grid
- 2022-02-10 Sold (MLS) $75,000 MRED as Distributed by MLS Grid
- 2021-12-14 Sold (Public Records) $73,000 Public Records
- 2021-10-21 Pending — MRED as Distributed by MLS Grid
- 2021-10-21 Pending — MRED as Distributed by MLS Grid
- 2021-09-20 Listed $75,000 MRED as Distributed by MLS Grid
- 2010-03-18 Sold (MLS) $27,750 MRED as Distributed by MLS Grid
- 2009-12-30 Contingent — MRED as Distributed by MLS Grid
- 2009-12-17 Listed $27,750 MRED as Distributed by MLS Grid
- 2009-01-02 Listing Removed — MRED as Distributed by MLS Grid
- 2008-12-12 Relisted — MRED as Distributed by MLS Grid
- 2008-12-12 Price Changed — MRED as Distributed by MLS Grid
- 2008-12-12 Listing Removed — MRED as Distributed by MLS Grid
- 2008-11-24 Price Changed — MRED as Distributed by MLS Grid
- 2008-11-12 Price Changed — MRED as Distributed by MLS Grid
- 2008-11-04 Price Changed — MRED as Distributed by MLS Grid
- 2008-10-14 Price Changed — MRED as Distributed by MLS Grid
- 2008-10-03 Listed — MRED as Distributed by MLS Grid
- 2004-11-10 Sold (Public Records) $128,000 Public Records
- 1990-11-01 Sold (Public Records) $71,000 Public Records
Property tax history
+3.3%/yrLatest (2023): $5,261 · +7.5% YoY. Source: county tax records.
Cash-flow waterfall
monthlySold comps — $/sqft
last 12 mo · ≤1 miLoading sold comps…