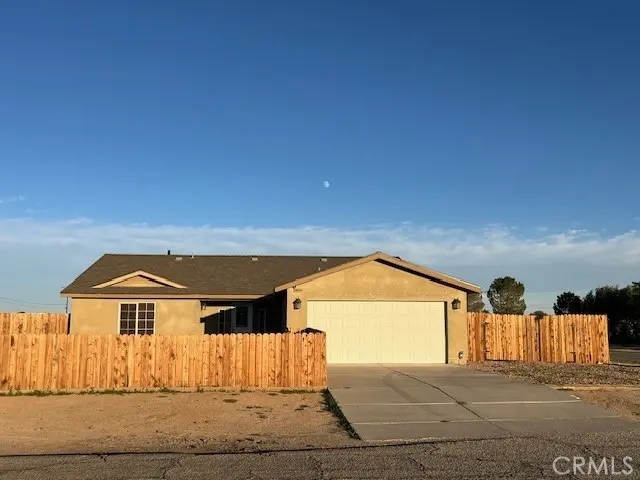
20236 Graham St · California City, CA
Flood risk 1/10 · Minimal
- FEMA flood zone
- X (unshaded)
- Chance of flooding over 30 yrs
- 0.0%
- Est. flood insurance / yr
- $507 – $1,088
Fire risk 1/10 · Minimal
- Est. fire insurance / yr
- $659 – $1,223
Heat risk 8/10 · Major
- Hot days now (above 101°F)
- 7 days/yr
- Hot days in 30 yrs
- 18 days/yr
Wind risk 1/10 · Minimal
- Chance of severe wind over 30 yrs
- —
Air-quality risk 7/10 · Major
- Unhealthy air days now
- 13 days/yr
- Unhealthy air days in 30 yrs
- 17 days/yr
Risk factors via First Street. Map © Google.
Why this score? — see what drove the D- grade
The composite is a weighted blend of 9 inputs, each scored 0–100. Each bar is that input's sub-score; the figure is the points it added to the 100-point composite (weight × sub-score).
- Appreciation +10.0/10.0
- ARV discount +7.8/15.0
- Cash flow +7.5/30.0
- Rent growth +3.9/5.0
- Condition / age +2.5/5.0
- Livability +2.2/5.0
- Schools +2.1/10.0
- 1% rule +1.8/10.0
- DSCR +1.6/10.0
$330,000
🖨 Deal sheet (PDF) 📄 Offer letter ✓ Due diligence
Listing remarks MLS
This classic three bedroom, two bathroom house is nestled perfectly on the corner of a quaint neighborhood. This beautiful home has an island in the kitchen that doubles as a bar for seating. The kitchen offers a nice layout with stainless steel appliances, an industrial style sink and faucet, recessed lighting, and a walk in pantry. The living room has light-wash tile and a spacious atmosphere. The laundry room acts as a mudroom with access to the garage. The master bedroom has a walk in closet, beautiful windows, and a ceiling fan. Come check it out today!
Key facts
- Bright kitchen
- Open floor plan
- Large living area
Tags
Property features AI
Finance
- Other: R1 zoning
- Financial info: Single-unit property (1 total unit)
- HOA & community: Urban community
Exterior
- Parking: Attached garage with direct garage access and front entry; RV access/parking; 2 garage/parking spaces
- Security: Smoke detector
- Utilities: Electricity on property; Propane available; Public/district water; Septic (septic type unknown)
- Home design: Single-story (one level); Main entry on main level; No common walls
- Construction: Stucco exterior; Shingle roof; Concrete perimeter foundation; Built information from assessor
- Exterior features: House; Wood fencing; Patio (property has a patio); Corner lot with front and back yard; Level with street
Interior
- Kitchen: Kitchen island; Granite counters; Gas cooktop and gas range with gas oven; Microwave; Refrigerator; Dishwasher; Recirculated exhaust fan; Water heater unit / gas water heater
- Bedrooms: 3 bedrooms on the main level
- Flooring: Tile flooring; Carpet flooring
- Bathrooms: 2 full bathrooms with bathtub and shower-in-tub; Exhaust fans
- Heating & cooling: Central cooling; Propane heating; Central furnace
- Interior features: Ceiling fan; Pantry; Granite counters; Formal entry; Formal dining room; Living room; Family room
- Laundry & utility: Laundry room inside; Washer hookup; Gas dryer hookup; Individual laundry room
Neighborhood map
What this means for you Summary
Snapshot
- This is a 3-bed/2.0-bath single-family listed at $330k.
Deal economics
- At list price, monthly cash flow is $-415 ($-5k/yr) — negative.
- To cash-flow at today's rent, offer at most $257k (22.2% below list).
- To meet the 1% rule (rent ≥ 1% of price), the offer needs to be $224k (32.0% below list).
- Recommended offer: $224k (32.0% below list) — sets the bar for 1% rule.
Location & tenants
- Location reads 44/100 on livability (#1,329 in CA) — a working-class tenant base; expect higher turnover. Strengths: housing A+; Watch: crime F, amenities F, commute F.
- Mojave Unified (town): math 25% / reading 25% proficiency, ranked #411 of 517 in CA (top 80%) — low school quality limits family demand, transient renter base, plan for 1-2y turnover; 76% free/reduced lunch — lower-income household profile, screen leases tightly.
- Zoned schools: Hacienda Elementary (528 students, 92% FRL); California City Middle (501 students, 87% FRL); California City High (655 students, 85% FRL).
- Market conditions: Rents rising fast (+5.5%/yr); 704 active listings in the ZIP; 14 comparable units currently listed for rent nearby; rentals at typical pace (median 25d on market — plan ~3-4 weeks tenant-placement turnaround); 3,244 units permitted in Kern County in 2024 (73 in 5+ unit buildings).
- At $2,245/mo this rent would consume 45% of the median local household income ($60k/yr) (locally 883% of renters already pay >50% of income on rent) — very limited rent-growth headroom before tenants either downsize or default.
Forward outlook
- In year one you build about $35k of equity ($2k loan paydown + $33k appreciation (10.0% local appreciation)).
- Kern County population projected at +17% by 2050 — long-run rental-demand tailwind backs the buy-and-hold thesis.
- By year 2, paydown + projected appreciation supports a ~$57k cash-out refi (75% LTV) — recoverable capital for the next deal without selling this one.
Negotiation context
- It's been on market 41 days — a 3% lower offer ($320k) is reasonable based on typical stale-listing flexibility.
- 10 sale attempts since 18y ago with the ask held roughly flat each time — persistent listings suggest the price (not the market) is what's stuck; bring a comps-based counter.
- Current owner paid $266k; 24% above their basis — modest negotiation headroom, anchor on the comps not their cost.
Risks & watch-outs
- Climate carrying-cost: extreme-heat days projected 7→18/yr by 2055 (HVAC capex compounding) — expect insurance premiums to compound above CPI over the hold.
Questions for the listing agent
- What do current leases actually rent for vs. the listed asking? Can we see a recent rent roll and the last 12 months of T-12 income?
- It's been on market 41 days. Have you received any prior offers? Is the seller open to a 32% concession, seller financing, or rate buy-down credit?
- Is there a deadline driving the sale (1031 exchange, divorce, estate, relocation)? That informs how much negotiation room exists.
- Schools are F-rated, which usually means shorter tenancies and higher turnover. Who's the typical renter profile here, and what's been the actual vacancy rate?
- Crime grade is F in this area — have there been break-ins, vandalism, or insurance claims at this property in the last 3 years? What carrier currently insures it and at what premium?
- The area grade is low — what's the realistic commute time and amenity access for the typical tenant pool here? Any planned neighborhood developments (good or bad) we should know about?
- What's the average days-on-market for RENTAL listings here right now (not sales)? A rising rental-DOM trend means longer vacancies and softer asking-rent achievability than the comps imply.
- What's the recent tenant-quality profile in this submarket — average credit score on applications, eviction rate, late-payment / NSF rate, and stable-employment percentage? A property-management company in the area should have these aggregated.
- How much new for-sale + rental construction is in the pipeline within 1–3 miles? Heavy new supply typically softens prices + rents 12–24 months out; constrained supply supports both.
Investment metrics
- 1% rule
- 0.68% ✗
- Cap rate
- 4.78%
- Cash-on-cash
- -5.39%
- DSCR
- 0.76
- GRM
- 12.2
CMA / ARV
- ARV (median comp)
- $332,394
- List price
- $330,000
- Delta
- -0.72%
- Verdict
- FAIR
- Comps
- 20 within 1.0 mi
Show comp detail 11 sales within ~0.75 mi
| Address | Dist | Beds/Ba | Sqft | Sold | Price | $/sf | Match |
|---|---|---|---|---|---|---|---|
| 8313 Redwood Blvd | 0.29mi | 3/2.0 | 2,202 (-0%) | 5mo | $349,900 | $159 | 82 |
| 20324 81st St | 0.09mi | 4/2.0 (+1) | 2,073 (-6%) | 1mo | $374,500 | $181 | 80 |
| 8425 Jacaranda Ave | 0.33mi | 4/2.0 (+1) | 2,119 (-4%) | 23mo | $340,000 | $160 | 54 |
| 8545 Satinwood Ave | 0.54mi | 3/3.5 | 2,053 (-7%) | 10mo | $300,000 | $146 | 49 |
| 8412 Catalpa Ave | 0.62mi | 3/3.0 | 1,973 (-10%) | 2mo | $290,000 | $147 | 48 |
| 8412 Redwood Blvd | 0.39mi | 4/2.0 (+1) | 2,001 (-9%) | 19mo | $330,000 | $165 | 46 |
| 20373 87TH St | 0.57mi | 4/2.0 (+1) | 2,002 (-9%) | 14mo | $405,000 | $202 | 42 |
| 20124 84th St | 0.32mi | 4/2.5 (+1) | 1,900 (-14%) | 18mo | $320,000 | $168 | 41 |
| 8693 IRONWOOD Ave | 0.64mi | 4/2.0 (+1) | 2,002 (-9%) | 14mo | $386,000 | $193 | 39 |
| 20249 AIRWAY Blvd | 0.57mi | 3/2.0 | 1,951 (-12%) | 21mo | $290,000 | $149 | 37 |
| 20340 88th St | 0.69mi | 4/2.5 (+1) | 1,881 (-15%) | 7mo | $285,000 | $152 | 31 |
Match score weights: distance 35% · size 25% · config 20% · recency 20%. Top-matched comps best support the ARV.
Projected returns pro-forma
10.0% appreciation · 5.45% rent growth · sell at horizon
- IRR
- 21.1%
- Equity multiple
- 2.72×
- Total profit
- $158,927
- Equity at exit
- $297,290
- IRR
- 19.6%
- Equity multiple
- 6.43×
- Total profit
- $501,470
- Equity at exit
- $641,117
Cash invested: $92,400 (down + closing). Projections, not guarantees.
Landlord ↔ Tenant lean methodology
- Overall (STATE)
- 18 Strongly Tenant-Friendly
- State California
- 18 Strongly Tenant-Friendly · D+13
- County
- — inherits STATE
- City
- — inherits STATE
ZIP-level market 93505
- Home prices YoY
- 13.0%
- Rents YoY
- 5.5%
- Active inventory
- 704
- Price-to-rent
- 12.2×
Monthly cashflow live
- Estimated rent
- $2,245 high interval (Pro) →
- Mortgage (P&I)
- −$1,731
- Tax from tax record
- −$321 /mo · $3,848/yr
- Insurance
- −$138
- HOA
- −$0
- Vacancy / Maint / Mgmt
- −$471
- Net cashflow
- $-415
Break-even live
Sensitivity live
| Price | -10% $-228 | -5% $-322 | +0% $-415 | +5% $-509 | +10% $-602 |
|---|---|---|---|---|---|
| Rent | -10% $-593 | -5% $-504 | +0% $-415 | +5% $-327 | +10% $-238 |
| Rate | -1.0pp $-249 | -0.5pp $-331 | base $-415 | +0.5pp $-501 | +1.0pp $-588 |
UW: 25.0% down · 7.5% · 30yr · 1.5% tax · 5.0% vac · 8.0% maint · 8.0% mgmt
Financing live
Cash to close
- Down payment
- $82,500
- Closing costs
- $9,900
- Reserves months
- —
- Total cash needed
- —
Loan-product check · same deal, 3 products live
Conventional
25% down · 7.5% · 30yr
- Down + closing
- —
- Monthly P&I
- —
- Monthly cashflow
- —
- DSCR
- —
- Eligible?
- —
Personal DTI + credit; lowest rate.
DSCR
20% down · 8.5% · 30yr
- Down + closing
- —
- Monthly P&I
- —
- Monthly cashflow
- —
- DSCR
- —
- Eligible?
- —
No personal income docs; deal must DSCR.
Hard money
10% down · 12.0% · 12mo
- Down + closing
- —
- Monthly P&I
- —
- Monthly cashflow
- —
- DSCR
- —
- Eligible?
- —
Short-term bridge; refi at stabilization.
Rent comps 14 comps
| Address | Beds | Baths | Sqft | Rent | $/sqft | DOM | Units | Dist |
|---|---|---|---|---|---|---|---|---|
| 20300 Graham St California City, CA | 4.0 | 2.5 | 2016 | $2,150 | $1.07 | 25d | 1 | 0.03mi |
| 20425 81st St California City, CA | 4.0 | 3.0 | 2215 | $2,900 | $1.31 | 20d | 1 | 0.21mi |
| 20312 Dean Ct California City, CA | 3.0 | 2.0 | 1742 | $1,975 | $1.13 | 16d | 1 | 0.43mi |
| 8312 Tamarack Ave California City, CA | 3.0 | 2.0 | 1539 | $1,900 | $1.23 | 25d | 1 | 0.43mi |
| 8124 Underwood Ave California City, CA | 3.0 | 2.0 | 1507 | $1,850 | $1.23 | 25d | 1 | 0.46mi |
| 20673 Medio St California City, CA | 3.0 | 2.0 | 1690 | $2,075 | $1.23 | 25d | 1 | 0.48mi |
| 8173 Viburnum Ave California City, CA | 3.0 | 2.0 | 1482 | $2,150 | $1.45 | 4d | 1 | 0.48mi |
| 8648 Lime Ave California City, CA | 3.0 | 2.0 | 1459 | $2,400 | $1.64 | 25d | 1 | 0.52mi |
| 8512 Tamarack Ave California City, CA | 3.0 | 2.0 | 1502 | $1,875 | $1.25 | 25d | 1 | 0.55mi |
| 8801 S Loop Blvd California City, CA | 3.0 | 2.0 | 1537 | $2,600 | $1.69 | 25d | 1 | 0.76mi |
| 9000 Underwood Ave California City, CA | 3.0 | 2.0 | 1540 | $1,900 | $1.23 | 0d | 1 | 0.98mi |
| 8849 Glade Ave California City, CA | 3.0 | 2.0 | 1586 | $2,380 | $1.50 | 12d | 1 | 1.06mi |
| 7733 Walpole Ave Unit A California City, CA | 3.0 | 2.0 | 1600 | $2,000 | $1.25 | 25d | 1 | 1.08mi |
| 21231 Corwin St California City, CA | 3.0 | 2.0 | 1632 | $2,500 | $1.53 | 25d | 1 | 1.29mi |
Listing history 38 events
-
2026-06-22days on market $330,000 Active 41 DOM
-
2026-06-18days on market $330,000 Active 38 DOM
-
2026-06-17days on market $330,000 Active 37 DOM
-
2026-06-16days on market $330,000 Active 36 DOM
-
2026-06-15days on market $330,000 Active 35 DOM
-
2026-06-14days on market $330,000 Active 33 DOM
-
2026-06-13days on market $330,000 Active 32 DOM
-
2026-06-10days on market $330,000 Active 30 DOM
-
2026-06-09days on market $330,000 Active 29 DOM
-
2026-06-08days on market $330,000 Active 28 DOM
-
2026-06-07days on market $330,000 Active 27 DOM
-
2026-06-05days on market $330,000 Active 24 DOM
-
2026-06-03days on market $330,000 Active 23 DOM
-
2026-06-03days on market $330,000 Active 22 DOM
-
2026-06-01days on market $330,000 Active 21 DOM
-
2026-05-31days on market $330,000 Active 20 DOM
-
2026-05-11$330,000 Active 841-char remark
-
2026-05-04historical
-
2025-11-06$370,000 Active
-
2021-02-02soldstatus $266,000 Closed
Show marketing remark (564 chars)
This classic three bedroom, two bathroom house is nestled perfectly on the corner of a quaint neighborhood. This beautiful home has an island in the kitchen that doubles as a bar for seating. The kitchen offers a nice layout with stainless steel appliances, an industrial style sink and faucet, recessed lighting, and a walk in pantry. The living room has light-wash tile and a spacious atmosphere. The laundry room acts as a mudroom with access to the garage. The master bedroom has a walk in closet, beautiful windows, and a ceiling fan. Come check it out today!
-
2021-02-01soldstatus $266,000
-
2020-10-30status Active
Show marketing remark (564 chars)
This classic three bedroom, two bathroom house is nestled perfectly on the corner of a quaint neighborhood. This beautiful home has an island in the kitchen that doubles as a bar for seating. The kitchen offers a nice layout with stainless steel appliances, an industrial style sink and faucet, recessed lighting, and a walk in pantry. The living room has light-wash tile and a spacious atmosphere. The laundry room acts as a mudroom with access to the garage. The master bedroom has a walk in closet, beautiful windows, and a ceiling fan. Come check it out today!
-
2020-10-07$279,900 Active
Show marketing remark (564 chars)
This classic three bedroom, two bathroom house is nestled perfectly on the corner of a quaint neighborhood. This beautiful home has an island in the kitchen that doubles as a bar for seating. The kitchen offers a nice layout with stainless steel appliances, an industrial style sink and faucet, recessed lighting, and a walk in pantry. The living room has light-wash tile and a spacious atmosphere. The laundry room acts as a mudroom with access to the garage. The master bedroom has a walk in closet, beautiful windows, and a ceiling fan. Come check it out today!
-
2016-05-20soldstatus $150,000
-
2016-05-19soldstatus $149,900 Closed
-
2016-02-22status Pending
-
2015-12-02price $149,900
-
2015-10-09$159,000 Active
-
2015-03-27historical
-
2011-08-29historical
-
2011-08-29historical
-
2011-04-15$22,000
-
2011-04-15$22,000
-
2010-04-05$29,000
-
2010-03-31historical
-
2009-10-30$40,000
-
2009-03-12historical
-
2008-05-30$72,500
ⓘ Source: listings_history table (triggers on properties + properties_extension) + one-shot
backfill from property_details.listing_events for pre-trigger history.
Tax reassessment forecast CA · Resets to sale price
- Current annual tax
- $3,848 · $321/mo
- Projected year-2 tax
- $3,848 · $321/mo
- Expected delta
- $0/yr ($0/mo · 0.0%)
ⓘ Screening estimate from a state-policy table — verify with the county assessor before closing.
Climate risk First Street
- Flood 1/10 Low FEMA zone X (unshaded) · 0% chance over 30 yrs
- Wildfire 1/10 Low
- Heat 8/10 Severe 7 d/yr ≥101°F today · 18 d/yr by 30 yrs out
- Wind 1/10 Low
- Air quality 7/10 Severe 13 unhealthy d/yr today · 17 by 30 yrs out
Nearby sold comps map
Loading sold comps map…
Walkable amenities ~0.75 mi
Loading nearby amenities…
Taxation est. · year 1
- Rental income
- $26,939
- − Mortgage interest
- −$18,485
- − Property taxes
- −$3,848
- − Insurance
- −$1,650
- − Repairs & maintenance
- −$2,155
- − Management
- −$2,155
- − Depreciation
- −$9,600
- Taxable loss
- −$10,954
- Est. tax savings @ 24.0%
- +$2,629
- After-tax cash flow
- $-2,354/yr
For passive investors: Depreciation is non-cash, so a rental often shows a tax loss while cash-flowing — sheltering income. Rental losses are passive: they offset passive income freely, and up to $25,000/yr can offset ordinary (W-2) income if you actively participate and your MAGI is under $100k (phasing out to $0 by $150k); unused losses carry forward. On sale, claimed depreciation is recaptured at up to 25%, and gains may owe capital-gains tax (a 1031 exchange can defer both). Figures are a year-1 estimate at your 24.0% rate — not tax advice; consult a CPA.
Schools (NCES district)
- District
- Mojave Unified
- NCES district ID
- 0625230
- Math proficiency
- 25% ▲ 11.00%
- Reading proficiency
- 25% ▼ -1.00%
- Median HH income
- $43,017
- Composite
- 21.4/100
- National rank
- #8350
- State rank
- #411 of 517 in CA
Livability — California City
- Score
- 44/100
- State rank
- #1329
- US rank
- #26753
Category grades
Schools grade is shown separately in the Schools card above.
Census & demographics
- Census place
- California City, CA
- County
- Kern County · 710,371 people
- City population
- 14,353
- Metro
- Bakersfield, CA
- Population (ZIP)
- 14,353
- Household income
- $59,827
- Rent vs Own
- Severe rent burden
- 883.0
Population outlook (Kern County) Hauer SSP2
- Today (2025)
- 947,286 people
- By 2030
- 978,984 · +3.3%
- By 2040
- 1,045,018 · +10.3%
- By 2050
- 1,105,232 · +16.7%
- By 2075
- 1,229,538 · +29.8%
- By 2100
- 1,238,059 · +30.7%
Race, ethnicity, and origin ACS 2023
- Neighborhood character
- Highly diverse neighborhood (Simpson 0.70)
- Race & ethnicity
- Hispanic / Latino 40% White 30% Black 22% Two or more races 16% Native American 3% Asian 1%
- Hispanic origin (detail)
- Mexican 29%
- Common ancestry
- Italian 3% Lithuanian 1% Romanian 1%
- Foreign-born
- 13% · Canada, Dominican Republic
- Languages at home
- 68% English-only · Spanish 29%
Political lean MEDSL · Kern
- 2024 margin
- Strong R (+21.1) · D 38.2% · R 59.3% · Other 2.5%
- 2008→2024 swing
- -3.3pp toward R · 2008: -17.8pp · 2024: -21.1pp
- All cycles
- 2024: R+21.1 2020: R+10.2 2016: R+15.0 2012: R+20.9 2008: R+17.8
Not yet ingested
- Civics
- —
Market trends
- HPI YoY
- ▲ 46.32%
- Current HPI
- 402.4192
- Rent YoY
- ▲ 5.45%
- Metro
- Bakersfield, CA
- State GDP YoY
- ▲ 3.21%
- F500 in state
- 116
Industry mix (Fortune 500 HQ in CA)
| Industry | F500 HQs | Revenue |
|---|---|---|
| Technology | 27 | $1,492B |
|
||
| Financial Services | 3 | $174B |
|
||
| Retail | 3 | $44B |
|
||
| Insurance | 3 | $26B |
|
||
| Media / Entertainment | 2 | $115B |
|
||
| Pharmaceuticals / Biotech | 2 | $62B |
|
||
Price history
+355.2% since first listed22 events — show timeline
- 2026-05-11 Listed $330,000 CRMLS
- 2026-05-04 Listing Removed — CRMLS
- 2025-11-06 Listed $370,000 CRMLS
- 2021-02-02 Sold (MLS) $266,000 AVMLS
- 2021-02-01 Sold (Public Records) $266,000 Public Records
- 2020-10-30 Relisted — AVMLS
- 2020-10-07 Listed $279,900 AVMLS
- 2016-05-20 Sold (Public Records) $150,000 Public Records
- 2016-05-19 Sold (MLS) $149,900 AVMLS
- 2016-02-22 Pending — AVMLS
- 2015-12-02 Price Changed $149,900 AVMLS
- 2015-10-09 Listed $159,000 AVMLS
- 2015-03-27 Listing Removed — AVMLS
- 2011-08-29 Listing Removed — AVMLS
- 2011-08-29 Listing Removed — CRMLS
- 2011-04-15 Listed $22,000 AVMLS
- 2011-04-15 Listed $22,000 CRMLS
- 2010-04-05 Listed $29,000 AVMLS
- 2010-03-31 Listing Removed — CRMLS
- 2009-10-30 Listed $40,000 CRMLS
- 2009-03-12 Listing Removed — CRMLS
- 2008-05-30 Listed $72,500 CRMLS
Property tax history
+15.9%/yrLatest (2025): $3,848 · -5.4% YoY. Source: county tax records.
Cash-flow waterfall
monthlySold comps — $/sqft
last 12 mo · ≤1 miLoading sold comps…