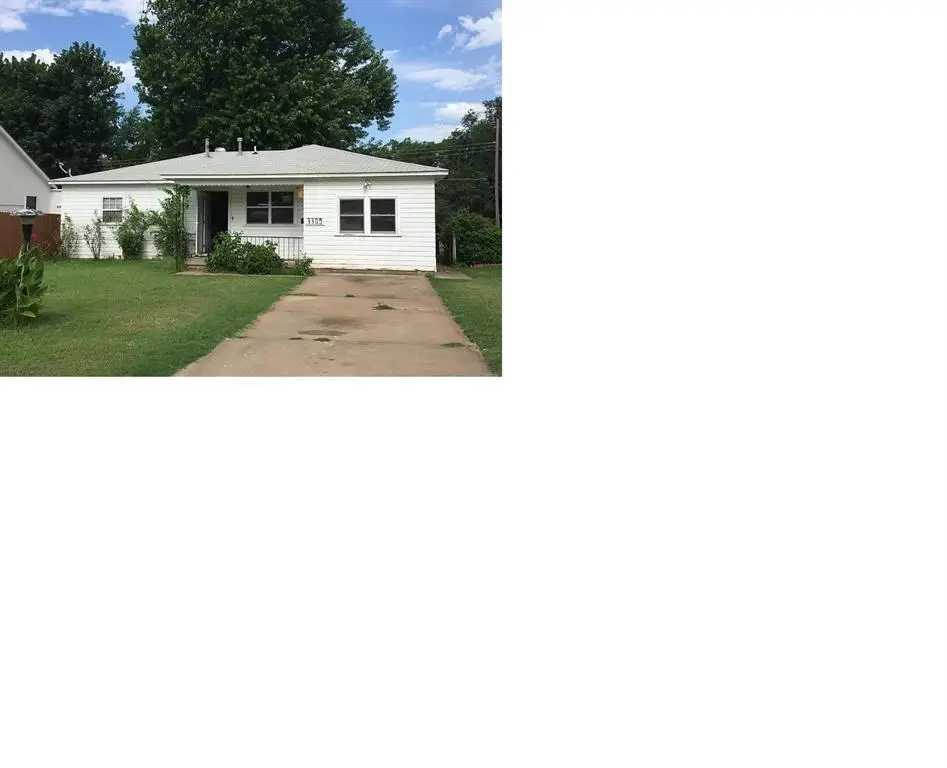
3305 S Kelley Ave · Oklahoma City, OK
Flood risk 1/10 · Minimal
- FEMA flood zone
- X (unshaded)
- Chance of flooding over 30 yrs
- 0.0%
- Est. flood insurance / yr
- $507 – $1,088
Fire risk 1/10 · Minimal
- Est. fire insurance / yr
- $2,463 – $4,575
Heat risk 6/10 · Moderate
- Hot days now (above 107°F)
- 7 days/yr
- Hot days in 30 yrs
- 19 days/yr
Wind risk 2/10 · Minimal
- Chance of severe wind over 30 yrs
- 4.0%
Air-quality risk 1/10 · Minimal
- Unhealthy air days now
- 0 days/yr
- Unhealthy air days in 30 yrs
- 0 days/yr
Risk factors via First Street. Map © Google.
Why this score? — see what drove the D- grade
The composite is a weighted blend of 9 inputs, each scored 0–100. Each bar is that input's sub-score; the figure is the points it added to the 100-point composite (weight × sub-score).
- Cash flow +14.1/30.0
- Appreciation +5.9/10.0
- DSCR +4.3/10.0
- Livability +4.0/5.0
- 1% rule +3.1/10.0
- Rent growth +2.5/5.0
- Condition / age +2.5/5.0
- Schools +0.7/10.0
- ARV discount +0.0/15.0
$124,999
🖨 Deal sheet (PDF) 📄 Offer letter ✓ Due diligence
Listing remarks MLS
Enhance your rental portfolio with this recently renovated 3-bedroom, 1.75-bath home in Oklahoma City. Featuring new central HVAC, refinished wood flooring, new paint, and various other capex repairs that have been done. This property is currently rented with an income of $13,200 per year, with potential for increased returns as market rents rise. Located in a desirable neighborhood with easy access to amenities, this well-maintained home is a prime investment opportunity.
Key facts
- New central hvac
- Well-maintained home
- 6,499 sq ft lot
Tags
Neighborhood map
What this means for you Summary
Snapshot
- This is a 2-bed/1.0-bath single-family listed at $125k.
Deal economics
- At list price, monthly cash flow is $18 ($218/yr) — positive.
- The deal already cash-flows at list — no discount required.
- To meet the 1% rule (rent ≥ 1% of price), the offer needs to be $102k (18.6% below list).
- Recommended offer: $102k (18.6% below list) — sets the bar for 1% rule.
- Cap rate 6.5% vs local median 3.7% in Oklahoma City — top-decile yield for the area; either an underpriced asset or a hidden risk that comps aren't pricing in. Stress-test before assuming the spread holds.
Location & tenants
- Location reads 80/100 on livability (#3 in OK, #1,635 nationally) — a professional / high-income tenant draw. Strengths: amenities A+, commute A+, cost of living A+; Watch: schools F, crime F.
- Oklahoma City (urban): math 7% / reading 10% proficiency, ranked #254 of 270 in OK (top 94%) — low school quality limits family demand, transient renter base, plan for 1-2y turnover; 82% free/reduced lunch — lower-income household profile, screen leases tightly.
- Market conditions: 83 active listings in the ZIP; 23 comparable units currently listed for rent nearby; rentals at typical pace (median 25d on market — plan ~3-4 weeks tenant-placement turnaround); 43% of comp listings sitting > 30 days — soft ceiling on asking rent; 5,365 units permitted in Oklahoma County in 2024 (569 in 5+ unit buildings).
Forward outlook
- In year one you build about $3k of equity ($864 loan paydown + $2k appreciation (1.8% local appreciation)).
- Oklahoma County population projected at +41% by 2050 — long-run rental-demand tailwind backs the buy-and-hold thesis.
- At projected returns (1.8% appreciation + 3.0% rent growth), your $35k cash investment doubles in ~8 years — after that, you're playing with house money.
- By year 10, paydown + projected appreciation supports a ~$30k cash-out refi (75% LTV) — recoverable capital for the next deal without selling this one.
Negotiation context
- It's been on market 686 days — a 12% lower offer ($110k) is reasonable based on typical stale-listing flexibility.
- 2 sale attempts since 11y ago with the ask held roughly flat each time — persistent listings suggest the price (not the market) is what's stuck; bring a comps-based counter.
- Current owner paid $28k; list at $125k implies a 346% gain — meaningful room to come down on a strong offer.
Risks & watch-outs
- Climate carrying-cost: extreme-heat days projected 7→19/yr by 2055 (HVAC capex compounding) — expect insurance premiums to compound above CPI over the hold.
Questions for the listing agent
- It's been on market 686 days. Have you received any prior offers? Is the seller open to a 19% concession, seller financing, or rate buy-down credit?
- Built in 1962 — when were the roof, HVAC, electrical panel, plumbing, and water heater last replaced?
- Why hasn't it sold? Are there any deal-killer items the seller is aware of (foundation, flood, title, zoning, code violations)?
- Is there a deadline driving the sale (1031 exchange, divorce, estate, relocation)? That informs how much negotiation room exists.
- Schools are F-rated, which usually means shorter tenancies and higher turnover. Who's the typical renter profile here, and what's been the actual vacancy rate?
- Crime grade is F in this area — have there been break-ins, vandalism, or insurance claims at this property in the last 3 years? What carrier currently insures it and at what premium?
- The area grade is low — what's the realistic commute time and amenity access for the typical tenant pool here? Any planned neighborhood developments (good or bad) we should know about?
- What's the average days-on-market for RENTAL listings here right now (not sales)? A rising rental-DOM trend means longer vacancies and softer asking-rent achievability than the comps imply.
- What's the recent tenant-quality profile in this submarket — average credit score on applications, eviction rate, late-payment / NSF rate, and stable-employment percentage? A property-management company in the area should have these aggregated.
- How much new for-sale + rental construction is in the pipeline within 1–3 miles? Heavy new supply typically softens prices + rents 12–24 months out; constrained supply supports both.
Investment metrics
- 1% rule
- 0.81% ✗
- Cap rate
- 6.47%
- Cash-on-cash
- 0.62%
- DSCR
- 1.03
- GRM
- 10.2
CMA / ARV
- ARV (median comp)
- $101,069
- List price
- $124,999
- Delta
- 23.68%
- Verdict
- OVERPRICED
- Comps
- 20 within 1.0 mi
Show comp detail 12 sales within ~0.75 mi
| Address | Dist | Beds/Ba | Sqft | Sold | Price | $/sf | Match |
|---|---|---|---|---|---|---|---|
| 716 SE 31st St | 0.19mi | 3/1.0 (+1) | 864 (+0%) | 19mo | $123,000 | $142 | 69 |
| 3411 S Kelley Ave | 0.07mi | 3/1.0 (+1) | 837 (-3%) | 24mo | $145,000 | $173 | 68 |
| 717 SE 31st St | 0.21mi | 2/1.0 | 770 (-10%) | 7mo | $54,900 | $71 | 67 |
| 633 SE 39th St | 0.43mi | 3/1.0 (+1) | 885 (+3%) | 5mo | $156,000 | $176 | 66 |
| 617 SW 35th St | 0.28mi | 2/1.0 | 776 (-10%) | 6mo | $146,000 | $188 | 65 |
| 720 SE 31st St | 0.18mi | 2/1.0 | 960 (+12%) | 9mo | $80,000 | $83 | 65 |
| 312 SE 40th St | 0.70mi | 2/1.0 | 843 (-2%) | 3mo | $160,000 | $190 | 61 |
| 313 SE 40th St | 0.69mi | 2/1.0 | 836 (-3%) | 12mo | $155,900 | $186 | 53 |
| 701 SE 35th St | 0.22mi | 2/1.0 | 744 (-14%) | 21mo | $95,000 | $128 | 50 |
| 809 SE 43rd St | 0.65mi | 3/1.0 (+1) | 910 (+6%) | 15mo | $145,000 | $159 | 42 |
| 336 SE 38th St | 0.57mi | 3/1.5 (+1) | 928 (+8%) | 22mo | $123,000 | $133 | 35 |
| 1100 SE 39th St | 0.47mi | 3/1.5 (+1) | 744 (-14%) | 20mo | $148,000 | $199 | 32 |
Match score weights: distance 35% · size 25% · config 20% · recency 20%. Top-matched comps best support the ARV.
Projected returns pro-forma
1.75% appreciation · 3.0% rent growth · sell at horizon
- IRR
- 4.4%
- Equity multiple
- 1.23×
- Total profit
- $8,096
- Equity at exit
- $47,601
- IRR
- 8.2%
- Equity multiple
- 2.08×
- Total profit
- $37,768
- Equity at exit
- $67,262
Cash invested: $35,000 (down + closing). Projections, not guarantees.
Landlord ↔ Tenant lean methodology
- Overall (STATE)
- 83 Strongly Landlord-Friendly
- State Oklahoma
- 83 Strongly Landlord-Friendly · R+20
- County
- — inherits STATE
- City
- — inherits STATE
ZIP-level market 73129
- Home prices YoY
- 0.7%
- Active inventory
- 83
- Price-to-rent
- 10.2×
Monthly cashflow live
- Estimated rent
- $1,017 high interval (Pro) →
- Mortgage (P&I)
- −$656
- Tax from tax record
- −$78 /mo · $936/yr
- Insurance
- −$52
- HOA
- −$0
- Vacancy / Maint / Mgmt
- −$214
- Net cashflow
- $18
Break-even live
Sensitivity live
| Price | -10% $89 | -5% $54 | +0% $18 | +5% $-17 | +10% $-53 |
|---|---|---|---|---|---|
| Rent | -10% $-62 | -5% $-22 | +0% $18 | +5% $58 | +10% $99 |
| Rate | -1.0pp $81 | -0.5pp $50 | base $18 | +0.5pp $-14 | +1.0pp $-47 |
UW: 25.0% down · 7.5% · 30yr · 1.5% tax · 5.0% vac · 8.0% maint · 8.0% mgmt
Financing live
Cash to close
- Down payment
- $31,250
- Closing costs
- $3,750
- Reserves months
- —
- Total cash needed
- —
Loan-product check · same deal, 3 products live
Conventional
25% down · 7.5% · 30yr
- Down + closing
- —
- Monthly P&I
- —
- Monthly cashflow
- —
- DSCR
- —
- Eligible?
- —
Personal DTI + credit; lowest rate.
DSCR
20% down · 8.5% · 30yr
- Down + closing
- —
- Monthly P&I
- —
- Monthly cashflow
- —
- DSCR
- —
- Eligible?
- —
No personal income docs; deal must DSCR.
Hard money
10% down · 12.0% · 12mo
- Down + closing
- —
- Monthly P&I
- —
- Monthly cashflow
- —
- DSCR
- —
- Eligible?
- —
Short-term bridge; refi at stabilization.
Rent comps 23 comps
| Address | Beds | Baths | Sqft | Rent | $/sqft | DOM | Units | Dist |
|---|---|---|---|---|---|---|---|---|
| 1413 SE 39th St Oklahoma City, OK | 3.0 | 1.0 | 1004 | $1,125 | $1.12 | 44d | 1 | 0.61mi |
| 407 SE 25th St Oklahoma City, OK | 3.0 | 1.0 | 896 | $1,275 | $1.42 | 45d | 1 | 0.77mi |
| 4101 S Shields Blvd Unit Shields 3B Oklahoma City, OK | 3.0 | 2.0 | 957 | $1,050 | $1.10 | 24d | 1 | 0.84mi |
| 4101 S Shields Blvd Apt 3B Oklahoma City, OK | 3.0 | 2.0 | 957 | $1,025 | $1.07 | 4d | 1 | 0.84mi |
| 317 SE 24th St Oklahoma City, OK | 2.0 | 1.0 | 917 | $950 | $1.04 | 4d | 1 | 0.87mi |
| 630 SE 21st St Oklahoma City, OK | 3.0 | 2.0 | 1000 | $1,095 | $1.09 | 44d | 1 | 0.91mi |
| 526 SE 21st St Oklahoma City, OK | 3.0 | 1.0 | 1054 | $1,150 | $1.09 | 4d | 1 | 0.94mi |
| 726 SE 20th St Oklahoma City, OK | 2.0 | 1.0 | 672 | $1,095 | $1.63 | 44d | 1 | 0.96mi |
| 109 SE 42nd St Apt A Oklahoma City, OK | 2.0 | 1.0 | 800 | $799 | $1.00 | 17d | 1 | 0.96mi |
| 101 SE 42nd St Unit B Oklahoma City, OK | 2.0 | 1.0 | 740 | $645 | $0.87 | 44d | 1 | 0.98mi |
| 4908 S Stiles Ave Oklahoma City, OK | 2.0 | 1.0 | 600 | $1,000 | $1.67 | 44d | 1 | 1.14mi |
| 1528 SE 47th Pl Oklahoma City, OK | 3.0 | 1.0 | 1092 | $1,300 | $1.19 | 4d | 1 | 1.18mi |
| 220 SW 34th St Oklahoma City, OK | 1.0 | 1.0 | 625 | $725 | $1.16 | 44d | 1 | 1.19mi |
| 3312 S Harvey Ave Oklahoma City, OK | 2.0 | 1.0 | 840 | $1,100 | $1.31 | 21d | 1 | 1.23mi |
| 1528 SE 49th Ter Oklahoma City, OK | 3.0 | 1.0 | 912 | $1,100 | $1.21 | 24d | 1 | 1.26mi |
| 116 SW 23rd St Oklahoma City, OK | 1.0 | 1.0 | 700 | $650 | $0.93 | 44d | 1 | 1.29mi |
| 115 SW 23rd St Oklahoma City, OK | 1.0 | 1.0 | 750 | $575 | $0.77 | 16d | 1 | 1.30mi |
| 3913 S Harvey Ave Unit 2 Oklahoma City, OK | 1.0 | 1.0 | 568 | $900 | $1.58 | 44d | 1 | 1.31mi |
| 1501 SE 52nd St Oklahoma City, OK | 3.0 | 2.0 | 1012 | $1,200 | $1.19 | 24d | 1 | 1.36mi |
| 316 SW 27th St Unit 8 Oklahoma City, OK | 1.0 | 1.0 | 615 | $679 | $1.10 | 44d | 1 | 1.37mi |
| 316 SW 27th St Unit 4 Oklahoma City, OK | 1.0 | 1.0 | 615 | $679 | $1.10 | 12d | 1 | 1.37mi |
| 3906 S Hudson Ave Oklahoma City, OK | 1.0 | 1.0 | 700 | $750 | $1.07 | 24d | 1 | 1.38mi |
| 404 SW 26th St Unit 6 Oklahoma City, OK | 1.0 | 1.0 | 600 | $645 | $1.07 | 12d | 1 | 1.45mi |
Listing history 19 events
-
2026-06-18days on market $124,999 Active 686 DOM
-
2026-06-17days on market $124,999 Active 685 DOM
-
2026-06-16days on market $124,999 Active 684 DOM
-
2026-06-15days on market $124,999 Active 683 DOM
-
2026-06-13days on market $124,999 Active 681 DOM
-
2026-06-09days on market $124,999 Active 677 DOM
-
2026-06-08days on market $124,999 Active 676 DOM
-
2026-06-07days on market $124,999 Active 675 DOM
-
2026-06-05days on market $124,999 Active 672 DOM
-
2026-06-03days on market $124,999 Active 671 DOM
-
2026-06-02days on market $124,999 Active 670 DOM
-
2026-06-02remarks 505-char remark
-
2026-06-01days on market $124,999 Active 669 DOM
-
2026-05-31days on market $124,999 Active 668 DOM
-
2024-08-01$124,999 Active 477-char remark
Show marketing remark (477 chars)
Enhance your rental portfolio with this recently renovated 3-bedroom, 1.75-bath home in Oklahoma City. Featuring new central HVAC, refinished wood flooring, new paint, and various other capex repairs that have been done. This property is currently rented with an income of $13,200 per year, with potential for increased returns as market rents rise. Located in a desirable neighborhood with easy access to amenities, this well-maintained home is a prime investment opportunity.
-
2015-12-23historical
-
2015-06-22$56,500 Active
-
1997-03-10soldstatus $28,000
-
1994-08-30soldstatus $21,500
ⓘ Source: listings_history table (triggers on properties + properties_extension) + one-shot
backfill from property_details.listing_events for pre-trigger history.
Tax reassessment forecast OK · Resets to sale price
- Current annual tax
- $936 · $78/mo
- Projected year-2 tax
- $1,125 · $94/mo
- Expected delta
- +$189/yr (+$16/mo · 20.2%)
ⓘ Screening estimate from a state-policy table — verify with the county assessor before closing.
Climate risk First Street
- Flood 1/10 Low FEMA zone X (unshaded) · 0% chance over 30 yrs
- Wildfire 1/10 Low
- Heat 6/10 Major 7 d/yr ≥107°F today · 19 d/yr by 30 yrs out
- Wind 2/10 Low 4% chance of damaging wind over 30 yrs
- Air quality 1/10 Low 0 unhealthy d/yr today · 0 by 30 yrs out
Nearby sold comps map
Loading sold comps map…
Walkable amenities ~0.75 mi
Loading nearby amenities…
Taxation est. · year 1
- Rental income
- $12,209
- − Mortgage interest
- −$7,002
- − Property taxes
- −$936
- − Insurance
- −$625
- − Repairs & maintenance
- −$977
- − Management
- −$977
- − Depreciation
- −$3,636
- Taxable loss
- −$1,943
- Est. tax savings @ 24.0%
- +$466
- After-tax cash flow
- $685/yr
For passive investors: Depreciation is non-cash, so a rental often shows a tax loss while cash-flowing — sheltering income. Rental losses are passive: they offset passive income freely, and up to $25,000/yr can offset ordinary (W-2) income if you actively participate and your MAGI is under $100k (phasing out to $0 by $150k); unused losses carry forward. On sale, claimed depreciation is recaptured at up to 25%, and gains may owe capital-gains tax (a 1031 exchange can defer both). Figures are a year-1 estimate at your 24.0% rate — not tax advice; consult a CPA.
Schools (NCES district)
- District
- Oklahoma City
- NCES district ID
- 4022770
- Math proficiency
- 7% ▼ -5.00%
- Reading proficiency
- 10% ▼ -6.00%
- Median HH income
- $35,606
- Composite
- 7.0/100
- National rank
- #9970
- State rank
- #254 of 270 in OK
Livability — Oklahoma City
- Score
- 80/100
- State rank
- #3
- US rank
- #1635
Category grades
Schools grade is shown separately in the Schools card above.
Census & demographics
- Census place
- Oklahoma City, OK
- County
- Oklahoma County · 771,644 people
- City population
- 498,656
- Metro
- Oklahoma City, OK
- Population (ZIP)
- 20,014
- Household income
- $46,670
- Rent vs Own
- Severe rent burden
- 611.0
Population outlook (Oklahoma County) Hauer SSP2
- Today (2025)
- 911,875 people
- By 2030
- 982,413 · +7.7%
- By 2040
- 1,130,468 · +24.0%
- By 2050
- 1,288,422 · +41.3%
- By 2075
- 1,711,482 · +87.7%
- By 2100
- 2,088,448 · +129.0%
Race, ethnicity, and origin ACS 2023
- Neighborhood character
- Diverse neighborhood (Simpson 0.61)
- Race & ethnicity
- Hispanic / Latino 57% Two or more races 26% White 26% Black 9% Native American 7% Asian 1%
- Hispanic origin (detail)
- Mexican 53%
- Common ancestry
- Italian 1% Lithuanian 1% Slovak 1%
- Foreign-born
- 24% · Canada, Dominican Republic
- Languages at home
- 54% English-only · Spanish 44% Other Asian/Pacific 1% Vietnamese 1%
Political lean MEDSL · Oklahoma
- 2024 margin
- Toss-up / Even · D 48.0% · R 49.7% · Other 2.3%
- 2008→2024 swing
- +15.1pp toward D · 2008: -16.8pp · 2024: -1.7pp
- All cycles
- 2024: R+1.7 2020: R+1.1 2016: R+10.5 2012: R+16.7 2008: R+16.8
Not yet ingested
- Civics
- —
Market trends
- HPI YoY
- ▲ 1.75%
- Current HPI
- 250.8581
- Rent YoY
- —
- Metro
- Oklahoma City, OK
- State GDP YoY
- ▲ 1.55%
- F500 in state
- 6
Industry mix (Fortune 500 HQ in OK)
| Industry | F500 HQs | Revenue |
|---|---|---|
| Energy | 3 | $48B |
|
||
Price history
+481.4% since first listed5 events — show timeline
- 2024-08-01 Listed $124,999 MLSOK
- 2015-12-23 Listing Removed — MLSOK
- 2015-06-22 Listed $56,500 MLSOK
- 1997-03-10 Sold (Public Records) $28,000 Public Records
- 1994-08-30 Sold (Public Records) $21,500 Public Records
Property tax history
+10.8%/yrLatest (2025): $936 · +4.4% YoY. Source: county tax records.
Cash-flow waterfall
monthlySold comps — $/sqft
last 12 mo · ≤1 miLoading sold comps…