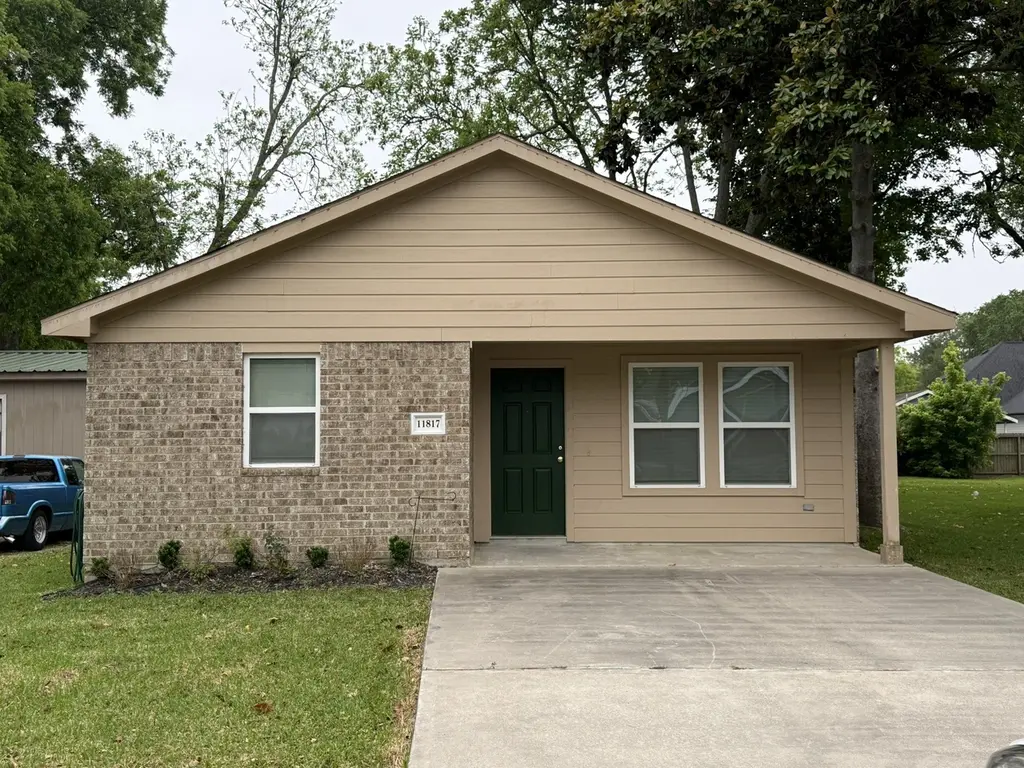
11817 13th St · Santa Fe, TX
Flood risk 6/10 · Moderate
- FEMA flood zone
- X (shaded)
- Chance of flooding over 30 yrs
- 0.74%
- Est. flood insurance / yr
- $507 – $1,088
Fire risk 3/10 · Minor
- Est. fire insurance / yr
- $1,222 – $2,270
Heat risk 10/10 · Severe
- Hot days now (above 110°F)
- 7 days/yr
- Hot days in 30 yrs
- 26 days/yr
Wind risk 9/10 · Severe
- Chance of severe wind over 30 yrs
- 99.0%
Air-quality risk 2/10 · Minimal
- Unhealthy air days now
- 1 days/yr
- Unhealthy air days in 30 yrs
- 1 days/yr
Risk factors via First Street. Map © Google.
Why this score? — see what drove the B+ grade
The composite is a weighted blend of 9 inputs, each scored 0–100. Each bar is that input's sub-score; the figure is the points it added to the 100-point composite (weight × sub-score).
- Cash flow +30.0/30.0
- ARV discount +13.8/15.0
- 1% rule +10.0/10.0
- DSCR +10.0/10.0
- Schools +3.5/10.0
- Livability +3.4/5.0
- Rent growth +2.5/5.0
- Condition / age +2.5/5.0
- Appreciation +0.0/10.0
$215,000
🖨 Deal sheet 📄 Offer letter ✓ Due diligence
Listing remarks MLS
Three bedroom, two full bath brick home on a slab. City water and sewer. Solid surface flooring. Kitchen with open dining area. Fully fenced back yard. Storage building in back. Ready for immediate occupancy
Key facts
- Storage shed
- Fenced backyard
- Large walk-in shower
Tags
Property features AI
Finance
- Other: Seller disclosure available
- Financial info: Lease not considered
Exterior
- Parking: Driveway
- Utilities: Public water; Public sewer
- Home design: Residential property; Built in 2013; Slab foundation; Composition roof
- Construction: Brick construction
- Exterior features: Fully fenced backyard; Storage shed; Additional storage; Cleared lot in a subdivision; Concrete road access
Interior
- Kitchen: Dishwasher; Electric oven; Electric range; Microwave
- Flooring: Concrete flooring
- Bathrooms: 2 full bathrooms
- Heating & cooling: Central electric heating; Central air conditioning; Thermostat (energy-efficient)
- Interior features: Double vanity; Kitchen/family room combo; Laminate countertops; Tub with shower; Window treatments; Ceiling fan(s); Kitchen/dining combo; Programmable thermostat; No fireplaces; 8 total rooms
- Laundry & utility: Washer hookup; Electric dryer hookup
Neighborhood map
What this means for you Summary
Snapshot
- This is a 3-bed/2.0-bath single-family listed at $215k.
Deal economics
- At list price, monthly cash flow is $5k ($59k/yr) — positive.
- The deal already cash-flows at list — no discount required.
- Meets the 1% rule at list price ($8k rent vs $215k).
- Recommended offer: $209k (3.0% below list) — sets the bar for market timing.
- Cap rate 33.7% vs local median 4.5% in Santa Fe — top-decile yield for the area; either an underpriced asset or a hidden risk that comps aren't pricing in. Stress-test before assuming the spread holds.
Location & tenants
- Location reads 67/100 on livability (#550 in TX) — a middle-class / working-renter tenant base. Strengths: crime A+, cost of living A+, housing A+; Watch: amenities F, commute F, health & safety F.
- Santa Fe ISD (suburban): math 38% / reading 39% proficiency, ranked #385 of 826 in TX (top 47%) — families likely to look elsewhere, expect single-tenant / working-renter base with shorter leases.
- Zoned schools: William F Barnett El (math 59% / reading 46%, grade C-, #720 of 4,322 statewide, top 17%, 646 students, 59% FRL); Santa Fe H S (math 19% / reading 34%, grade F, #1,228 of 1,632 statewide, top 76%, 1,369 students, 47% FRL) — zoned schools average 53% FRL vs 35% district-wide (18 pts higher); higher-poverty schools than district average — tighter screening recommended.
- Market conditions: 233 active listings in the ZIP; 2 comparable units currently listed for rent nearby; 3,258 units permitted in Galveston County in 2024 (0 in 5+ unit buildings).
Forward outlook
- Local home prices are declining (-3.0%/yr); year-one equity from $1k of loan paydown is wiped out by about $6k of value loss. Plan a longer hold.
- Galveston County population projected at +43% by 2050 — long-run rental-demand tailwind backs the buy-and-hold thesis.
- At projected returns (-3.0% appreciation + 3.0% rent growth), your $60k cash investment doubles in ~2 years — after that, you're playing with house money.
Negotiation context
- It's been on market 41 days — a 3% lower offer ($209k) is reasonable based on typical stale-listing flexibility.
- 3 sale attempts since 8y ago with the ask held roughly flat each time — persistent listings suggest the price (not the market) is what's stuck; bring a comps-based counter.
Risks & watch-outs
- Climate carrying-cost: major flood risk; severe wind risk, 99% chance of damaging wind over 30y; extreme-heat days projected 7→26/yr by 2055 (HVAC capex compounding) — expect insurance premiums to compound above CPI over the hold.
Questions for the listing agent
- It's been on market 41 days. Have you received any prior offers? Is the seller open to a 3% concession, seller financing, or rate buy-down credit?
- Is there a deadline driving the sale (1031 exchange, divorce, estate, relocation)? That informs how much negotiation room exists.
- What's the average days-on-market for RENTAL listings here right now (not sales)? A rising rental-DOM trend means longer vacancies and softer asking-rent achievability than the comps imply.
- What's the recent tenant-quality profile in this submarket — average credit score on applications, eviction rate, late-payment / NSF rate, and stable-employment percentage? A property-management company in the area should have these aggregated.
- How much new for-sale + rental construction is in the pipeline within 1–3 miles? Heavy new supply typically softens prices + rents 12–24 months out; constrained supply supports both.
Investment metrics
- 1% rule
- 3.85% ✓
- Cap rate
- 33.72%
- Cash-on-cash
- 97.95%
- DSCR
- 5.36
- GRM
- 2.2
CMA / ARV
- ARV (median comp)
- $250,277
- List price
- $215,000
- Delta
- -14.10%
- Verdict
- UNDERPRICED
- Comps
- 20 within 1.0 mi
Show comp detail 12 sales within ~0.75 mi
| Address | Dist | Beds/Ba | Sqft | Sold | Price | $/sf | Match |
|---|---|---|---|---|---|---|---|
| 11915 12th St | 0.14mi | 3/2.0 | 1,198 (-4%) | 14mo | $239,900 | $200 | 76 |
| 4234 Chisholm Trl | 0.34mi | 3/2.0 | 1,263 (+2%) | 10mo | $250,000 | $198 | 73 |
| 11731 Santa Fe Trl | 0.29mi | 3/2.0 | 1,356 (+9%) | 4mo | $257,500 | $190 | 68 |
| 11905 15th St | 0.17mi | 2/2.0 (-1) | 1,370 (+10%) | 10mo | $200,000 | $146 | 61 |
| 5305 Main St | 0.48mi | 3/2.0 | 1,344 (+8%) | 6mo | $150,000 | $112 | 59 |
| 11909 23rd St | 0.50mi | 3/1.5 | 1,188 (-4%) | 11mo | $129,900 | $109 | 59 |
| 11826 Old Spanish Trl | 0.35mi | 3/2.0 | 1,374 (+11%) | 10mo | $269,999 | $197 | 58 |
| 12019 21st St | 0.44mi | 3/2.0 | 1,365 (+10%) | 9mo | $260,000 | $190 | 56 |
| 11909 22nd St | 0.43mi | 2/1.0 (-1) | 1,100 (-11%) | 6mo | $219,900 | $200 | 47 |
| 11902 23rd St | 0.46mi | 3/2.0 | 1,425 (+15%) | 13mo | $229,500 | $161 | 44 |
| 11838 23rd St | 0.45mi | 3/2.0 | 1,054 (-15%) | 14mo | $149,900 | $142 | 42 |
| 12222 24th St | 0.74mi | 2/1.0 (-1) | 1,056 (-15%) | 8mo | $125,000 | $118 | 25 |
Match score weights: distance 35% · size 25% · config 20% · recency 20%. Top-matched comps best support the ARV.
Projected returns pro-forma
-3.0% appreciation · 3.0% rent growth · sell at horizon
- IRR
- 99.0%
- Equity multiple
- 5.62×
- Total profit
- $278,339
- Equity at exit
- $32,057
- IRR
- —
- Equity multiple
- 11.73×
- Total profit
- $646,211
- Equity at exit
- $18,589
Cash invested: $60,200 (down + closing). Projections, not guarantees.
Landlord ↔ Tenant lean methodology
- Overall (STATE)
- 87 Strongly Landlord-Friendly
- State Texas
- 87 Strongly Landlord-Friendly · R+5
- County
- — inherits STATE
- City
- — inherits STATE
ZIP-level market 77510
- Home prices YoY
- -15.3%
- Active inventory
- 233
- Price-to-rent
- 2.2×
Monthly cashflow live
- Estimated rent
- $8,268 medium interval (Pro) →
- Mortgage (P&I)
- −$1,127
- Tax from tax record
- −$401 /mo · $4,809/yr
- Insurance
- −$90
- HOA
- −$0
- Vacancy / Maint / Mgmt
- −$1,736
- Net cashflow
- $4,914
Break-even live
UW: 25.0% down · 7.5% · 30yr · 1.5% tax · 5.0% vac · 8.0% maint · 8.0% mgmt
Financing live
Cash to close
- Down payment
- $53,750
- Closing costs
- $6,450
- Reserves months
- —
- Total cash needed
- —
Loan-product check · same deal, 3 products live
Conventional
25% down · 7.5% · 30yr
- Down + closing
- —
- Monthly P&I
- —
- Monthly cashflow
- —
- DSCR
- —
- Eligible?
- —
Personal DTI + credit; lowest rate.
DSCR
20% down · 8.5% · 30yr
- Down + closing
- —
- Monthly P&I
- —
- Monthly cashflow
- —
- DSCR
- —
- Eligible?
- —
No personal income docs; deal must DSCR.
Hard money
10% down · 12.0% · 12mo
- Down + closing
- —
- Monthly P&I
- —
- Monthly cashflow
- —
- DSCR
- —
- Eligible?
- —
Short-term bridge; refi at stabilization.
Rent comps 2 comps
| Address | Beds | Baths | Sqft | Rent | $/sqft | DOM | Units | Dist |
|---|---|---|---|---|---|---|---|---|
| 11844 13th St Santa Fe, TX | 3.0 | 2.0 | 1472 | $1,750 | $1.19 | 21d | 1 | 0.07mi |
| 4120 Avenue O #10 Santa Fe, TX | 3.0 | 2.0 | 1280 | $74,621 | $58.30 | 43d | 1 | 1.17mi |
Listing history 21 events
-
2026-06-18days on market $215,000 Active 41 DOM
-
2026-06-17days on market $215,000 Active 40 DOM
-
2026-06-16days on market $215,000 Active 39 DOM
-
2026-06-15days on market $215,000 Active 38 DOM
-
2026-06-13days on market $215,000 Active 36 DOM
-
2026-06-09days on market $215,000 Active 32 DOM
-
2026-06-08days on market $215,000 Active 31 DOM
-
2026-06-07days on market $215,000 Active 30 DOM
-
2026-06-04days on market $215,000 Active 27 DOM
-
2026-06-03days on market $215,000 Active 26 DOM
-
2026-06-02days on market $215,000 Active 25 DOM
-
2026-06-01days on market $215,000 Active 24 DOM
-
2026-05-31days on market $215,000 Active 23 DOM
-
2026-05-08$215,000 Active 788-char remark
-
2026-04-16historical $1,800
-
2026-04-04$1,800
-
2018-06-04soldstatus Sold 207-char remark
Show marketing remark (207 chars)
Three bedroom, two full bath brick home on a slab. City water and sewer. Solid surface flooring. Kitchen with open dining area. Fully fenced back yard. Storage building in back. Ready for immediate occupancy
-
2018-06-04soldstatus
Show marketing remark (207 chars)
Three bedroom, two full bath brick home on a slab. City water and sewer. Solid surface flooring. Kitchen with open dining area. Fully fenced back yard. Storage building in back. Ready for immediate occupancy
-
2018-06-04status Pending 207-char remark
Show marketing remark (207 chars)
Three bedroom, two full bath brick home on a slab. City water and sewer. Solid surface flooring. Kitchen with open dining area. Fully fenced back yard. Storage building in back. Ready for immediate occupancy
-
2018-05-24status Option Pending 207-char remark
Show marketing remark (207 chars)
Three bedroom, two full bath brick home on a slab. City water and sewer. Solid surface flooring. Kitchen with open dining area. Fully fenced back yard. Storage building in back. Ready for immediate occupancy
-
2018-05-21$139,900 Active 207-char remark
Show marketing remark (207 chars)
Three bedroom, two full bath brick home on a slab. City water and sewer. Solid surface flooring. Kitchen with open dining area. Fully fenced back yard. Storage building in back. Ready for immediate occupancy
ⓘ Source: listings_history table (triggers on properties + properties_extension) + one-shot
backfill from property_details.listing_events for pre-trigger history.
Tax reassessment forecast TX · Resets to sale price
- Current annual tax
- $4,809 · $401/mo
- Projected year-2 tax
- $4,809 · $401/mo
- Expected delta
- $0/yr ($0/mo · 0.0%)
ⓘ Screening estimate from a state-policy table — verify with the county assessor before closing.
Climate risk First Street
- Flood 6/10 Major FEMA zone X (shaded) · 74% chance over 30 yrs
- Wildfire 3/10 Moderate
- Heat 10/10 Extreme 7 d/yr ≥110°F today · 26 d/yr by 30 yrs out
- Wind 9/10 Extreme 99% chance of damaging wind over 30 yrs
- Air quality 2/10 Low 1 unhealthy d/yr today · 1 by 30 yrs out
Nearby sold comps map
Loading sold comps map…
Walkable amenities ~0.75 mi
Loading nearby amenities…
Taxation est. · year 1
- Rental income
- $99,217
- − Mortgage interest
- −$12,043
- − Property taxes
- −$4,809
- − Insurance
- −$1,075
- − Repairs & maintenance
- −$7,937
- − Management
- −$7,937
- − Depreciation
- −$6,255
- Taxable income
- $59,160
- Est. tax owed @ 24.0%
- −$14,198
- After-tax cash flow
- $44,769/yr
For passive investors: Depreciation is non-cash, so a rental often shows a tax loss while cash-flowing — sheltering income. Rental losses are passive: they offset passive income freely, and up to $25,000/yr can offset ordinary (W-2) income if you actively participate and your MAGI is under $100k (phasing out to $0 by $150k); unused losses carry forward. On sale, claimed depreciation is recaptured at up to 25%, and gains may owe capital-gains tax (a 1031 exchange can defer both). Figures are a year-1 estimate at your 24.0% rate — not tax advice; consult a CPA.
Schools (NCES district)
- District
- Santa Fe ISD
- NCES district ID
- 4839270
- Math proficiency
- 38% ▼ -10.00%
- Reading proficiency
- 39% ▼ -2.00%
- Median HH income
- $66,769
- Composite
- 34.86/100
- National rank
- #5091
- State rank
- #385 of 826 in TX
Livability — Santa Fe
- Score
- 67/100
- State rank
- #550
- US rank
- #10637
Category grades
Schools grade is shown separately in the Schools card above.
Census & demographics
- Census place
- Santa Fe, TX
- Population (ZIP)
- 13,938
Population outlook (Galveston County) Hauer SSP2
- Today (2025)
- 390,640 people
- By 2030
- 425,226 · +8.9%
- By 2040
- 493,765 · +26.4%
- By 2050
- 559,698 · +43.3%
- By 2075
- 719,260 · +84.1%
- By 2100
- 819,628 · +109.8%
Race, ethnicity, and origin ACS 2023
- Neighborhood character
- Predominantly White (72%)
- Race & ethnicity
- White 72% Hispanic / Latino 21% Two or more races 17% Asian 2%
- Hispanic origin (detail)
- Mexican 14% Puerto Rican 3% Cuban 1%
- Common ancestry
- Lithuanian 4% Italian 3% Slovak 1%
- Foreign-born
- 5% · Canada
- Languages at home
- 89% English-only · Spanish 10% Tagalog/Filipino 1%
Political lean MEDSL · Galveston
- 2024 margin
- Strong R (+27.4) · D 35.7% · R 63.1% · Other 1.2%
- 2008→2024 swing
- -7.9pp toward R · 2008: -19.5pp · 2024: -27.4pp
- All cycles
- 2024: R+27.4 2020: R+22.6 2016: R+22.6 2012: R+26.9 2008: R+19.5
Not yet ingested
- Civics
- —
Market trends
- HPI YoY
- ▼ -54.15%
- Current HPI
- 299.2228
- Rent YoY
- —
- Metro
- —
- State GDP YoY
- ▲ 3.95%
- F500 in state
- 110
Industry mix (Fortune 500 HQ in TX)
| Industry | F500 HQs | Revenue |
|---|---|---|
| Energy | 16 | $1,198B |
|
||
| Technology | 5 | $198B |
|
||
| Engineering / Construction | 4 | $72B |
|
||
| Energy Services | 3 | $60B |
|
||
| Utilities | 3 | $41B |
|
||
| Healthcare | 2 | $330B |
|
||
Price history
+53.7% since first listed8 events — show timeline
- 2026-05-08 Listed $215,000 HARMLS
- 2026-04-16 Rental Removed $1,800 HARMLS
- 2026-04-04 Listed for Rent $1,800 HARMLS
- 2018-06-04 Sold (Public Records) — Public Records
- 2018-06-04 Sold (MLS) — HARMLS
- 2018-06-04 Pending — HARMLS
- 2018-05-24 Pending — HARMLS
- 2018-05-21 Listed $139,900 HARMLS
Property tax history
+6.1%/yrLatest (2025): $4,809 · +16.7% YoY. Source: county tax records.
Cash-flow waterfall
monthlySold comps — $/sqft
last 12 mo · ≤1 miLoading sold comps…