 🏗️ New Construction
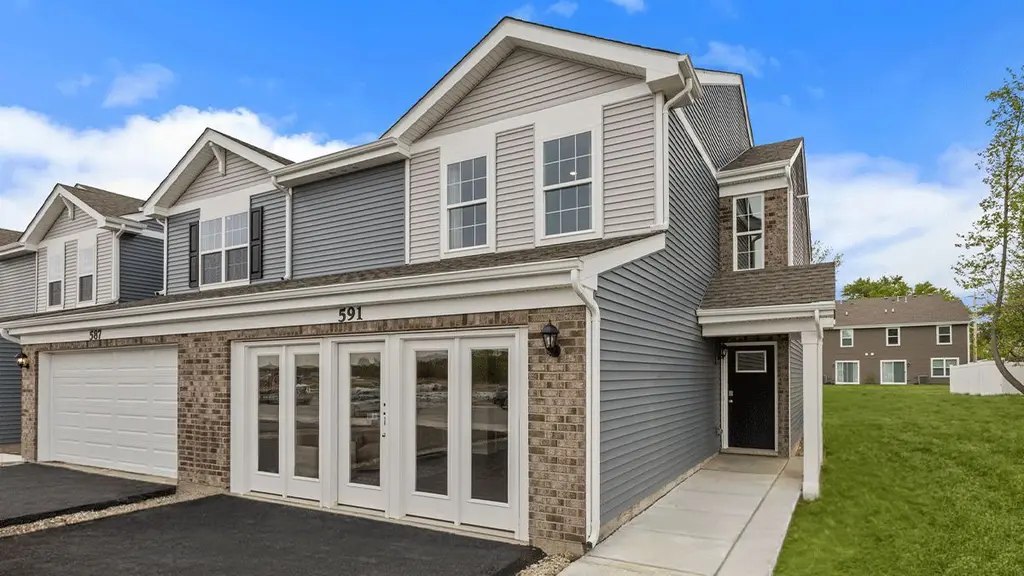
PRESTON Plan · Hobart, IN
Flood risk 1/10 · Minimal
- FEMA flood zone
- X (unshaded)
- Chance of flooding over 30 yrs
- 0.0%
- Est. flood insurance / yr
- $507 – $1,088
Fire risk 4/10 · Minor
- Est. fire insurance / yr
- $717 – $1,331
Heat risk 2/10 · Minimal
- Hot days now (above 102°F)
- 7 days/yr
- Hot days in 30 yrs
- 15 days/yr
Wind risk 2/10 · Minimal
- Chance of severe wind over 30 yrs
- 0.0%
Air-quality risk 3/10 · Minor
- Unhealthy air days now
- 2 days/yr
- Unhealthy air days in 30 yrs
- 3 days/yr
Risk factors via First Street. Map © Google.
Why this score? — see what drove the D- grade
The composite is a weighted blend of 9 inputs, each scored 0–100. Each bar is that input's sub-score; the figure is the points it added to the 100-point composite (weight × sub-score).
- Cash flow +10.2/30.0
- ARV discount +7.5/15.0
- Condition / age +4.0/5.0
- Rent growth +3.9/5.0
- Livability +3.5/5.0
- Schools +3.3/10.0
- 1% rule +3.0/10.0
- DSCR +2.9/10.0
- Appreciation +0.0/10.0
$249,990
🖨 Deal sheet 📄 Offer letter ✓ Due diligence
Listing remarks
Welcome home to the Preston floor plan, located in Hobart, Indiana in our Cressmoor Estates Townhome community. The Preston is a 2-story home featuring 3-bedrooms, 2.5-bathrooms, and 1,601 square feet of living space. As you enter from the covered front porch you will be welcomed by the dining room that overlooks the kitchen and great room area. The kitchen features classic cabinetry, stainless steel appliances, a pantry, and an island perfect for food prepping. The kitchen island overlooks the great room, allowing for a variety of set-ups and ample seating for your entertaining needs. An open loft space sits at the top of the stairs, providing additional space for a second living area, gam
Key facts
- Covered front porch
- Laundry room
- Walk-in closet
Tags
Property features AI
Finance
- Other: Address shown as PRESTON Plan, Hobart, IN 46342; Listing status: Active
- Financial info: List price $249,990
Exterior
- Parking: 2 garage spaces (2 total parking spaces)
- Home design: Single-family plan (PRESTON); Located in Hobart, IN
- Exterior features: Living area of 1,601 (listed living area)
Interior
- Bedrooms: 3 bedrooms
- Bathrooms: 2 full bathrooms and 1 half bathroom
- Interior features: Plan: PRESTON (new construction plan)
Neighborhood map
What this means for you Summary
Snapshot
- This is a 3-bed/2.5-bath townhouse listed at $250k. Condition is rated good.
Deal economics
- At list price, monthly cash flow is $-149 ($-2k/yr) — negative.
- To cash-flow at today's rent, offer at most $241k (3.6% below list).
- To meet the 1% rule (rent ≥ 1% of price), the offer needs to be $211k (15.6% below list).
- Recommended offer: $211k (15.6% below list) — sets the bar for 1% rule.
- Cap rate 5.6% vs local median 4.2% in Hobart — top-decile yield for the area; either an underpriced asset or a hidden risk that comps aren't pricing in. Stress-test before assuming the spread holds.
Location & tenants
- Location reads 69/100 on livability (#196 in IN) — a middle-class / working-renter tenant base. Strengths: cost of living A+, housing A+, crime B; Watch: schools D, amenities F, commute F.
- School City Of Hobart (suburban): math 30% / reading 45% proficiency, ranked #161 of 301 in IN (top 54%) — families likely to look elsewhere, expect single-tenant / working-renter base with shorter leases.
- Market conditions: Rents rising fast (+5.6%/yr); 255 active listings in the ZIP; 5 comparable units currently listed for rent nearby; rentals leasing fast (median 1d on market — plan ~1-2 weeks tenant-placement turnaround); solid renter incomes; 1,642 units permitted in Lake County in 2024 (14 in 5+ unit buildings).
- This rent runs 34% of the median local income ($76k/yr) — at the standard rent-burdened threshold; future hikes will face affordability resistance.
Forward outlook
- Local home prices are declining (-3.0%/yr); year-one equity from $2k of loan paydown is wiped out by about $8k of value loss. Plan a longer hold.
- Lake County population projected to shrink 7% by 2050 — rents likely to lag national; underwrite the cash flow, not the appreciation.
Negotiation context
- It's been on market 86 days — a 6% lower offer ($235k) is reasonable based on typical stale-listing flexibility.
Questions for the listing agent
- What do current leases actually rent for vs. the listed asking? Can we see a recent rent roll and the last 12 months of T-12 income?
- It's been on market 86 days. Have you received any prior offers? Is the seller open to a 16% concession, seller financing, or rate buy-down credit?
- Why hasn't it sold? Are there any deal-killer items the seller is aware of (foundation, flood, title, zoning, code violations)?
- Is there a deadline driving the sale (1031 exchange, divorce, estate, relocation)? That informs how much negotiation room exists.
- Schools are D-rated, which usually means shorter tenancies and higher turnover. Who's the typical renter profile here, and what's been the actual vacancy rate?
- The area grade is low — what's the realistic commute time and amenity access for the typical tenant pool here? Any planned neighborhood developments (good or bad) we should know about?
- What's the average days-on-market for RENTAL listings here right now (not sales)? A rising rental-DOM trend means longer vacancies and softer asking-rent achievability than the comps imply.
- What's the recent tenant-quality profile in this submarket — average credit score on applications, eviction rate, late-payment / NSF rate, and stable-employment percentage? A property-management company in the area should have these aggregated.
- How much new for-sale + rental construction is in the pipeline within 1–3 miles? Heavy new supply typically softens prices + rents 12–24 months out; constrained supply supports both.
Investment metrics
- 1% rule
- 0.80% ✗
- Cap rate
- 5.61%
- Cash-on-cash
- -2.43%
- DSCR
- 0.89
- GRM
- 10.4
CMA / ARV
- ARV (on-the-fly)
- $262,564
- Comps found
- 8
Show comp detail 8 sales within ~0.75 mi
| Address | Dist | Beds/Ba | Sqft | Sold | Price | $/sf | Match |
|---|---|---|---|---|---|---|---|
| 557 Cressmoor Blvd | 0.04mi | 3/2.5 | 1,601 (0%) | 1mo | $250,740 | $157 | 98 |
| 549 Cressmoor Blvd | 0.24mi | 3/2.5 | 1,601 (0%) | 1mo | $262,990 | $164 | 88 |
| 581 Cressmoor Blvd | 0.24mi | 3/2.5 | 1,601 (0%) | 1mo | $259,990 | $162 | 88 |
| 535 Cressmoor Blvd | 0.24mi | 3/2.5 | 1,601 (0%) | 1mo | $249,990 | $156 | 88 |
| 583 Cressmoor Blvd | 0.24mi | 3/2.5 | 1,601 (0%) | 1mo | $259,990 | $162 | 88 |
| 191 Aviana Ave | 0.34mi | 3/2.5 | 1,601 (0%) | 22mo | $269,990 | $169 | 66 |
| 259 Fox Trail Ct | 0.65mi | 3/1.5 | 1,448 (-10%) | 2mo | $247,000 | $171 | 48 |
| 349 Fox Trail Ct | 0.69mi | 3/2.0 | 1,385 (-14%) | 1mo | $245,000 | $177 | 42 |
Match score weights: distance 35% · size 25% · config 20% · recency 20%. Top-matched comps best support the ARV.
Projected returns pro-forma
-3.0% appreciation · 5.63% rent growth · sell at horizon
- IRR
- -17.4%
- Equity multiple
- 0.37×
- Total profit
- $-46,257
- Equity at exit
- $39,149
- IRR
- -5.2%
- Equity multiple
- 0.63×
- Total profit
- $-27,542
- Equity at exit
- $22,702
Cash invested: $73,518 (down + closing). Projections, not guarantees.
Landlord ↔ Tenant lean methodology
- Overall (STATE)
- 90 Strongly Landlord-Friendly
- State Indiana
- 90 Strongly Landlord-Friendly · R+11
- County
- — inherits STATE
- City
- — inherits STATE
ZIP-level market 46342
- Rents YoY
- 5.6%
- Active inventory
- 255
- Price-to-rent
- 9.9×
Monthly cashflow live
- Estimated rent
- $2,109 high interval (Pro) →
- Mortgage (P&I)
- −$1,377
- Tax est. 1.5%
- −$328 /mo · $3,938/yr
- Insurance
- −$109
- HOA
- −$0
- Vacancy / Maint / Mgmt
- −$443
- Net cashflow
- $-149
Break-even live
UW: 25.0% down · 7.5% · 30yr · 1.5% tax · 5.0% vac · 8.0% maint · 8.0% mgmt
Financing live
Cash to close
- Down payment
- $65,641
- Closing costs
- $7,877
- Reserves months
- —
- Total cash needed
- —
Loan-product check · same deal, 3 products live
Conventional
25% down · 7.5% · 30yr
- Down + closing
- —
- Monthly P&I
- —
- Monthly cashflow
- —
- DSCR
- —
- Eligible?
- —
Personal DTI + credit; lowest rate.
DSCR
20% down · 8.5% · 30yr
- Down + closing
- —
- Monthly P&I
- —
- Monthly cashflow
- —
- DSCR
- —
- Eligible?
- —
No personal income docs; deal must DSCR.
Hard money
10% down · 12.0% · 12mo
- Down + closing
- —
- Monthly P&I
- —
- Monthly cashflow
- —
- DSCR
- —
- Eligible?
- —
Short-term bridge; refi at stabilization.
Rent comps 5 comps
| Address | Beds | Baths | Sqft | Rent | $/sqft | DOM | Units | Dist |
|---|---|---|---|---|---|---|---|---|
| 600 W 39th Pl Hobart, IN | 3.0 | 3.0 | 1601 | $2,615 | $1.63 | 1d | 1 | 0.03mi |
| 123 Arthur Ave Hobart, IN | 2.0 | 1.0 | 1565 | $1,500 | $0.96 | 1d | 1 | 0.55mi |
| 333 Neringa Ln Hobart, IN | 1.0–3.0 | 1.0–2.0 | 1009 | $1,780 | $1.76 | 1d | 11 | 0.69mi |
| 416 Van Buren Ave Hobart, IN | 3.0 | 1.0 | 1085 | $1,395 | $1.29 | 1d | 1 | 0.98mi |
| 3753 Englehart St Lake Station, IN | 3.0 | 1.0 | 1224 | $1,450 | $1.18 | 1d | 1 | 1.18mi |
Listing history 14 events
-
2026-06-18days on market $249,990 Active 86 DOM
-
2026-06-17days on market $249,990 Active 85 DOM
-
2026-06-16days on market $249,990 Active 84 DOM
-
2026-06-15days on market $249,990 Active 83 DOM
-
2026-06-13days on market $249,990 Active 81 DOM
-
2026-06-13days on market $249,990 Active 80 DOM
-
2026-06-09days on market $249,990 Active 77 DOM
-
2026-06-08days on market $249,990 Active 76 DOM
-
2026-06-07days on market $249,990 Active 75 DOM
-
2026-06-04days on market $249,990 Active 72 DOM
-
2026-06-03days on market $249,990 Active 71 DOM
-
2026-06-02days on market $249,990 Active 70 DOM
-
2026-06-01days on market $249,990 Active 69 DOM
-
2026-05-31days on market $249,990 Active 68 DOM
ⓘ Source: listings_history table (triggers on properties + properties_extension) + one-shot
backfill from property_details.listing_events for pre-trigger history.
Climate risk First Street
- Flood 1/10 Low FEMA zone X (unshaded) · 0% chance over 30 yrs
- Wildfire 4/10 Moderate
- Heat 2/10 Low 7 d/yr ≥102°F today · 15 d/yr by 30 yrs out
- Wind 2/10 Low 0% chance of damaging wind over 30 yrs
- Air quality 3/10 Moderate 2 unhealthy d/yr today · 3 by 30 yrs out
Nearby sold comps map
Loading sold comps map…
Walkable amenities ~0.75 mi
Loading nearby amenities…
Taxation est. · year 1
- Rental income
- $25,304
- − Mortgage interest
- −$14,708
- − Property taxes
- −$3,938
- − Insurance
- −$1,313
- − Repairs & maintenance
- −$2,024
- − Management
- −$2,024
- − Depreciation
- −$7,638
- Taxable loss
- −$6,342
- Est. tax savings @ 24.0%
- +$1,522
- After-tax cash flow
- $-262/yr
For passive investors: Depreciation is non-cash, so a rental often shows a tax loss while cash-flowing — sheltering income. Rental losses are passive: they offset passive income freely, and up to $25,000/yr can offset ordinary (W-2) income if you actively participate and your MAGI is under $100k (phasing out to $0 by $150k); unused losses carry forward. On sale, claimed depreciation is recaptured at up to 25%, and gains may owe capital-gains tax (a 1031 exchange can defer both). Figures are a year-1 estimate at your 24.0% rate — not tax advice; consult a CPA.
Condition & rehab AI · 13 photos
This well-maintained Preston floor plan townhouse in Hobart, Indiana is move-in ready with a good condition score and minimal repairs needed. Potential buyers and tenants can appreciate the modern kitchen, bathrooms, and curb appeal, with opportunities for further value-adding improvements.
Value-add opportunities
- Both Painting the exterior and interior walls — Fresh paint can enhance curb appeal and interior aesthetics.
- Both Landscaping improvements — Enhanced landscaping can improve curb appeal and attract potential buyers/tenants.
- Both Adding smart home features — Smart home features can increase convenience and appeal to tech-savvy buyers/tenants.
- Both Upgrading appliances — Modern appliances can make the home more appealing and functional for potential buyers/tenants.
Renovation cost estimate screening
Value-add ROI direction
- Both Painting the exterior and interior walls — Fresh paint can enhance curb appeal and interior aesthetics. ↑
- Both Landscaping improvements — Enhanced landscaping can improve curb appeal and attract potential buyers/tenants. ↑
- Both Adding smart home features — Smart home features can increase convenience and appeal to tech-savvy buyers/tenants. ↑
- Both Upgrading appliances — Modern appliances can make the home more appealing and functional for potential buyers/tenants. ↑
ⓘ Cost ranges are severity-bucket heuristics (US national rule-of-thumb). Get contractor quotes + a written scope before underwriting a rehab budget.
Schools (NCES district)
- District
- School City Of Hobart
- NCES district ID
- 1804590
- Math proficiency
- 30% ▼ -14.00%
- Reading proficiency
- 45% ▼ -7.00%
- Median HH income
- $55,967
- Composite
- 32.93/100
- National rank
- #5594
- State rank
- #161 of 301 in IN
Livability — Hobart
- Score
- 69/100
- State rank
- #196
- US rank
- #8834
Category grades
Schools grade is shown separately in the Schools card above.
Census & demographics
- Census place
- Hobart, IN
- County
- Lake County · 422,878 people
- City population
- 32,224
- Metro
- Chicago-Naperville-Elgin, IL-IN-WI
- Population (ZIP)
- 32,224
- Household income
- $75,521
- Rent vs Own
- Severe rent burden
- 1033.0
Population outlook (Lake County) Hauer SSP2
- Today (2025)
- 484,026 people
- By 2030
- 478,091 · -1.2%
- By 2040
- 462,974 · -4.3%
- By 2050
- 449,894 · -7.1%
- By 2075
- 436,169 · -9.9%
- By 2100
- 426,607 · -11.9%
Race, ethnicity, and origin ACS 2023
- Neighborhood character
- Predominantly White (66%)
- Race & ethnicity
- White 66% Hispanic / Latino 21% Two or more races 10% Black 10% Asian 1%
- Hispanic origin (detail)
- Mexican 15% Puerto Rican 5%
- Common ancestry
- Romanian 11% Iranian 2% Lithuanian 1%
- Foreign-born
- 5% · Canada, China
- Languages at home
- 87% English-only · Spanish 9% Russian/Polish/Slavic 2% Chinese 1%
Political lean MEDSL · Lake
- 2024 margin
- Lean D (+5.6) · D 52.1% · R 46.5% · Other 1.5%
- 2008→2024 swing
- -28.6pp toward R · 2008: 34.3pp · 2024: 5.6pp
- All cycles
- 2024: D+5.6 2020: D+15.1 2016: D+20.6 2012: D+31.0 2008: D+34.3
Not yet ingested
- Civics
- —
Market trends
- HPI YoY
- ▼ -167.01%
- Current HPI
- 260.2635
- Rent YoY
- ▲ 5.63%
- Metro
- Chicago-Naperville-Elgin, IL-IN-WI
- State GDP YoY
- ▲ 2.90%
- F500 in state
- 18
Industry mix (Fortune 500 HQ in IN)
| Industry | F500 HQs | Revenue |
|---|---|---|
| Industrial Machinery | 2 | $37B |
|
||
| Healthcare | 1 | $177B |
|
||
| Pharmaceuticals | 1 | $45B |
|
||
| Metals / Steel | 1 | $18B |
|
||
| Agriculture | 1 | $17B |
|
||
| Packaging | 1 | $12B |
|
||
Cash-flow waterfall
monthlySold comps — $/sqft
last 12 mo · ≤1 miLoading sold comps…