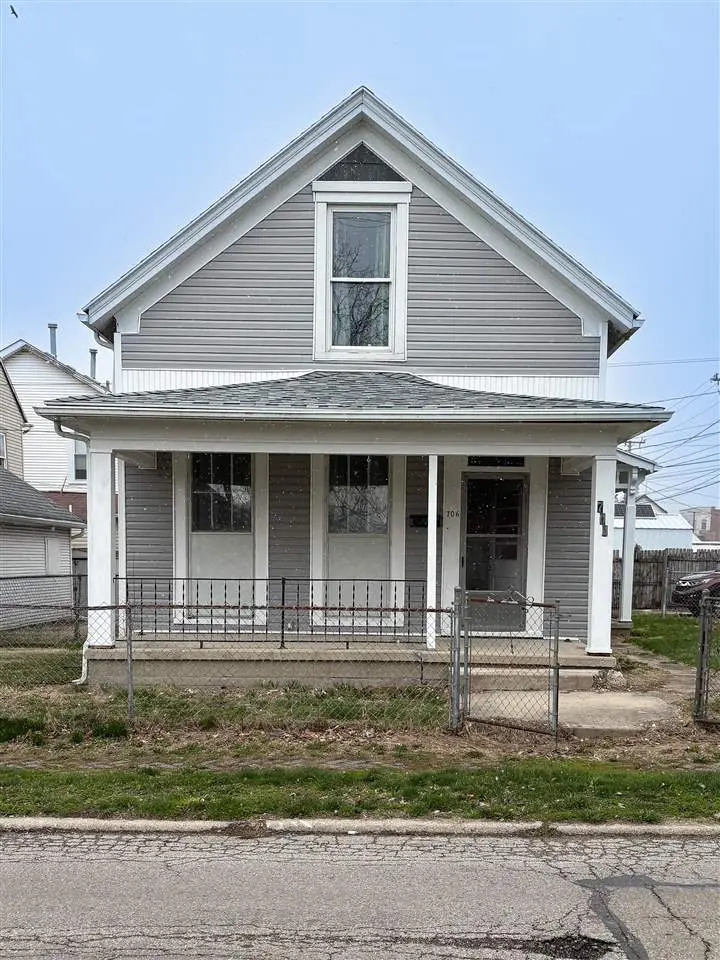
706 S B St · Richmond, IN
Flood risk 1/10 · Minimal
- FEMA flood zone
- X (unshaded)
- Chance of flooding over 30 yrs
- 0.0%
- Est. flood insurance / yr
- $507 – $1,088
Fire risk 1/10 · Minimal
- Est. fire insurance / yr
- $717 – $1,331
Heat risk 3/10 · Minor
- Hot days now (above 100°F)
- 7 days/yr
- Hot days in 30 yrs
- 18 days/yr
Wind risk 2/10 · Minimal
- Chance of severe wind over 30 yrs
- 1.0%
Air-quality risk 3/10 · Minor
- Unhealthy air days now
- 2 days/yr
- Unhealthy air days in 30 yrs
- 3 days/yr
Risk factors via First Street. Map © Google.
Why this score? — see what drove the C grade
The composite is a weighted blend of 9 inputs, each scored 0–100. Each bar is that input's sub-score; the figure is the points it added to the 100-point composite (weight × sub-score).
- Cash flow +25.2/30.0
- ARV discount +8.8/15.0
- DSCR +8.3/10.0
- 1% rule +5.5/10.0
- Livability +4.2/5.0
- Rent growth +2.5/5.0
- Condition / age +2.5/5.0
- Schools +1.9/10.0
- Appreciation +0.0/10.0
$89,900
🖨 Deal sheet 📄 Offer letter ✓ Due diligence
Listing remarks MLS
Super affordable with large rooms, Great first time owner, or investment property. Covered front porch, nice sized living room with large windows, formal dining room, with a office or sitting room. 2 large bedrooms up, Large eat in kitchen. Mud room/Laundry. Off street parking and fenced yard. Newer Roof and Furnace C/A. Own for cheaper than renting, With your personal touches this will make a great home. Call or text Tim at 765-914-0994 for all the details.
Key facts
- Main-level bedroom
- Front porch
- Shed out back
Tags
Property features AI
Exterior
- Utilities: Public water; Public sewer
- Home design: Single family residence; 1 story; Residential zoning
- Construction: Vinyl siding; Slab foundation
- Exterior features: Chain link fence; Shingle roof
Interior
- Kitchen: Electric range; Refrigerator
- Bathrooms: 1 full bathroom
- Heating & cooling: Forced air heating (natural gas); Central air conditioning
- Interior features: Electric range; Refrigerator; Electric water heater; Crawl space basement
- Laundry & utility: Electric water heater
Neighborhood map
What this means for you Summary
Snapshot
- This is a 2-bed/1.0-bath single-family listed at $90k.
Deal economics
- At list price, monthly cash flow is $202 ($2k/yr) — positive.
- The deal already cash-flows at list — no discount required.
- Meets the 1% rule at list price ($942 rent vs $90k).
- Recommended offer: $89k (1.5% below list) — sets the bar for market timing.
- Cap rate 9.0% vs local median 5.2% in Richmond — top-decile yield for the area; either an underpriced asset or a hidden risk that comps aren't pricing in. Stress-test before assuming the spread holds.
Location & tenants
- Location reads 83/100 on livability (#10 in IN, #869 nationally) — a professional / high-income tenant draw. Strengths: commute A+, cost of living A+, housing A+; Watch: crime D+, employment D-.
- Richmond Community Schools (town): math 18% / reading 27% proficiency, ranked #270 of 301 in IN (top 90%) — low school quality limits family demand, transient renter base, plan for 1-2y turnover; 65% free/reduced lunch — lower-income household profile, screen leases tightly.
- Zoned schools: Charles Elementary School (math 62% / reading 47%, grade C, #197 of 994 statewide, top 22%, 331 students, 59% FRL); Richmond High School (math 21% / reading 48%, grade F, #270 of 369 statewide, top 77%, 1,332 students, 66% FRL) — zoned schools at 62% FRL track the district average.
- Zoned-school proficiency averages 44% at this address vs 22% district-wide (+22 pts) — the actual schools serving this property are materially stronger than the Richmond Community Schools average implies; a family-tenant draw the district grade alone would hide.
- Market conditions: 273 active listings in the ZIP; 4 comparable units currently listed for rent nearby; rentals lingering (median 44d on market — plan ~5-8 weeks vacancy on turnover, expect pricing pressure); 100% of comp listings sitting > 30 days — soft ceiling on asking rent; 38 units permitted in Wayne County in 2024 (0 in 5+ unit buildings).
Forward outlook
- Local home prices are declining (-3.0%/yr); year-one equity from $622 of loan paydown is wiped out by about $3k of value loss. Plan a longer hold.
- Wayne County population projected at -21% by 2050 — secular population decline; favor cash flow + early exit over multi-decade hold.
Negotiation context
- It's been on market 21 days — a 2% lower offer ($89k) is reasonable based on typical stale-listing flexibility.
- 2 sale attempts; this cycle's ask has dropped $30k (25%) from the opening price — seller is motivated, your offer sets the floor, not the list.
- Current owner paid $39k; list at $90k implies a 131% gain — meaningful room to come down on a strong offer.
Risks & watch-outs
- Watch-outs: built in 1910 — expect roof / HVAC / electrical / plumbing capex.
Questions for the listing agent
- Built in 1910 — when were the roof, HVAC, electrical panel, plumbing, and water heater last replaced?
- Is there a deadline driving the sale (1031 exchange, divorce, estate, relocation)? That informs how much negotiation room exists.
- Schools are D-rated, which usually means shorter tenancies and higher turnover. Who's the typical renter profile here, and what's been the actual vacancy rate?
- Crime grade is D in this area — have there been break-ins, vandalism, or insurance claims at this property in the last 3 years? What carrier currently insures it and at what premium?
- What's the average days-on-market for RENTAL listings here right now (not sales)? A rising rental-DOM trend means longer vacancies and softer asking-rent achievability than the comps imply.
- What's the recent tenant-quality profile in this submarket — average credit score on applications, eviction rate, late-payment / NSF rate, and stable-employment percentage? A property-management company in the area should have these aggregated.
- How much new for-sale + rental construction is in the pipeline within 1–3 miles? Heavy new supply typically softens prices + rents 12–24 months out; constrained supply supports both.
Investment metrics
- 1% rule
- 1.05% ✓
- Cap rate
- 8.99%
- Cash-on-cash
- 9.64%
- DSCR
- 1.43
- GRM
- 8.0
CMA / ARV
- ARV (on-the-fly)
- $92,529
- Comps found
- 12
Show comp detail 12 sales within ~0.75 mi
| Address | Dist | Beds/Ba | Sqft | Sold | Price | $/sf | Match |
|---|---|---|---|---|---|---|---|
| 417 S 14th St | 0.55mi | 2/1.5 | 1,336 (-0%) | 4mo | $43,000 | $32 | 68 |
| 623 S 9th St | 0.45mi | 2/1.0 | 1,382 (+3%) | 9mo | $47,000 | $34 | 67 |
| 117 S 15th St | 0.58mi | 2/2.0 | 1,380 (+3%) | 2mo | $79,900 | $58 | 63 |
| 42 S 16th St | 0.63mi | 2/1.0 | 1,316 (-2%) | 6mo | $11,000 | $8 | 62 |
| 432 S 15th St | 0.61mi | 3/1.5 (+1) | 1,344 (+0%) | 5mo | $140,900 | $105 | 60 |
| 431 S 13th St | 0.49mi | 2/1.5 | 1,400 (+4%) | 10mo | $98,000 | $70 | 60 |
| 529 S 13th St | 0.56mi | 2/2.0 | 1,385 (+3%) | 11mo | $95,000 | $69 | 56 |
| 611 S 12th St | 0.54mi | 3/1.5 (+1) | 1,414 (+5%) | 9mo | $60,000 | $42 | 51 |
| 106 SW G St | 0.70mi | 3/1.0 (+1) | 1,260 (-6%) | 9mo | $177,000 | $140 | 45 |
| 106 N 16th St | 0.72mi | 3/1.0 (+1) | 1,252 (-7%) | 11mo | $60,000 | $48 | 41 |
| 518 S 15th St | 0.65mi | 3/1.5 (+1) | 1,514 (+13%) | 9mo | $170,000 | $112 | 33 |
| 735 S 13th St | 0.68mi | 3/2.0 (+1) | 1,485 (+11%) | 10mo | $119,900 | $81 | 33 |
Match score weights: distance 35% · size 25% · config 20% · recency 20%. Top-matched comps best support the ARV.
Projected returns pro-forma
-3.0% appreciation · 3.0% rent growth · sell at horizon
- IRR
- -1.8%
- Equity multiple
- 0.93×
- Total profit
- $-1,727
- Equity at exit
- $13,404
- IRR
- 7.8%
- Equity multiple
- 1.59×
- Total profit
- $14,934
- Equity at exit
- $7,773
Cash invested: $25,172 (down + closing). Projections, not guarantees.
Landlord ↔ Tenant lean methodology
- Overall (STATE)
- 90 Strongly Landlord-Friendly
- State Indiana
- 90 Strongly Landlord-Friendly · R+11
- County
- — inherits STATE
- City
- — inherits STATE
ZIP-level market 47374
- Active inventory
- 273
- Price-to-rent
- 8.0×
Monthly cashflow live
- Estimated rent
- $942 medium interval (Pro) →
- Mortgage (P&I)
- −$471
- Tax from tax record
- −$33 /mo · $396/yr
- Insurance
- −$37
- HOA
- −$0
- Vacancy / Maint / Mgmt
- −$198
- Net cashflow
- $202
Break-even live
UW: 25.0% down · 7.5% · 30yr · 1.5% tax · 5.0% vac · 8.0% maint · 8.0% mgmt
Financing live
Cash to close
- Down payment
- $22,475
- Closing costs
- $2,697
- Reserves months
- —
- Total cash needed
- —
Loan-product check · same deal, 3 products live
Conventional
25% down · 7.5% · 30yr
- Down + closing
- —
- Monthly P&I
- —
- Monthly cashflow
- —
- DSCR
- —
- Eligible?
- —
Personal DTI + credit; lowest rate.
DSCR
20% down · 8.5% · 30yr
- Down + closing
- —
- Monthly P&I
- —
- Monthly cashflow
- —
- DSCR
- —
- Eligible?
- —
No personal income docs; deal must DSCR.
Hard money
10% down · 12.0% · 12mo
- Down + closing
- —
- Monthly P&I
- —
- Monthly cashflow
- —
- DSCR
- —
- Eligible?
- —
Short-term bridge; refi at stabilization.
Rent comps 4 comps
| Address | Beds | Baths | Sqft | Rent | $/sqft | DOM | Units | Dist |
|---|---|---|---|---|---|---|---|---|
| 401 N 10th St Richmond, IN | 1.0–2.0 | 1.0 | 817 | $895 | $1.09 | 43d | 3 | 0.57mi |
| 1300 S 18th St Richmond, IN | 3.0 | 2.0 | 847 | $1,027 | $1.21 | 43d | 7 | 1.19mi |
| 1032 S 23rd St Richmond, IN | 1.0–2.0 | 1.0 | 937 | $790 | $0.84 | 43d | 4 | 1.27mi |
| 418 NW L St Richmond, IN | 3.0 | 1.0 | 1608 | $1,275 | $0.79 | 43d | 1 | 1.44mi |
Listing history 20 events
-
2026-06-17status $89,900 Pending 21 DOM
-
2026-06-16days on market $89,900 Active 21 DOM
-
2026-06-15days on market $89,900 Active 20 DOM
-
2026-06-14days on market $89,900 Active 18 DOM
-
2026-06-12days on market $89,900 Active 17 DOM
-
2026-06-09pricedays on market $89,900 Active 14 DOM
-
2026-06-08days on market $99,877 Active 13 DOM
-
2026-06-07days on market $99,877 Active 12 DOM
-
2026-06-03days on market $99,877 Active 8 DOM
-
2026-06-02days on market $99,877 Active 7 DOM
-
2026-06-01days on market $99,877 Active 6 DOM
-
2026-05-31days on market $99,877 Active 5 DOM
-
2026-05-30days on market $99,877 Active 4 DOM
-
2026-04-20price $99,877
-
2026-04-03price $109,877
-
2026-03-17$119,877 Active
-
2025-07-23soldstatus $39,000 Closed 462-char remark
Show marketing remark (462 chars)
Super affordable with large rooms, Great first time owner, or investment property. Covered front porch, nice sized living room with large windows, formal dining room, with a office or sitting room. 2 large bedrooms up, Large eat in kitchen. Mud room/Laundry. Off street parking and fenced yard. Newer Roof and Furnace C/A. Own for cheaper than renting, With your personal touches this will make a great home. Call or text Tim at 765-914-0994 for all the details.
-
2025-07-15status Pending 462-char remark
Show marketing remark (462 chars)
Super affordable with large rooms, Great first time owner, or investment property. Covered front porch, nice sized living room with large windows, formal dining room, with a office or sitting room. 2 large bedrooms up, Large eat in kitchen. Mud room/Laundry. Off street parking and fenced yard. Newer Roof and Furnace C/A. Own for cheaper than renting, With your personal touches this will make a great home. Call or text Tim at 765-914-0994 for all the details.
-
2025-07-02price $44,900 462-char remark
Show marketing remark (462 chars)
Super affordable with large rooms, Great first time owner, or investment property. Covered front porch, nice sized living room with large windows, formal dining room, with a office or sitting room. 2 large bedrooms up, Large eat in kitchen. Mud room/Laundry. Off street parking and fenced yard. Newer Roof and Furnace C/A. Own for cheaper than renting, With your personal touches this will make a great home. Call or text Tim at 765-914-0994 for all the details.
-
2025-06-12$56,900 Active 462-char remark
Show marketing remark (462 chars)
Super affordable with large rooms, Great first time owner, or investment property. Covered front porch, nice sized living room with large windows, formal dining room, with a office or sitting room. 2 large bedrooms up, Large eat in kitchen. Mud room/Laundry. Off street parking and fenced yard. Newer Roof and Furnace C/A. Own for cheaper than renting, With your personal touches this will make a great home. Call or text Tim at 765-914-0994 for all the details.
ⓘ Source: listings_history table (triggers on properties + properties_extension) + one-shot
backfill from property_details.listing_events for pre-trigger history.
Tax reassessment forecast IN · Partial reset (capped growth)
- Current annual tax
- $396 · $33/mo
- Projected year-2 tax
- $580 · $48/mo
- Expected delta
- +$184/yr (+$15/mo · 46.5%)
ⓘ Screening estimate from a state-policy table — verify with the county assessor before closing.
Climate risk First Street
- Flood 1/10 Low FEMA zone X (unshaded) · 0% chance over 30 yrs
- Wildfire 1/10 Low
- Heat 3/10 Moderate 7 d/yr ≥100°F today · 18 d/yr by 30 yrs out
- Wind 2/10 Low 100% chance of damaging wind over 30 yrs
- Air quality 3/10 Moderate 2 unhealthy d/yr today · 3 by 30 yrs out
Nearby sold comps map
Loading sold comps map…
Walkable amenities ~0.75 mi
Loading nearby amenities…
Taxation est. · year 1
- Rental income
- $11,302
- − Mortgage interest
- −$5,036
- − Property taxes
- −$396
- − Insurance
- −$450
- − Repairs & maintenance
- −$904
- − Management
- −$904
- − Depreciation
- −$2,615
- Taxable income
- $997
- Est. tax owed @ 24.0%
- −$239
- After-tax cash flow
- $2,186/yr
For passive investors: Depreciation is non-cash, so a rental often shows a tax loss while cash-flowing — sheltering income. Rental losses are passive: they offset passive income freely, and up to $25,000/yr can offset ordinary (W-2) income if you actively participate and your MAGI is under $100k (phasing out to $0 by $150k); unused losses carry forward. On sale, claimed depreciation is recaptured at up to 25%, and gains may owe capital-gains tax (a 1031 exchange can defer both). Figures are a year-1 estimate at your 24.0% rate — not tax advice; consult a CPA.
Schools (NCES district)
- District
- Richmond Community Schools
- NCES district ID
- 1809510
- Math proficiency
- 18% ▼ -7.00%
- Reading proficiency
- 27% ▼ -2.00%
- Median HH income
- $35,288
- Composite
- 18.55/100
- National rank
- #8913
- State rank
- #270 of 301 in IN
Livability — Richmond
- Score
- 83/100
- State rank
- #10
- US rank
- #869
Category grades
Schools grade is shown separately in the Schools card above.
Census & demographics
- Census place
- Richmond, IN
- County
- Wayne County · 44,615 people
- City population
- 44,615
- Metro
- Richmond, IN
- Population (ZIP)
- 44,615
- Household income
- $50,766
- Rent vs Own
- Severe rent burden
- 1600.0
Population outlook (Wayne County) Hauer SSP2
- Today (2025)
- 63,316 people
- By 2030
- 60,893 · -3.8%
- By 2040
- 55,386 · -12.5%
- By 2050
- 49,946 · -21.1%
- By 2075
- 37,900 · -40.1%
- By 2100
- 26,562 · -58.0%
Race, ethnicity, and origin ACS 2023
- Neighborhood character
- Predominantly White (82%)
- Race & ethnicity
- White 82% Two or more races 7% Black 6% Hispanic / Latino 4% Asian 1%
- Common ancestry
- Slovak 2% Italian 1% Lithuanian 1%
- Foreign-born
- 4% · Canada, China
- Languages at home
- 95% English-only · Spanish 3%
Political lean MEDSL · Wayne
- 2024 margin
- Solid R (+32.5) · D 32.9% · R 65.4% · Other 1.6%
- 2008→2024 swing
- -28.6pp toward R · 2008: -3.9pp · 2024: -32.5pp
- All cycles
- 2024: R+32.5 2020: R+29.1 2016: R+30.1 2012: R+14.7 2008: R+3.9
Not yet ingested
- Civics
- —
Market trends
- HPI YoY
- ▼ -118.64%
- Current HPI
- 182.5038
- Rent YoY
- —
- Metro
- Richmond, IN
- State GDP YoY
- ▲ 2.90%
- F500 in state
- 18
Industry mix (Fortune 500 HQ in IN)
| Industry | F500 HQs | Revenue |
|---|---|---|
| Industrial Machinery | 2 | $37B |
|
||
| Healthcare | 1 | $177B |
|
||
| Pharmaceuticals | 1 | $45B |
|
||
| Metals / Steel | 1 | $18B |
|
||
| Agriculture | 1 | $17B |
|
||
| Packaging | 1 | $12B |
|
||
Price history
+75.5% since first listed7 events — show timeline
- 2026-04-20 Price Changed $99,877 RRELMS
- 2026-04-03 Price Changed $109,877 RRELMS
- 2026-03-17 Listed $119,877 RRELMS
- 2025-07-23 Sold (MLS) $39,000 RRELMS
- 2025-07-15 Pending — RRELMS
- 2025-07-02 Price Changed $44,900 RRELMS
- 2025-06-12 Listed $56,900 RRELMS
Property tax history
-5.7%/yrLatest (2024): $396 · +0.0% YoY. Source: county tax records.
Cash-flow waterfall
monthlySold comps — $/sqft
last 12 mo · ≤1 miLoading sold comps…