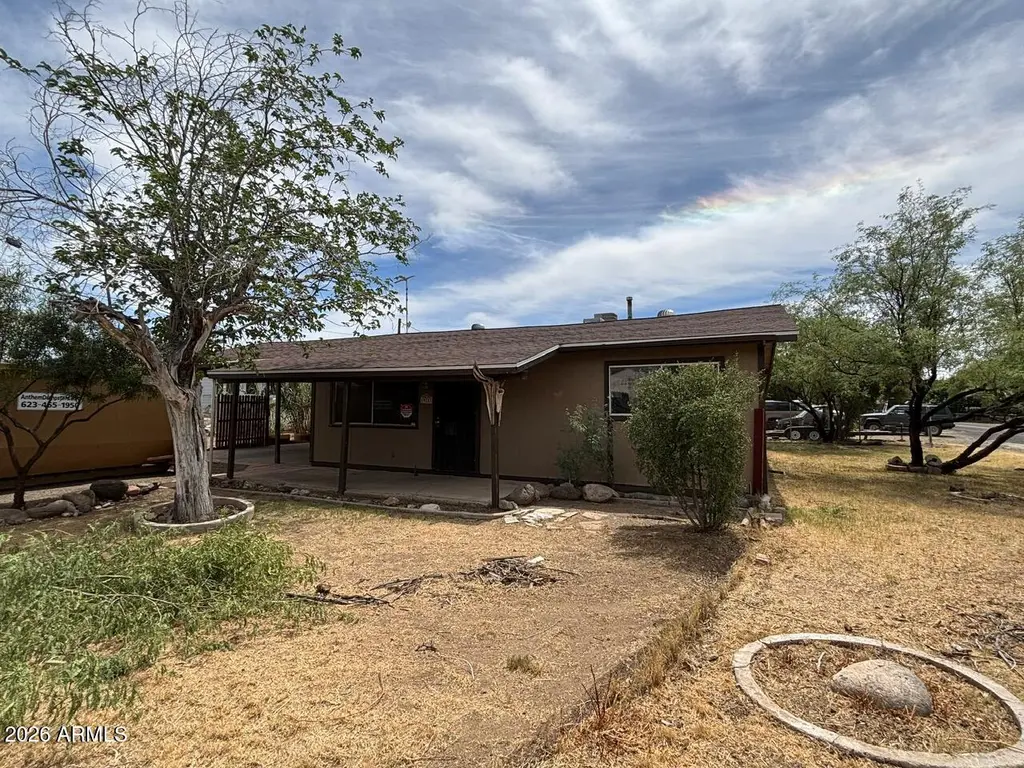
19253 E Church St · Black Canyon City, AZ
Flood risk 1/10 · Minimal
- FEMA flood zone
- X (unshaded)
- Chance of flooding over 30 yrs
- 0.0%
- Est. flood insurance / yr
- $507 – $1,088
Fire risk 7/10 · Major
- Est. fire insurance / yr
- $610 – $1,132
Heat risk 8/10 · Major
- Hot days now (above 109°F)
- 7 days/yr
- Hot days in 30 yrs
- 18 days/yr
Wind risk 1/10 · Minimal
- Chance of severe wind over 30 yrs
- —
Air-quality risk 2/10 · Minimal
- Unhealthy air days now
- 1 days/yr
- Unhealthy air days in 30 yrs
- 1 days/yr
Risk factors via First Street. Map © Google.
Why this score? — see what drove the B+ grade
The composite is a weighted blend of 9 inputs, each scored 0–100. Each bar is that input's sub-score; the figure is the points it added to the 100-point composite (weight × sub-score).
- Cash flow +30.0/30.0
- 1% rule +10.0/10.0
- DSCR +10.0/10.0
- Appreciation +10.0/10.0
- ARV discount +7.5/15.0
- Livability +2.9/5.0
- Schools +2.8/10.0
- Rent growth +2.5/5.0
- Condition / age +2.5/5.0
$100,000
🖨 Deal sheet (PDF) 📄 Offer letter ✓ Due diligence
Listing remarks
Site-built home on a pretty corner lot! Two bedrooms, one bath, large carport and a large shop. Newer roof, kitchen and exterior siding. Interior is in need of attention. New windows have not been installed but are at property.
Key facts
- Newer roof
- Large carport
- Corner lot
Tags
Property features AI
Finance
- HOA & community: No association fees
Exterior
- Parking: 2 covered spaces; 2 open parking spaces; 2 carport spaces
- Utilities: Private water company; Septic (in and connected)
- Home design: Single-family residence; Fee simple ownership; Mountain views
- Construction: Wood siding and wood frame construction; Painted exterior; Composition roof
- Exterior features: Chain-link partial fencing; Desert front and back landscaping; County-maintained road access
Interior
- Kitchen: Laminate counters
- Bedrooms: Up to 2 possible bedrooms
- Flooring: Laminate
- Bathrooms: 1 full bathroom
- Heating & cooling: Central air; Ceiling fans; No heating (none listed)
- Interior features: Eat-in kitchen; Laminate counters; Storage
- Laundry & utility: Washer/dryer hookup only
Neighborhood map
What this means for you Summary
Snapshot
- This is a 2-bed/1.0-bath single-family listed at $100k.
Deal economics
- At list price, monthly cash flow is $721 ($9k/yr) — positive.
- The deal already cash-flows at list — no discount required.
- Meets the 1% rule at list price ($2k rent vs $100k).
- Recommended offer: $97k (3.0% below list) — sets the bar for market timing.
- Cap rate 14.9% vs local median 4.9% in Black Canyon City — top-decile yield for the area; either an underpriced asset or a hidden risk that comps aren't pricing in. Stress-test before assuming the spread holds.
Location & tenants
- Location reads 58/100 on livability (#213 in AZ) — a working-class tenant base; expect higher turnover. Strengths: cost of living A+, housing A+, crime A; Watch: amenities F, commute F, employment F.
- Canon Elementary District (4484) (rural): math 25% / reading 35% proficiency, ranked #294 of 501 in AZ (top 59%) — families likely to look elsewhere, expect single-tenant / working-renter base with shorter leases; 65% free/reduced lunch — lower-income household profile, screen leases tightly.
- Zoned schools: Canon School (math 17% / reading 17%, grade F, #814 of 1,109 statewide, top 76%, 131 students, 93% FRL) — zoned schools average 93% FRL vs 65% district-wide (28 pts higher); higher-poverty schools than district average — tighter screening recommended.
- Zoned-school proficiency averages 17% at this address vs 30% district-wide (-13 pts) — the specific schools serving this property underperform the Canon Elementary District (4484) average; the district grade overstates school quality for this exact location.
- Market conditions: 45 active listings in the ZIP; 2,062 units permitted in Yavapai County in 2024 (98 in 5+ unit buildings).
Forward outlook
- In year one you build about $11k of equity ($691 loan paydown + $10k appreciation (10.0% local appreciation)).
- Yavapai County population projected at +10% by 2050 — modest demand growth; plan on rents tracking national, not racing it.
- At projected returns (10.0% appreciation + 3.0% rent growth), your $28k cash investment doubles in ~2 years — after that, you're playing with house money.
- By year 4, paydown + projected appreciation supports a ~$38k cash-out refi (75% LTV) — recoverable capital for the next deal without selling this one.
Negotiation context
- It's been on market 57 days — a 3% lower offer ($97k) is reasonable based on typical stale-listing flexibility.
Risks & watch-outs
- Watch-outs: built in 1956 — expect roof / HVAC / electrical / plumbing capex.
- Climate carrying-cost: major wildfire risk; extreme-heat days projected 7→18/yr by 2055 (HVAC capex compounding) — expect insurance premiums to compound above CPI over the hold.
Questions for the listing agent
- It's been on market 57 days. Have you received any prior offers? Is the seller open to a 3% concession, seller financing, or rate buy-down credit?
- Built in 1956 — when were the roof, HVAC, electrical panel, plumbing, and water heater last replaced?
- Is there a deadline driving the sale (1031 exchange, divorce, estate, relocation)? That informs how much negotiation room exists.
- Schools are F-rated, which usually means shorter tenancies and higher turnover. Who's the typical renter profile here, and what's been the actual vacancy rate?
- What's the average days-on-market for RENTAL listings here right now (not sales)? A rising rental-DOM trend means longer vacancies and softer asking-rent achievability than the comps imply.
- What's the recent tenant-quality profile in this submarket — average credit score on applications, eviction rate, late-payment / NSF rate, and stable-employment percentage? A property-management company in the area should have these aggregated.
- How much new for-sale + rental construction is in the pipeline within 1–3 miles? Heavy new supply typically softens prices + rents 12–24 months out; constrained supply supports both.
Investment metrics
- 1% rule
- 1.71% ✓
- Cap rate
- 14.94%
- Cash-on-cash
- 30.89%
- DSCR
- 2.37
- GRM
- 4.9
CMA / ARV
No comps found within radius.
Projected returns pro-forma
10.0% appreciation · 3.0% rent growth · sell at horizon
- IRR
- 47.8%
- Equity multiple
- 4.58×
- Total profit
- $100,363
- Equity at exit
- $90,088
- IRR
- 41.6%
- Equity multiple
- 10.27×
- Total profit
- $259,430
- Equity at exit
- $194,278
Cash invested: $28,000 (down + closing). Projections, not guarantees.
Landlord ↔ Tenant lean methodology
- Overall (STATE)
- 87 Strongly Landlord-Friendly
- State Arizona
- 87 Strongly Landlord-Friendly · R+3
- County
- — inherits STATE
- City
- — inherits STATE
ZIP-level market 85324
- Home prices YoY
- 7.5%
- Active inventory
- 45
- Price-to-rent
- 4.9×
Monthly cashflow live
- Estimated rent
- $1,714 medium interval (Pro) →
- Mortgage (P&I)
- −$524
- Tax from tax record
- −$67 /mo · $801/yr
- Insurance
- −$42
- HOA
- −$0
- Vacancy / Maint / Mgmt
- −$360
- Net cashflow
- $721
Break-even live
Sensitivity live
| Price | -10% $777 | -5% $749 | +0% $721 | +5% $693 | +10% $664 |
|---|---|---|---|---|---|
| Rent | -10% $585 | -5% $653 | +0% $721 | +5% $789 | +10% $856 |
| Rate | -1.0pp $771 | -0.5pp $746 | base $721 | +0.5pp $695 | +1.0pp $669 |
UW: 25.0% down · 7.5% · 30yr · 1.5% tax · 5.0% vac · 8.0% maint · 8.0% mgmt
Financing live
Cash to close
- Down payment
- $25,000
- Closing costs
- $3,000
- Reserves months
- —
- Total cash needed
- —
Loan-product check · same deal, 3 products live
Conventional
25% down · 7.5% · 30yr
- Down + closing
- —
- Monthly P&I
- —
- Monthly cashflow
- —
- DSCR
- —
- Eligible?
- —
Personal DTI + credit; lowest rate.
DSCR
20% down · 8.5% · 30yr
- Down + closing
- —
- Monthly P&I
- —
- Monthly cashflow
- —
- DSCR
- —
- Eligible?
- —
No personal income docs; deal must DSCR.
Hard money
10% down · 12.0% · 12mo
- Down + closing
- —
- Monthly P&I
- —
- Monthly cashflow
- —
- DSCR
- —
- Eligible?
- —
Short-term bridge; refi at stabilization.
Listing history 20 events
-
2026-06-19days on market $100,000 Active 57 DOM
-
2026-06-18days on market $100,000 Active 56 DOM
-
2026-06-17price $100,000 Active 55 DOM
-
2026-06-17days on market $190,000 Active 55 DOM
-
2026-06-16days on market $190,000 Active 54 DOM
-
2026-06-15days on market $190,000 Active 53 DOM
-
2026-06-14days on market $190,000 Active 51 DOM
-
2026-06-12days on market $190,000 Active 50 DOM
-
2026-06-09days on market $190,000 Active 47 DOM
-
2026-06-08days on market $190,000 Active 46 DOM
-
2026-06-07days on market $190,000 Active 45 DOM
-
2026-06-07days on market $190,000 Active 44 DOM
-
2026-06-04days on market $190,000 Active 41 DOM
-
2026-06-02days on market $190,000 Active 40 DOM
-
2026-06-01days on market $190,000 Active 39 DOM
-
2026-05-31days on market $190,000 Active 38 DOM
-
2026-05-31days on market $190,000 Active 37 DOM
-
2026-04-23$215,000 Active
-
2023-06-07soldstatus $120,000
-
1988-11-18soldstatus $40,000
ⓘ Source: listings_history table (triggers on properties + properties_extension) + one-shot
backfill from property_details.listing_events for pre-trigger history.
Tax reassessment forecast AZ · Resets to sale price
- Current annual tax
- $801 · $67/mo
- Projected year-2 tax
- $801 · $67/mo
- Expected delta
- $0/yr ($0/mo · -0.0%)
ⓘ Screening estimate from a state-policy table — verify with the county assessor before closing.
Climate risk First Street
- Flood 1/10 Low FEMA zone X (unshaded) · 0% chance over 30 yrs
- Wildfire 7/10 Severe
- Heat 8/10 Severe 7 d/yr ≥109°F today · 18 d/yr by 30 yrs out
- Wind 1/10 Low
- Air quality 2/10 Low 1 unhealthy d/yr today · 1 by 30 yrs out
Nearby sold comps map
Loading sold comps map…
Walkable amenities ~0.75 mi
Loading nearby amenities…
Taxation est. · year 1
- Rental income
- $20,562
- − Mortgage interest
- −$5,602
- − Property taxes
- −$801
- − Insurance
- −$500
- − Repairs & maintenance
- −$1,645
- − Management
- −$1,645
- − Depreciation
- −$2,909
- Taxable income
- $7,460
- Est. tax owed @ 24.0%
- −$1,791
- After-tax cash flow
- $6,860/yr
For passive investors: Depreciation is non-cash, so a rental often shows a tax loss while cash-flowing — sheltering income. Rental losses are passive: they offset passive income freely, and up to $25,000/yr can offset ordinary (W-2) income if you actively participate and your MAGI is under $100k (phasing out to $0 by $150k); unused losses carry forward. On sale, claimed depreciation is recaptured at up to 25%, and gains may owe capital-gains tax (a 1031 exchange can defer both). Figures are a year-1 estimate at your 24.0% rate — not tax advice; consult a CPA.
Schools (NCES district)
- District
- Canon Elementary District (4484)
- NCES district ID
- 0401650
- Math proficiency
- 25% ▲ 5.00%
- Reading proficiency
- 35% ▬ 0.00%
- Median HH income
- $37,755
- Composite
- 27.85/100
- National rank
- #12286
- State rank
- #294 of 501 in AZ
Livability — Black Canyon City
- Score
- 58/100
- State rank
- #213
- US rank
- #21226
Category grades
Schools grade is shown separately in the Schools card above.
Census & demographics
- Census place
- Black Canyon City, AZ
- Population (ZIP)
- 2,297
Population outlook (Yavapai County) Hauer SSP2
- Today (2025)
- 241,389 people
- By 2030
- 249,523 · +3.4%
- By 2040
- 259,966 · +7.7%
- By 2050
- 264,736 · +9.7%
- By 2075
- 269,334 · +11.6%
- By 2100
- 256,505 · +6.3%
Race, ethnicity, and origin ACS 2023
- Neighborhood character
- Predominantly White (91%)
- Race & ethnicity
- White 91% Two or more races 7% Hispanic / Latino 3%
- Common ancestry
- Iranian 5% Serbian 3% Lithuanian 2%
- Foreign-born
- 1% · Canada
Political lean MEDSL · Yavapai
- 2024 margin
- Solid R (+33.9) · D 32.6% · R 66.5%
- 2008→2024 swing
- -9.5pp toward R · 2008: -24.4pp · 2024: -33.9pp
- All cycles
- 2024: R+33.9 2020: R+29.3 2016: R+31.4 2012: R+30.7 2008: R+24.4
Not yet ingested
- Civics
- —
Market trends
- HPI YoY
- ▲ 29.16%
- Current HPI
- 417.6032
- Rent YoY
- —
- Metro
- —
- State GDP YoY
- ▲ 4.54%
- F500 in state
- 20
Industry mix (Fortune 500 HQ in AZ)
| Industry | F500 HQs | Revenue |
|---|---|---|
| Technology | 2 | $13B |
|
||
| Mining / Metals | 1 | $23B |
|
||
| Environmental Services | 1 | $16B |
|
||
| Metals / Steel | 1 | $14B |
|
||
| Technology Distribution | 1 | $9B |
|
||
| Homebuilding | 1 | $8B |
|
||
Price history
+437.5% since first listed3 events — show timeline
- 2026-04-23 Listed $215,000 ARMLS
- 2023-06-07 Sold (Public Records) $120,000 Public Records
- 1988-11-18 Sold (Public Records) $40,000 Public Records
Property tax history
+6.0%/yrLatest (2025): $801 · +55.2% YoY. Source: county tax records.
Cash-flow waterfall
monthlySold comps — $/sqft
last 12 mo · ≤1 miLoading sold comps…