 Duplex
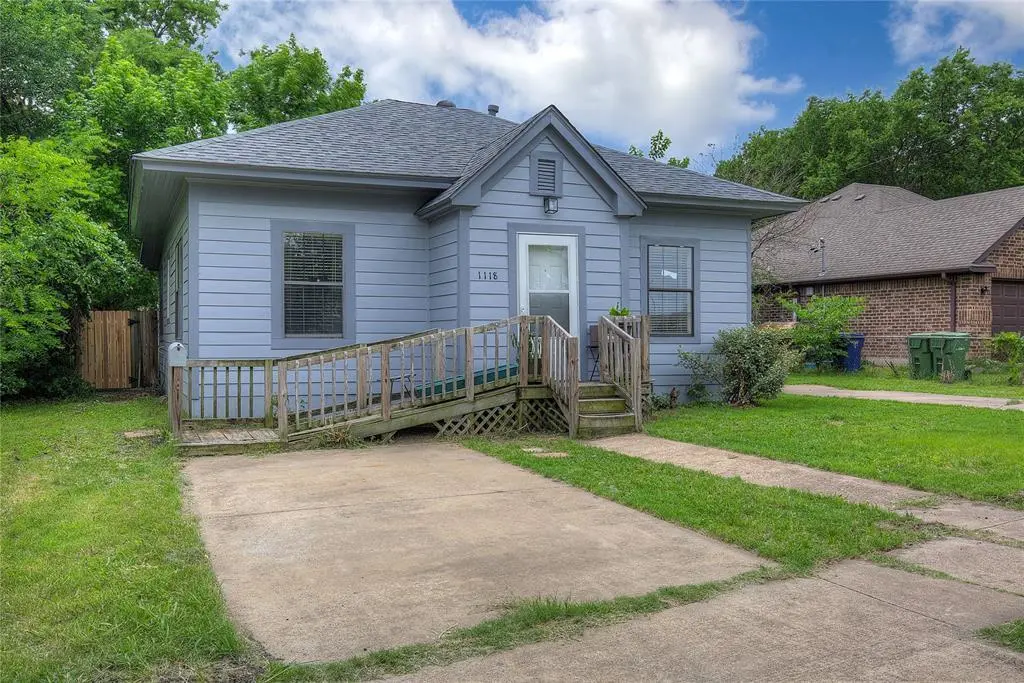
1118 Clinton St · Garland, TX
Flood risk 1/10 · Minimal
- FEMA flood zone
- X (unshaded)
- Chance of flooding over 30 yrs
- 0.0%
- Est. flood insurance / yr
- $507 – $1,088
Fire risk 1/10 · Minimal
- Est. fire insurance / yr
- $1,222 – $2,270
Heat risk 7/10 · Major
- Hot days now (above 109°F)
- 7 days/yr
- Hot days in 30 yrs
- 22 days/yr
Wind risk 6/10 · Moderate
- Chance of severe wind over 30 yrs
- 27.0%
Air-quality risk 2/10 · Minimal
- Unhealthy air days now
- 2 days/yr
- Unhealthy air days in 30 yrs
- 2 days/yr
Risk factors via First Street. Map © Google.
Why this score? — see what drove the C grade
The composite is a weighted blend of 9 inputs, each scored 0–100. Each bar is that input's sub-score; the figure is the points it added to the 100-point composite (weight × sub-score).
- Cash flow +23.9/30.0
- DSCR +7.7/10.0
- ARV discount +7.5/15.0
- 1% rule +6.9/10.0
- Livability +3.7/5.0
- Schools +2.9/10.0
- Rent growth +2.6/5.0
- Condition / age +2.5/5.0
- Appreciation +0.0/10.0
$217,999
🖨 Deal sheet (PDF) 📄 Offer letter ✓ Due diligence
Multi-family units
County records classify this as Multi-Family (2-4 Unit). Listing-text estimate: 2 units. confirmed
Listing remarks MLS
INVESTMENT OPPORTUNITY! This full duplex has tenants in both sides for the past 2-3 years. Lots of updates like roof, tile floors, fence and appliances. Great location close to shopping, USPS, Library and Granville Art Center. The small unit has a storage type building in the back yard with water and electric. It has approx. 127 sq ft. Deck on back of smaller unit with retractable patio cover. Great price and great income producing.
Key facts
- Income potential
- Dual-rental gem
- Separate living area
Tags
Property features AI
Finance
- Other: Two buildings with two total units
- Financial info: Gross annual income: $25,800; Insurance expense: $1,500; Net operating income: $25,800; Capitalization rate: 11.22%; Listing terms: Cash or Conventional
- HOA & community: No association
Exterior
- Parking: 4 parking spaces (including driveway and street parking); No garage or carport
- Utilities: City water; City sewer; Electricity available and connected; Cable available
- Home design: Duplex (residential income); One story; Preowned (built 1948)
- Construction: Siding exterior; Composition roof; Pillar/post/pier foundation
- Exterior features: Driveway; On-street parking; Concrete and curbs
Interior
- Kitchen: Electric cooktop; Electric oven; Refrigerator; Eat-in kitchen
- Bedrooms: 2 bedrooms (single-level)
- Flooring: Carpet; Ceramic tile; Vinyl
- Bathrooms: 2 full bathrooms
- Heating & cooling: Central heating (electric); Central air conditioning (electric)
- Interior features: Cable TV available; High-speed internet available; Eat-in kitchen; Open floorplan; Accessible approach with ramp
- Laundry & utility: Washer; Dryer; Electric water heater
Neighborhood map
What this means for you Summary
Snapshot
- This is a 2 × 1-bed/1.0-bath units multifamily listed at $218k.
Deal economics
- At list price, monthly cash flow is $424 ($5k/yr) — positive. Per door: $212/mo.
- The deal already cash-flows at list — no discount required.
- Meets the 1% rule at list price ($3k rent vs $218k).
- Recommended offer: $215k (1.5% below list) — sets the bar for market timing.
- Cap rate 8.6% vs local median 3.5% in Garland — top-decile yield for the area; either an underpriced asset or a hidden risk that comps aren't pricing in. Stress-test before assuming the spread holds.
Location & tenants
- Location reads 74/100 on livability (#165 in TX, #4,447 nationally) — a middle-class / working-renter tenant base. Strengths: commute A+, housing A+, cost of living A-; Watch: amenities C-, health & safety F.
- Garland ISD (suburban): math 27% / reading 37% proficiency, ranked #553 of 826 in TX (top 67%) — families likely to look elsewhere, expect single-tenant / working-renter base with shorter leases.
- Zoned schools: Daugherty El (math 22% / reading 29%, grade F, #2,982 of 4,322 statewide, top 70%, 810 students, 94% FRL); B G Hudson Middle (math 33% / reading 42%, grade F, #736 of 1,662 statewide, top 45%, 1,207 students, 50% FRL); Sachse H S (math 46% / reading 53%, grade D, #509 of 1,632 statewide, top 34%, 2,997 students, 43% FRL).
- Market conditions: Rents flat; 233 active listings in the ZIP; 29 comparable units currently listed for rent nearby; rentals at typical pace (median 21d on market — plan ~3-4 weeks tenant-placement turnaround); 12,577 units permitted in Dallas County in 2024 (6,829 in 5+ unit buildings).
- This rent runs 42% of the median local income ($75k/yr) — at the standard rent-burdened threshold; future hikes will face affordability resistance.
Forward outlook
- Local home prices are declining (-3.0%/yr); year-one equity from $2k of loan paydown is wiped out by about $7k of value loss. Plan a longer hold.
- Dallas County population projected at +35% by 2050 — long-run rental-demand tailwind backs the buy-and-hold thesis.
Negotiation context
- It's been on market 26 days — a 2% lower offer ($215k) is reasonable based on typical stale-listing flexibility.
- 3 sale attempts since 21y ago; this cycle's ask has dropped $12k (5%) from the opening price — seller is motivated, your offer sets the floor, not the list.
Risks & watch-outs
- Watch-outs: built in 1948 — expect roof / HVAC / electrical / plumbing capex.
- Climate carrying-cost: major wind risk, 27% chance of damaging wind over 30y; extreme-heat days projected 7→22/yr by 2055 (HVAC capex compounding) — expect insurance premiums to compound above CPI over the hold.
Questions for the listing agent
- Can we see the unit-by-unit rent roll, current vacancy, and any below-market leases? What's the average tenancy length?
- What capital expenditures (roof, boiler, parking lot, exteriors) have been made in the last 5 years, and what's planned in the next 2?
- Built in 1948 — when were the roof, HVAC, electrical panel, plumbing, and water heater last replaced?
- Is there a deadline driving the sale (1031 exchange, divorce, estate, relocation)? That informs how much negotiation room exists.
- Schools are D-rated, which usually means shorter tenancies and higher turnover. Who's the typical renter profile here, and what's been the actual vacancy rate?
- What's the average days-on-market for RENTAL listings here right now (not sales)? A rising rental-DOM trend means longer vacancies and softer asking-rent achievability than the comps imply.
- What's the recent tenant-quality profile in this submarket — average credit score on applications, eviction rate, late-payment / NSF rate, and stable-employment percentage? A property-management company in the area should have these aggregated.
- How much new apartment / multifamily construction is in the pipeline within 1–3 miles? Heavy new supply (>2% of stock underway) typically softens rents 12–24 months out; light construction supports rent growth.
Investment metrics
- 1% rule
- 1.19% ✓
- Cap rate
- 8.63%
- Cash-on-cash
- 8.33%
- DSCR
- 1.37
- GRM
- 7.0
CMA / ARV
No comps found within radius.
Projected returns pro-forma
-3.0% appreciation · 0.43% rent growth · sell at horizon
- IRR
- -6.7%
- Equity multiple
- 0.76×
- Total profit
- $-14,757
- Equity at exit
- $32,504
- IRR
- -0.8%
- Equity multiple
- 0.95×
- Total profit
- $-3,134
- Equity at exit
- $18,849
Cash invested: $61,040 (down + closing). Projections, not guarantees.
Landlord ↔ Tenant lean methodology
- Overall (STATE)
- 87 Strongly Landlord-Friendly
- State Texas
- 87 Strongly Landlord-Friendly · R+5
- County
- — inherits STATE
- City
- — inherits STATE
ZIP-level market 75040
- Rents YoY
- 0.4%
- Active inventory
- 233
- Price-to-rent
- 14.0×
Monthly cashflow live
- Estimated rent
- $2,596 medium interval (Pro) →
- Mortgage (P&I)
- −$1,143
- Tax from tax record
- −$393 /mo · $4,714/yr
- Insurance
- −$91
- HOA
- −$0
- Vacancy / Maint / Mgmt
- −$545
- Net cashflow
- $424
Break-even live
Sensitivity live
| Price | -10% $547 | -5% $486 | +0% $424 | +5% $362 | +10% $301 |
|---|---|---|---|---|---|
| Rent | -10% $219 | -5% $321 | +0% $424 | +5% $526 | +10% $629 |
| Rate | -1.0pp $534 | -0.5pp $479 | base $424 | +0.5pp $367 | +1.0pp $310 |
2-unit breakdown (identical units grouped — click to expand)
| Units | Beds | Baths | Est. rent |
|---|---|---|---|
| 2× units | 1 | 1 | $2,596 |
| #1 | 1 | 1 | $1,298 |
| #2 | 1 | 1 | $1,298 |
| Total (2 units) | $2,596 | ||
UW: 25.0% down · 7.5% · 30yr · 1.5% tax · 5.0% vac · 8.0% maint · 8.0% mgmt
Financing live
Cash to close
- Down payment
- $54,500
- Closing costs
- $6,540
- Reserves months
- —
- Total cash needed
- —
Loan-product check · same deal, 3 products live
Conventional
25% down · 7.5% · 30yr
- Down + closing
- —
- Monthly P&I
- —
- Monthly cashflow
- —
- DSCR
- —
- Eligible?
- —
Personal DTI + credit; lowest rate.
DSCR
20% down · 8.5% · 30yr
- Down + closing
- —
- Monthly P&I
- —
- Monthly cashflow
- —
- DSCR
- —
- Eligible?
- —
No personal income docs; deal must DSCR.
Hard money
10% down · 12.0% · 12mo
- Down + closing
- —
- Monthly P&I
- —
- Monthly cashflow
- —
- DSCR
- —
- Eligible?
- —
Short-term bridge; refi at stabilization.
Rent comps 29 comps
| Address | Beds | Baths | Sqft | Rent | $/sqft | DOM | Units | Dist |
|---|---|---|---|---|---|---|---|---|
| 217 S Garland Ave Garland, TX | 1.0–2.0 | 1.0–2.0 | 1084 | $2,440 | $2.25 | 9d | 15 | 0.34mi |
| 1240 W Avenue D Garland, TX | 2.0 | 1.0 | 800 | $1,500 | $1.88 | 3d | 3 | 0.46mi |
| 1227 W Avenue E Garland, TX | 3.0 | 1.0 | 1284 | $1,950 | $1.52 | 45d | 1 | 0.49mi |
| 1812 Frances Dr Unit 1812 Garland, TX | 2.0 | 1.5 | 1224 | $1,700 | $1.39 | 45d | 1 | 0.55mi |
| 1812 Frances Dr Unit 1810 Garland, TX | 2.0 | 1.5 | 1224 | $1,550 | $1.27 | 1d | 1 | 0.55mi |
| 1812 Frances Dr Garland, TX | 2.0 | 1.5 | 1224 | $1,650 | $1.35 | 45d | 1 | 0.55mi |
| 324 Rita Dr Garland, TX | 2.0 | 1.5 | 1037 | $1,400 | $1.35 | 45d | 1 | 0.61mi |
| 1531 Maple Dr Garland, TX | 4.0 | 2.0 | 1416 | $2,200 | $1.55 | 12d | 1 | 0.62mi |
| 821 Travis St Garland, TX | 3.0 | 1.0 | 1158 | $1,875 | $1.62 | 45d | 1 | 0.69mi |
| 1605 Maple Dr Garland, TX | 4.0 | 1.0 | 1393 | $1,550 | $1.11 | 26d | 1 | 0.69mi |
| 2039 W Walnut St Garland, TX | 2.0 | 2.0 | 1200 | $1,400 | $1.17 | 9d | 1 | 0.74mi |
| 2039 W Walnut St Unit C Garland, TX | 2.0 | 1.5 | 1200 | $1,400 | $1.17 | 15d | 1 | 0.74mi |
| 1425 Cedarcrest Dr Garland, TX | 2.0 | 1.0 | 1064 | $1,650 | $1.55 | 26d | 1 | 0.92mi |
| 1821 Travis St Garland, TX | 3.0 | 2.0 | 1445 | $2,350 | $1.63 | 1d | 1 | 0.95mi |
| 2007 Santa Anna Dr Garland, TX | 3.0 | 2.0 | 1390 | $1,850 | $1.33 | 26d | 1 | 1.00mi |
| 625 Camilla Ln Garland, TX | 3.0 | 2.0 | 1273 | $2,300 | $1.81 | 6d | 1 | 1.04mi |
| 1540 Edgefield Dr Garland, TX | 1.0–2.0 | 1.0–2.0 | 775 | $1,740 | $2.25 | 1d | 23 | 1.10mi |
| 1702 Edgefield Dr Garland, TX | 2.0 | 1.0–2.0 | 626 | $1,470 | $2.35 | 1d | 62 | 1.20mi |
| 2502 Lakewood Dr Garland, TX | 3.0 | 1.0 | 1405 | $1,800 | $1.28 | 9d | 1 | 1.21mi |
| 512 Freeman Dr Garland, TX | 2.0 | 1.0 | 774 | $1,695 | $2.19 | 45d | 1 | 1.21mi |
| 501 Rosewood Hills Dr Garland, TX | 3.0 | 1.5 | 1304 | $1,850 | $1.42 | 20d | 1 | 1.23mi |
| 2005 Glencrest Ln Garland, TX | 3.0 | 2.0 | 1473 | $2,400 | $1.63 | 45d | 1 | 1.24mi |
| 616 Moore St Unit D Garland, TX | 3.0 | 1.5 | 1172 | $1,600 | $1.37 | 45d | 1 | 1.30mi |
| 2013 Victoria Dr Garland, TX | 3.0 | 2.0 | 1159 | $1,900 | $1.64 | 5d | 1 | 1.31mi |
| 2013 Victoria Dr Garland, TX | 3.0 | 2.0 | 1159 | $1,900 | $1.64 | 16d | 1 | 1.31mi |
| 617 Rosewood Hills Dr Garland, TX | 3.0 | 2.0 | 1272 | $1,800 | $1.42 | 26d | 1 | 1.33mi |
| 502 Moonlight Dr Garland, TX | 3.0 | 2.0 | 1496 | $1,900 | $1.27 | 13d | 1 | 1.36mi |
| 1222 S Shiloh Rd Unit S-102 Garland, TX | 2.0 | 1.0 | 920 | $1,200 | $1.30 | 45d | 1 | 1.45mi |
| 219 Loma Dr Garland, TX | 3.0 | 1.5 | 884 | $1,699 | $1.92 | 45d | 1 | 1.48mi |
Listing history 16 events
-
2026-06-02statusdays on market $217,999 Pending 26 DOM
-
2026-06-01days on market $217,999 Active Option Contract 25 DOM
-
2026-05-31days on market $217,999 Active Option Contract 24 DOM
-
2026-05-19price $217,999
-
2026-05-07$229,999 Active
-
2014-08-22soldstatus
-
2014-08-20soldstatus Sold 437-char remark
Show marketing remark (437 chars)
INVESTMENT OPPORTUNITY! This full duplex has tenants in both sides for the past 2-3 years. Lots of updates like roof, tile floors, fence and appliances. Great location close to shopping, USPS, Library and Granville Art Center. The small unit has a storage type building in the back yard with water and electric. It has approx. 127 sq ft. Deck on back of smaller unit with retractable patio cover. Great price and great income producing.
-
2014-08-15status Pending 437-char remark
Show marketing remark (437 chars)
INVESTMENT OPPORTUNITY! This full duplex has tenants in both sides for the past 2-3 years. Lots of updates like roof, tile floors, fence and appliances. Great location close to shopping, USPS, Library and Granville Art Center. The small unit has a storage type building in the back yard with water and electric. It has approx. 127 sq ft. Deck on back of smaller unit with retractable patio cover. Great price and great income producing.
-
2014-08-09historical Active Option Contract 437-char remark
Show marketing remark (437 chars)
INVESTMENT OPPORTUNITY! This full duplex has tenants in both sides for the past 2-3 years. Lots of updates like roof, tile floors, fence and appliances. Great location close to shopping, USPS, Library and Granville Art Center. The small unit has a storage type building in the back yard with water and electric. It has approx. 127 sq ft. Deck on back of smaller unit with retractable patio cover. Great price and great income producing.
-
2014-08-04$110,000 Active 437-char remark
Show marketing remark (437 chars)
INVESTMENT OPPORTUNITY! This full duplex has tenants in both sides for the past 2-3 years. Lots of updates like roof, tile floors, fence and appliances. Great location close to shopping, USPS, Library and Granville Art Center. The small unit has a storage type building in the back yard with water and electric. It has approx. 127 sq ft. Deck on back of smaller unit with retractable patio cover. Great price and great income producing.
-
2006-01-13soldstatus
-
2006-01-05soldstatus 179-char remark
Show marketing remark (179 chars)
Duplex in nice area of Garland. Rents could be updated. .. tenants are currently on month to month. Property shows as a single family in tax rolls. Low maintenance - good tenants.
-
2005-12-20historical 179-char remark
Show marketing remark (179 chars)
Duplex in nice area of Garland. Rents could be updated. .. tenants are currently on month to month. Property shows as a single family in tax rolls. Low maintenance - good tenants.
-
2005-12-01$74,900 179-char remark
Show marketing remark (179 chars)
Duplex in nice area of Garland. Rents could be updated. .. tenants are currently on month to month. Property shows as a single family in tax rolls. Low maintenance - good tenants.
-
2000-07-05soldstatus
-
1984-12-16soldstatus
ⓘ Source: listings_history table (triggers on properties + properties_extension) + one-shot
backfill from property_details.listing_events for pre-trigger history.
Tax reassessment forecast TX · Resets to sale price
- Current annual tax
- $4,714 · $393/mo
- Projected year-2 tax
- $4,714 · $393/mo
- Expected delta
- $0/yr ($0/mo · 0.0%)
ⓘ Screening estimate from a state-policy table — verify with the county assessor before closing.
Climate risk First Street
- Flood 1/10 Low FEMA zone X (unshaded) · 0% chance over 30 yrs
- Wildfire 1/10 Low
- Heat 7/10 Severe 7 d/yr ≥109°F today · 22 d/yr by 30 yrs out
- Wind 6/10 Major 27% chance of damaging wind over 30 yrs
- Air quality 2/10 Low 2 unhealthy d/yr today · 2 by 30 yrs out
Nearby sold comps map
Loading sold comps map…
Walkable amenities ~0.75 mi
Loading nearby amenities…
Taxation est. · year 1
- Rental income
- $31,152
- − Mortgage interest
- −$12,211
- − Property taxes
- −$4,714
- − Insurance
- −$1,090
- − Repairs & maintenance
- −$2,492
- − Management
- −$2,492
- − Depreciation
- −$6,342
- Taxable income
- $1,810
- Est. tax owed @ 24.0%
- −$434
- After-tax cash flow
- $4,653/yr
For passive investors: Depreciation is non-cash, so a rental often shows a tax loss while cash-flowing — sheltering income. Rental losses are passive: they offset passive income freely, and up to $25,000/yr can offset ordinary (W-2) income if you actively participate and your MAGI is under $100k (phasing out to $0 by $150k); unused losses carry forward. On sale, claimed depreciation is recaptured at up to 25%, and gains may owe capital-gains tax (a 1031 exchange can defer both). Figures are a year-1 estimate at your 24.0% rate — not tax advice; consult a CPA.
Schools (NCES district)
- District
- Garland ISD
- NCES district ID
- 4820340
- Math proficiency
- 27% ▼ -23.00%
- Reading proficiency
- 37% ▼ -10.00%
- Median HH income
- $58,392
- Composite
- 28.63/100
- National rank
- #6706
- State rank
- #553 of 826 in TX
Livability — Garland
- Score
- 74/100
- State rank
- #165
- US rank
- #4447
Category grades
Schools grade is shown separately in the Schools card above.
Census & demographics
- Census place
- Garland, TX
- County
- Dallas County · 2,612,404 people
- City population
- 246,342
- Metro
- Dallas-Fort Worth-Arlington, TX
- Population (ZIP)
- 64,606
- Household income
- $74,519
- Rent vs Own
- Severe rent burden
- 1746.0
Population outlook (Dallas County) Hauer SSP2
- Today (2025)
- 2,979,839 people
- By 2030
- 3,191,823 · +7.1%
- By 2040
- 3,619,611 · +21.5%
- By 2050
- 4,026,915 · +35.1%
- By 2075
- 4,957,073 · +66.4%
- By 2100
- 5,508,725 · +84.9%
Race, ethnicity, and origin ACS 2023
- Neighborhood character
- Diverse neighborhood (Simpson 0.69)
- Race & ethnicity
- Hispanic / Latino 48% Two or more races 29% White 21% Black 15% Asian 11%
- Hispanic origin (detail)
- Mexican 38% Puerto Rican 1%
- Common ancestry
- Lithuanian 1% Romanian 1%
- Foreign-born
- 33% · Canada, Vietnam, China
- Languages at home
- 45% English-only · Spanish 40% Vietnamese 7% Other Indo-European 1%
Political lean MEDSL · Dallas
- 2024 margin
- Strong D (+22.2) · D 60.2% · R 38.0% · Other 1.8%
- 2008→2024 swing
- +6.9pp toward D · 2008: 15.3pp · 2024: 22.2pp
- All cycles
- 2024: D+22.2 2020: D+31.6 2016: D+26.2 2012: D+15.4 2008: D+15.3
Not yet ingested
- Civics
- —
Market trends
- HPI YoY
- ▼ -203.91%
- Current HPI
- 325.6966
- Rent YoY
- ▲ 0.43%
- Metro
- Dallas-Fort Worth-Arlington, TX
- State GDP YoY
- ▲ 3.95%
- F500 in state
- 110
Industry mix (Fortune 500 HQ in TX)
| Industry | F500 HQs | Revenue |
|---|---|---|
| Energy | 16 | $1,198B |
|
||
| Technology | 5 | $198B |
|
||
| Engineering / Construction | 4 | $72B |
|
||
| Energy Services | 3 | $60B |
|
||
| Utilities | 3 | $41B |
|
||
| Healthcare | 2 | $330B |
|
||
Price history
+191.1% since first listed13 events — show timeline
- 2026-05-19 Price Changed $217,999 NTREIS
- 2026-05-07 Listed $229,999 NTREIS
- 2014-08-22 Sold (Public Records) — Public Records
- 2014-08-20 Sold (MLS) — NTREIS
- 2014-08-15 Pending — NTREIS
- 2014-08-09 Contingent — NTREIS
- 2014-08-04 Listed $110,000 NTREIS
- 2006-01-13 Sold (Public Records) — Public Records
- 2006-01-05 Sold (MLS) — NTREIS
- 2005-12-20 Listing Removed — NTREIS
- 2005-12-01 Listed $74,900 NTREIS
- 2000-07-05 Sold (Public Records) — Public Records
- 1984-12-16 Sold (Public Records) — Public Records
Property tax history
+5.7%/yrLatest (2025): $4,714 · +5.3% YoY. Source: county tax records.
Cash-flow waterfall
monthlySold comps — $/sqft
last 12 mo · ≤1 miLoading sold comps…