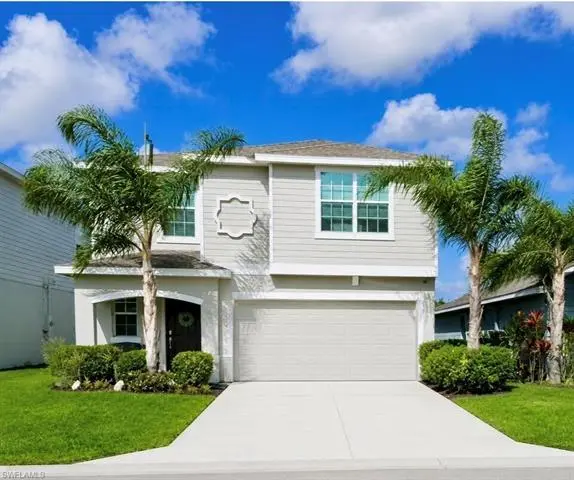
12210 Dakota Ridge Pl · Lehigh Acres, FL
Flood risk 1/10 · Minimal
- FEMA flood zone
- X (unshaded)
- Chance of flooding over 30 yrs
- 0.0%
- Est. flood insurance / yr
- $507 – $1,088
Fire risk 5/10 · Moderate
- Est. fire insurance / yr
- $947 – $1,759
Heat risk 10/10 · Severe
- Hot days now (above 108°F)
- 7 days/yr
- Hot days in 30 yrs
- 28 days/yr
Wind risk 10/10 · Severe
- Chance of severe wind over 30 yrs
- 99.0%
Air-quality risk 2/10 · Minimal
- Unhealthy air days now
- 1 days/yr
- Unhealthy air days in 30 yrs
- 2 days/yr
Risk factors via First Street. Map © Google.
Why this score? — see what drove the F grade
The composite is a weighted blend of 9 inputs, each scored 0–100. Each bar is that input's sub-score; the figure is the points it added to the 100-point composite (weight × sub-score).
- Appreciation +10.0/10.0
- Cash flow +6.3/30.0
- ARV discount +4.5/15.0
- Schools +4.1/10.0
- Livability +3.0/5.0
- 1% rule +2.5/10.0
- Condition / age +2.5/5.0
- Rent growth +1.3/5.0
- DSCR +0.6/10.0
$339,999
🖨 Deal sheet 📄 Offer letter ✓ Due diligence
Listing remarks
One or more photo(s) has been virtually staged, AI generated or rendered. Priced to sell! Won’t last long!! Welcome to your dream home in the highly desirable gated community of Lennar at 12210 Dakota Ridge Place in Lehigh Acres. Built in 2023, this beautifully maintained and no-longer-available “Boston” model beings the best combination of modern comfort, family-friendly space, and peaceful waterfront living. This spacious two-story home features 5 bedrooms and 2.5 bathrooms with an open-concept downstairs layout designed for both entertaining and everyday living. The first floor includes a welcoming sitting area, dining space, large kitchen, laundry room, and attached
Key facts
- Gated community
- Private pool
- Water views
Tags
Property features AI
Finance
- Other: Lot approximately 0.12 acres; Restrictions: Architectural and Endangered Species
- HOA & community: Mandatory HOA with professional management; HOA fee $200 monthly (total annual recurring fees $2,400); HOA maintains lawn/land; Gated community; Community amenities include clubhouse, community pool, exercise room, playground, community park, BBQ/picnic area, internet access, streetlights, and underground utilities
Exterior
- Parking: Attached 2-car garage
- Security: Impact resistant doors and windows
- Utilities: Central sewer; Water assessment paid; Cable available
- Home design: Single-family residence; 2-story; Rear exposure faces west; Residential property in Savanna Lakes
- Construction: Built in 2023; Concrete block construction; Stucco and vinyl siding exterior; Shingle roof
- Exterior features: Patio; Below-ground screened private pool; Impact resistant windows and doors; Across from waterfront; Lake view; Canal width 31–80
Interior
- Kitchen: Range; Dishwasher; Pantry
- Bedrooms: 5 bedrooms
- Flooring: Carpet; Tile
- Bathrooms: 2 full bathrooms; 1 half bathroom; Master bath with dual sinks and a shower (no tub)
- Heating & cooling: Central electric heat; Central electric cooling
- Interior features: Foyer; Pantry; Smoke detectors; Walk-in closet; Window coverings; Great room floor plan; 2-story layout; 10 total rooms; Loft; Open porch/lanai; Screened lanai/porch
- Laundry & utility: Washer; Dryer
Neighborhood map
What this means for you Summary
Snapshot
- This is a 5-bed/3.0-bath single-family listed at $340k.
Deal economics
- At list price, monthly cash flow is $-600 ($-7k/yr) — negative.
- To cash-flow at today's rent, offer at most $234k (31.2% below list).
- To meet the 1% rule (rent ≥ 1% of price), the offer needs to be $257k (24.5% below list).
- Recommended offer: $234k (31.2% below list) — sets the bar for cash-flow.
Location & tenants
- Location reads 59/100 on livability (#826 in FL) — a working-class tenant base; expect higher turnover. Strengths: cost of living A+, housing A+; Watch: crime C-, employment D+, schools D-.
- Lee (suburban): math 47% / reading 50% proficiency, ranked #42 of 73 in FL (top 58%) — families likely to look elsewhere, expect single-tenant / working-renter base with shorter leases.
- Market conditions: Rents falling (-4.7%/yr); 2460 active listings in the ZIP; 24 comparable units currently listed for rent nearby; rentals at typical pace (median 24d on market — plan ~3-4 weeks tenant-placement turnaround); 15,411 units permitted in Lee County in 2024 (4,686 in 5+ unit buildings).
- This rent runs 43% of the median local income ($72k/yr) — at the standard rent-burdened threshold; future hikes will face affordability resistance.
Forward outlook
- In year one you build about $36k of equity ($2k loan paydown + $34k appreciation (10.0% local appreciation)).
- Lee County population projected at +44% by 2050 — long-run rental-demand tailwind backs the buy-and-hold thesis.
- By year 2, paydown + projected appreciation supports a ~$58k cash-out refi (75% LTV) — recoverable capital for the next deal without selling this one.
Negotiation context
- It's been on market 30 days — a 2% lower offer ($335k) is reasonable based on typical stale-listing flexibility.
- 4 sale attempts with the ask held roughly flat each time — persistent listings suggest the price (not the market) is what's stuck; bring a comps-based counter.
Risks & watch-outs
- Climate carrying-cost: severe wind risk, 99% chance of damaging wind over 30y; moderate wildfire risk; extreme-heat days projected 7→28/yr by 2055 (HVAC capex compounding) — expect insurance premiums to compound above CPI over the hold.
Questions for the listing agent
- What do current leases actually rent for vs. the listed asking? Can we see a recent rent roll and the last 12 months of T-12 income?
- What does the HOA fee cover, when was the last increase, and are there any pending special assessments or reserve-fund shortfalls?
- Is there a deadline driving the sale (1031 exchange, divorce, estate, relocation)? That informs how much negotiation room exists.
- Schools are D-rated, which usually means shorter tenancies and higher turnover. Who's the typical renter profile here, and what's been the actual vacancy rate?
- The area grade is low — what's the realistic commute time and amenity access for the typical tenant pool here? Any planned neighborhood developments (good or bad) we should know about?
- What's the average days-on-market for RENTAL listings here right now (not sales)? A rising rental-DOM trend means longer vacancies and softer asking-rent achievability than the comps imply.
- What's the recent tenant-quality profile in this submarket — average credit score on applications, eviction rate, late-payment / NSF rate, and stable-employment percentage? A property-management company in the area should have these aggregated.
- How much new for-sale + rental construction is in the pipeline within 1–3 miles? Heavy new supply typically softens prices + rents 12–24 months out; constrained supply supports both.
Investment metrics
- 1% rule
- 0.75% ✗
- Cap rate
- 4.17%
- Cash-on-cash
- -7.57%
- DSCR
- 0.66
- GRM
- 11.0
CMA / ARV
- ARV (on-the-fly)
- $319,060
- Comps found
- 4
Show comp detail 4 sales within ~0.75 mi
| Address | Dist | Beds/Ba | Sqft | Sold | Price | $/sf | Match |
|---|---|---|---|---|---|---|---|
| 11926 Savanna Lakes Blvd | 0.49mi | 4/3.0 (-1) | 2,174 (-5%) | 1mo | $305,000 | $140 | 64 |
| 11893 Savanna Lakes Blvd | 0.57mi | 4/3.0 (-1) | 2,174 (-5%) | 2mo | $299,000 | $138 | 59 |
| 19755 Garden Ridge Ct | 0.47mi | 5/2.5 | 2,112 (-7%) | 11mo | $270,000 | $128 | 55 |
| 12462 Amber Waves Rd | 0.21mi | 4/2.0 (-1) | 1,941 (-15%) | 18mo | $350,000 | $180 | 42 |
Match score weights: distance 35% · size 25% · config 20% · recency 20%. Top-matched comps best support the ARV.
Projected returns pro-forma
10.0% appreciation · 0.0% rent growth · sell at horizon
- IRR
- 18.1%
- Equity multiple
- 2.47×
- Total profit
- $139,616
- Equity at exit
- $306,298
- IRR
- 16.3%
- Equity multiple
- 5.50×
- Total profit
- $428,169
- Equity at exit
- $660,543
Cash invested: $95,200 (down + closing). Projections, not guarantees.
Landlord ↔ Tenant lean methodology
- Overall (STATE)
- 87 Strongly Landlord-Friendly
- State Florida
- 87 Strongly Landlord-Friendly · R+3
- County
- — inherits STATE
- City
- — inherits STATE
ZIP-level market 33974
- Home prices YoY
- 5.8%
- Rents YoY
- -4.7%
- Active inventory
- 2460
- Price-to-rent
- 11.0×
Monthly cashflow live
- Estimated rent
- $2,567 high interval (Pro) →
- Mortgage (P&I)
- −$1,783
- Tax from tax record
- −$504 /mo · $6,044/yr
- Insurance
- −$142
- HOA
- −$200
- Vacancy / Maint / Mgmt
- −$539
- Net cashflow
- $-600
Break-even live
UW: 25.0% down · 7.5% · 30yr · 1.5% tax · 5.0% vac · 8.0% maint · 8.0% mgmt
Financing live
Cash to close
- Down payment
- $85,000
- Closing costs
- $10,200
- Reserves months
- —
- Total cash needed
- —
Loan-product check · same deal, 3 products live
Conventional
25% down · 7.5% · 30yr
- Down + closing
- —
- Monthly P&I
- —
- Monthly cashflow
- —
- DSCR
- —
- Eligible?
- —
Personal DTI + credit; lowest rate.
DSCR
20% down · 8.5% · 30yr
- Down + closing
- —
- Monthly P&I
- —
- Monthly cashflow
- —
- DSCR
- —
- Eligible?
- —
No personal income docs; deal must DSCR.
Hard money
10% down · 12.0% · 12mo
- Down + closing
- —
- Monthly P&I
- —
- Monthly cashflow
- —
- DSCR
- —
- Eligible?
- —
Short-term bridge; refi at stabilization.
Rent comps 24 comps
| Address | Beds | Baths | Sqft | Rent | $/sqft | DOM | Units | Dist |
|---|---|---|---|---|---|---|---|---|
| 20050 Caroline Creek Pl Lehigh Acres, FL | 4.0 | 2.5 | 1885 | $2,300 | $1.22 | 23d | 1 | 0.01mi |
| 19972 Green Pasture Rd Lehigh Acres, FL | 5.0 | 2.5 | 2959 | $3,000 | $1.01 | 21d | 1 | 0.15mi |
| 19931 Green Pasture Rd Lehigh Acres, FL | 4.0 | 2.0 | 1817 | $2,248 | $1.24 | 23d | 1 | 0.16mi |
| 12441 Dakota Ridge Pl Lehigh Acres, FL | 4.0 | 2.5 | 1885 | $2,150 | $1.14 | 23d | 1 | 0.16mi |
| 12312 Amber Waves Rd Unit NA Lehigh Acres, FL | 4.0 | 2.0 | 1941 | $2,325 | $1.20 | 23d | 1 | 0.16mi |
| 12312 Amber Waves Rd Lehigh Acres, FL | 4.0 | 2.0 | 1937 | $2,325 | $1.20 | 19d | 1 | 0.16mi |
| 19882 Green Pasture Rd Lehigh Acres, FL | 4.0 | 2.0 | 1942 | $2,350 | $1.21 | 23d | 1 | 0.21mi |
| 11621 Savanna Lakes Blvd Lehigh Acres, FL | 4.0 | 3.0 | 2174 | $2,200 | $1.01 | 15d | 1 | 0.24mi |
| 11613 Savanna Lakes Blvd Lehigh Acres, FL | 5.0 | 3.0 | 2451 | $2,700 | $1.10 | 15d | 1 | 0.24mi |
| 11902 Savanna Lakes Blvd Lehigh Acres, FL | 6.0 | 3.0 | 3041 | $2,750 | $0.90 | 15d | 1 | 0.58mi |
| 606 Morningmist Ln Lehigh Acres, FL | 4.0 | 2.5 | 1817 | $2,295 | $1.26 | 3d | 1 | 0.60mi |
| 11634 Savanna Lakes Blvd Lehigh Acres, FL | 5.0 | 3.0 | 2451 | $2,650 | $1.08 | 21d | 1 | 0.64mi |
| 696 Homestead Rd S Lehigh Acres, FL | 4.0 | 2.0 | 1777 | $2,200 | $1.24 | 23d | 1 | 0.81mi |
| 532 Ilaria Ct Lehigh Acres, FL | 4.0 | 2.0 | 1598 | $2,300 | $1.44 | 15d | 1 | 0.81mi |
| 437 Reading St Lehigh Acres, FL | 4.0 | 2.0 | 1833 | $1,795 | $0.98 | 1d | 1 | 0.88mi |
| 541 Chalet Ave S Lehigh Acres, FL | 4.0 | 3.0 | 1650 | $2,400 | $1.45 | 23d | 1 | 0.91mi |
| 467 Raymer St Lehigh Acres, FL | 4.0 | 2.0 | 1833 | $1,850 | $1.01 | 10d | 1 | 0.92mi |
| 477 Rayford St Lehigh Acres, FL | 4.0 | 3.0 | 1715 | $2,000 | $1.17 | 23d | 1 | 0.96mi |
| 418 Pickford Ave Lehigh Acres, FL | 4.0 | 2.0 | 1937 | $2,450 | $1.26 | 23d | 1 | 0.99mi |
| 19525 Fairhill Ct Lehigh Acres, FL | 6.0 | 3.0 | 2463 | $2,499 | $1.01 | 23d | 1 | 1.03mi |
| 335 Parish Dr Lehigh Acres, FL | 4.0 | 3.0 | 2205 | $2,390 | $1.08 | 10d | 1 | 1.11mi |
| 10329 Canal Brook Ln Lehigh Acres, FL | 4.0 | 2.5 | 2462 | $2,600 | $1.06 | 23d | 1 | 1.36mi |
| 10601 Crossback Ln Lehigh Acres, FL | 5.0 | 3.0 | 2634 | $2,800 | $1.06 | 23d | 1 | 1.41mi |
| 270 Silent Lake Dr Lehigh Acres, FL | 4.0 | 2.0 | 1800 | $1,895 | $1.05 | 11d | 1 | 1.41mi |
HOA detail
- Monthly dues
- $200 · $2,400/yr
- Likely covers
- watersecurity
Listing history 25 events
-
2026-06-17days on market $339,999 Active 30 DOM
-
2026-06-16days on market $339,999 Active 29 DOM
-
2026-06-15days on market $339,999 Active 28 DOM
-
2026-06-13days on market $339,999 Active 26 DOM
-
2026-06-10days on market $339,999 Active 23 DOM
-
2026-06-09days on market $339,999 Active 22 DOM
-
2026-06-08days on market $339,999 Active 21 DOM
-
2026-06-07days on market $339,999 Active 20 DOM
-
2026-06-03days on market $339,999 Active 16 DOM
-
2026-06-02days on market $339,999 Active 15 DOM
-
2026-06-01days on market $339,999 Active 14 DOM
-
2026-06-01price $339,999 Active 13 DOM
-
2026-05-31days on market $344,000 Active 13 DOM
-
2026-05-18$349,999 Active
-
2026-04-30historical
-
2026-04-08$2,500
-
2026-03-22price $390,000
-
2026-03-06price $399,000
-
2026-02-26price $417,000
-
2025-10-22price $419,999
-
2025-10-01$428,000 Active
-
2025-08-31historical
-
2025-04-15price $429,999
-
2025-01-28$440,000 Active
-
2023-09-15soldstatus $363,300
ⓘ Source: listings_history table (triggers on properties + properties_extension) + one-shot
backfill from property_details.listing_events for pre-trigger history.
Tax reassessment forecast FL · Resets to sale price
- Current annual tax
- $6,044 · $504/mo
- Projected year-2 tax
- $6,044 · $504/mo
- Expected delta
- $0/yr ($0/mo · 0.0%)
ⓘ Screening estimate from a state-policy table — verify with the county assessor before closing.
Climate risk First Street
- Flood 1/10 Low FEMA zone X (unshaded) · 0% chance over 30 yrs
- Wildfire 5/10 Major
- Heat 10/10 Extreme 7 d/yr ≥108°F today · 28 d/yr by 30 yrs out
- Wind 10/10 Extreme 99% chance of damaging wind over 30 yrs
- Air quality 2/10 Low 1 unhealthy d/yr today · 2 by 30 yrs out
Nearby sold comps map
Loading sold comps map…
Walkable amenities ~0.75 mi
Loading nearby amenities…
Taxation est. · year 1
- Rental income
- $30,804
- − Mortgage interest
- −$19,045
- − Property taxes
- −$6,044
- − Insurance
- −$1,700
- − Repairs & maintenance
- −$2,464
- − Management
- −$2,464
- − HOA
- −$2,400
- − Depreciation
- −$9,891
- Taxable loss
- −$13,206
- Est. tax savings @ 24.0%
- +$3,169
- After-tax cash flow
- $-4,036/yr
For passive investors: Depreciation is non-cash, so a rental often shows a tax loss while cash-flowing — sheltering income. Rental losses are passive: they offset passive income freely, and up to $25,000/yr can offset ordinary (W-2) income if you actively participate and your MAGI is under $100k (phasing out to $0 by $150k); unused losses carry forward. On sale, claimed depreciation is recaptured at up to 25%, and gains may owe capital-gains tax (a 1031 exchange can defer both). Figures are a year-1 estimate at your 24.0% rate — not tax advice; consult a CPA.
Schools (NCES district)
- District
- Lee
- NCES district ID
- 1201080
- Math proficiency
- 47% ▼ -11.00%
- Reading proficiency
- 50% ▼ -4.00%
- Median HH income
- $49,518
- Composite
- 41.49/100
- National rank
- #3458
- State rank
- #42 of 73 in FL
Livability — Lehigh Acres
- Score
- 59/100
- State rank
- #826
- US rank
- #20055
Category grades
Schools grade is shown separately in the Schools card above.
Census & demographics
- Census place
- Lehigh Acres, FL
- County
- Lee County · 788,662 people
- City population
- 130,638
- Metro
- Cape Coral-Fort Myers, FL
- Population (ZIP)
- 19,927
- Household income
- $72,192
- Rent vs Own
- Severe rent burden
- 434.0
Population outlook (Lee County) Hauer SSP2
- Today (2025)
- 871,946 people
- By 2030
- 955,468 · +9.6%
- By 2040
- 1,113,587 · +27.7%
- By 2050
- 1,256,891 · +44.1%
- By 2075
- 1,560,270 · +78.9%
- By 2100
- 1,726,848 · +98.0%
Race, ethnicity, and origin ACS 2023
- Neighborhood character
- Diverse neighborhood (Simpson 0.64)
- Race & ethnicity
- Hispanic / Latino 52% Two or more races 31% White 26% Black 18%
- Hispanic origin (detail)
- Mexican 12% Puerto Rican 7% Cuban 20% Dominican 4%
- Common ancestry
- Hispanic 7% Italian 1% Portuguese 1%
- Foreign-born
- 32% · Canada, Jamaica
- Languages at home
- 48% English-only · Spanish 43% French/Haitian/Cajun 7% Other Indo-European 1%
Political lean MEDSL · Lee
- 2024 margin
- Strong R (+28.4) · D 35.5% · R 63.9%
- 2008→2024 swing
- -18.0pp toward R · 2008: -10.4pp · 2024: -28.4pp
- All cycles
- 2024: R+28.4 2020: R+19.2 2016: R+20.4 2012: R+16.6 2008: R+10.4
Not yet ingested
- Civics
- —
Market trends
- HPI YoY
- ▲ 16.53%
- Current HPI
- 303.3399
- Rent YoY
- ▼ -4.68%
- Metro
- Cape Coral-Fort Myers, FL
- State GDP YoY
- ▲ 3.28%
- F500 in state
- 36
Industry mix (Fortune 500 HQ in FL)
| Industry | F500 HQs | Revenue |
|---|---|---|
| Industrial Technology | 2 | $29B |
|
||
| Insurance | 2 | $17B |
|
||
| Retail | 1 | $60B |
|
||
| Technology Distribution | 1 | $58B |
|
||
| Homebuilding | 1 | $35B |
|
||
| Technology Manufacturing | 1 | $35B |
|
||
Price history
-3.7% since first listed12 events — show timeline
- 2026-05-18 Listed $349,999 NAPLESMLS
- 2026-04-30 Listing Removed — FORTMLS
- 2026-04-08 Listed for Rent $2,500 TENANTTURNER2
- 2026-03-22 Price Changed $390,000 FORTMLS
- 2026-03-06 Price Changed $399,000 FORTMLS
- 2026-02-26 Price Changed $417,000 FORTMLS
- 2025-10-22 Price Changed $419,999 FORTMLS
- 2025-10-01 Listed $428,000 FORTMLS
- 2025-08-31 Listing Removed — FORTMLS
- 2025-04-15 Price Changed $429,999 FORTMLS
- 2025-01-28 Listed $440,000 FORTMLS
- 2023-09-15 Sold (Public Records) $363,300 Public Records
Property tax history
+179.6%/yrLatest (2025): $6,044 · +13.3% YoY. Source: county tax records.
Cash-flow waterfall
monthlySold comps — $/sqft
last 12 mo · ≤1 miLoading sold comps…